Introduction
The current set of Community Food System (CFS) Indicators developed by the Oregon Community Food System Network obscures the differential access to power and resources experienced by people with varying identities. Bringing a diversity, equity and inclusion (DEI) lens to these indicators can make explicit the disparities that may exist among different groups.
OCFSN is a collaboration of 56 nonprofit organizations and allies dedicated to strengthening local and regional food systems to deliver better economic, social, health and environmental outcomes across the state. OCFSN is committed to putting its equity statement and DEI commitments into practice. Examining the CFS Indicators is part of this process.
Rural Communities Explorer, which houses and manages the CFS Indicators for OCFSN, conducted this audit in spring 2020. This report and appendix provide a summary of audit findings. OCFSN has opportunities both to intersect DEI with existing indicators based on the availability of publicly available data sets and also to add other indicators that might address important DEI concerns in the food system that the current set does not currently address. We also discuss some of the challenges in using a DEI lens with the indicators.
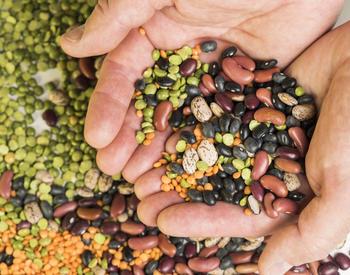
The CFS Indicators span the food system, from production to consumption, and data are available at the state and county level. The CFS Indicators are a partnership between the Oregon Community Food Systems Network, the Oregon State University Center for Small Farms & Community Food Systems, and Rural Communities Explorer. Explore data and reports.
What aspects of DEI did we consider?
DEI metrics can include race/ethnicity, gender, gender identity, sexual orientation, military service and other identities. For this report, we focused on race/ethnicity, gender and military service, given the lack of publicly available data for other dimensions.
What did we find?
Race/ethnicity and gender
Of the current 39 CFS indicators, race/ethnicity and gender (M/F only) data are publicly available for the state and for counties for 10 indicators:
- Population.
- Poverty rates.
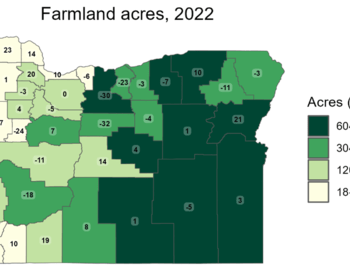
- Land in farms.
- Number of farms.
- Average age of farmer.*
- Average value per farm acre.*
- Farms by sales (distribution of dollar amounts).*
- Farms producing specific products.*
- Organic farms*.
- Beginning farmers and ranchers.*
* Not all counties publicly available. Data suppressed to avoid disclosing identifying information for individual operations.
For the remaining 29 indicators, race/ethnicity and gender (M/F only) data are:
- Collected but not publicly available: 10.
- Similar indicator available for race/ethnicity: 1.
- Available for only the state: 1.
- Not collected but could be intersected with race/ethnicity demographics: 8.
- Not collected and cannot be intersected with population demographics: 7.
- Potentially under development: 1.
- Indicator no longer collected by source: 1.
The ten indicators with race/ethnicity and gender (M/F only) data publicly available would be relatively simple to add to the current CFS Indicators collection. Poverty rate could be calculated in multiple ways and should be considered carefully. “Farms producing specific products” (a sub-collection of indicators that includes “farms with goats” and “farms with milk cows”), while available for the state and some counties, could be challenging to interpret. Accordingly, supplementary race/ethnicity and gender profiles for different products might be a better choice than including them within the collection.
The appendix presents the full audit of whether race/ethnicity or gender data are available for each existing indicator.
Military service
Military service could be considered an identity of interest for a DEI lens, particularly as veterans transition to civilian life and face employment challenges. Many food system programs specifically target veterans in Oregon, including the Growing Veteran Agripreneurs program in Southern Oregon, workshops provided by OSU Extension throughout Oregon, and USDA grants and loan programs for veterans. The Census of Agriculture collects data on military service. Farms with producers or principal producers with military status is publicly available for all counties and should be considered for inclusion in the CFS Indicators collection. Data published at the state level intersects military service with race, ethnicity and gender. If military service becomes a target priority for OCFSN, these various intersections could be explored in greater detail in the future.
Challenges to incorporating DEI dimensions into the CFS Indicators
The current CFS indicators are sourced from publicly available sources. The use of publicly available data sets provides several benefits. These data typically are free to access; they are regularly collected with consistent methodology that allows for analysis of change over time; and they are reliable. When methodology changes, source agencies or organizations often provide a clear explanation of what has changed and what is still comparable. However, there are challenges to using publicly available datasets.
First, public datasets often do not include some aspects of DEI. Gender identity and sexual orientation are examples: few state- and national-level surveys collect LGBTQIA demographic information. While these identities may not currently be available for inclusion in the CFS indicators set, they should be considered in other community food system work.
In addition, while surveys may collect DEI-related information, source agencies or organizations may not publish the information most relevant to users. Many of the CFS indicators come from the Census of Agriculture, conducted every five years by USDA. Starting with the 2017 Census of Agriculture, demographic details are collected for up to four producers per farm operation. However, published tables may not provide every intersection of interest. While USDA does generate race/ethnicity/gender profiles with Census of Agriculture results, counties with small representation tend to have suppressed race or ethnicity data due to confidentiality.
In addition, these profiles summarize producers using a “race alone or in combination with other races” framework. For example, a producer who identifies as “Asian” and “Pacific Islander” will be counted on both profiles. While this framework may better reflect the lived experience of the producer, it does make it more complicated to compare across profiles. Other tables from the Census of Agriculture do not use the “race alone or in combination with other races” framework and instead use “race alone” or “reporting more than one race.”
While the Census of Agriculture collects information on whether producers own the land they operate and reports demographics on these owners, there are limitations to their methodology. According to their methodology, hired managers for corporate-owned farms are considered the farm producers. This makes a hired manager under a corporation equivalent to a family-farm owner-operator, which is unlikely to address equity across demographics. Accordingly, we discourage using Census of Agriculture information to frame conversations about ownership.
Reaching beyond the current Indicators
OCFSN could also provide more information about race/ethnicity, gender, and military service in the food system by adding the following indicators, currently available in public datasets:
- Producers (or principal producers) by race/ethnicity.
- Producers (or principal producers) by gender (M/F only).
- Average farm size by race/ethnicity.*
- Average farm size by gender.
- Producers with military service.
- % of farms with at least one non-white principal producer.
- % of farms with at least one female principal producer.
* Not all counties publicly available. Data suppressed to avoid disclosing identifying information for individual operations.
While the Census of Agriculture emphasizes collection of demographic information about producers, finding publicly available demographic characteristics of food system workers outside of producers is challenging. State-level demographic information on farmworkers or off-farm labor can be generated from Public Use Microdata Sample (PUMS) data from the US Census Bureau American Community Survey, but more granular geographies are impractical from PUMS data in Oregon. The next smaller geographic unit (PUMA) requires a population of at least 100,000 people, and for Oregon, several PUMAs contain three or more counties.
Other food system employment categories could be added to the suite of indicators. Data could be obtained from Oregon Employment Department on employment, total wages and annual average wage for “food and beverage stores” and “food services and drinking places.” In 2019, both of these industries saw an annual average wage of under $30,000, suggesting that many of these workers face the struggles of living in low-income households.
Proprietary industry data could be purchased to complement publicly available data but should be considered carefully. For example, acquiring business addresses from a private source could be utilized to assess different food choices in neighborhoods, but this could become cost-prohibitive to update regularly over time.
Concluding thoughts
This audit has revealed some opportunities to add a DEI lens to the Community Food Systems Indicators, particularly around race/ethnicity, gender, and military service. While some DEI metrics are straightforward and consistently available across all geographies, others are more challenging due to suppressed data or the need to intersect broader population demographics with the existing indicator.
Furthermore, currently available public data may not address important inequities in the food system or adequately address areas of concern or interest to members of OCFSN. We suggest referencing “Measuring Racial Equity in the Food System: Established and Suggested Metrics” for inspiration from examples of metrics derived from primary data collection. Indicator collections are most effective when actively used and connected with broader activities.
OCFSN needs to decide on next steps based on how it plans to use the CFS Indicators going forward. The OCFSN Leadership Team, after reviewing the results of our audit, has already requested that we add race/ethnicity and gender dimensions to the ten indicators for which this is possible now. This will begin in 2021, with the next Indicator update report, which will be posted on the OSU Extension and OCFSN websites.
Appendix: DEI Audit of OCFSN Indicators
Abbreviations used in table:
- Y = Available for state and all counties.
- Y* = Available for state and some counties.
- NP = Collected but not publicly available.
- SI = Similar indicator available.
- S = Available only for state.
- HR = Not collected but could be intersected with race/ethnicity demographics.
- ? = Potentially under development.
Source abbreviations and full names are listed at end of table.
| Existing Indicator | Source | Race & Ethnicity | Male/Female | Notes |
|---|---|---|---|---|
| Annual population estimate | USCB ACS | Y | Y | Previously PSU Population Research Center source, but no R&E with PSU PRC |
| SNAP | OR DHS | NP | NP | DEI data are collected in administrative records. USDA reports some state-level info. ACS has household estimates. |
| Farmers Markets Accepting SNAP | USDA | HR | Could do "highly represented minority" county | |
| Poverty Rate | USCB ACS | Y | Y | Poverty rate within group or poverty distributed among groups |
| Average Cost of a Meal | Feeding America | HR | Could do "highly represented minority" county, DEI data not modeled | |
| Food Insecurity % | Feeding America | S | Mark Edwards (OSU) models state-level R&E | |
| Grocery Stores | USCB CBP | HR | Could do "highly represented minority" county. DEI data not collected in survey. | |
| Pop per Grocery Store | USCB CBP | HR | Could do "highly represented minority" county. DEI data not collected in survey. | |
| Specialty Food Stores | USCB CBP | HR | Could do "highly represented minority" county. DEI data not collected in survey. | |
| Low income and low access to grocery store | USDA ERS | SI | R&E low access to grocery stores available | |
| Farm Employment | BEA | DEI data not collected by this source | ||
| Farm compensation | BEA | DEI data not collected by this source | ||
| Compensation per farm job | BEA | DEI data not collected by this source | ||
| Land in Farms | Census of Ag | Y | Y | Would need to decide "producers" or "principal producers" |
| Number of Farms | Census of Ag | Y | Y | Would need to decide "producers" or "principal producers" |
| Average Age of Farmer | Census of Ag | Y* | Y* | Publicly available race/ethnicity available for state and some counties. DEI data collected in census. |
| Average Value per Farm Acre | Census of Ag | Y* | Y* | Publicly available race/ethnicity available for state and some counties. DEI data collected in census. |
| Farms by Sales Distribution | Census of Ag | Y* | Y* | Publicly available race/ethnicity available for state and some counties. DEI data collected in census. |
| Farms by Primary Production | Census of Ag | NP | NP | Not publicly available. DEI data collected in census. |
| Food Crops Breakout | Census of Ag | NP | NP | Not publicly available. DEI data collected in census. |
| Farms Producing Specific Products breakout | Census of Ag | Y* | Y* | Publicly available race/ethnicity available for state and some counties. DEI data collected in census. |
| Organic Farms | Census of Ag | Y* | Y* | Publicly available race/ethnicity available for state and some counties. DEI data collected in census. |
| Beginning Farmers and Ranchers (5/10 years) | Census of Ag | Y* | Y* | Publicly available race/ethnicity available for state and some counties. DEI data collected in census. |
| Farmers Markets | USDA | HR | Could do "highly represented minority" county | |
| Population per Farmers Market | USDA | HR | Could do "highly represented minority" county or population by R&E per Farmers Market | |
| Food Processors | USCB CBP | DEI data not collected by this source | ||
| Food Processor Employment | USCB CBP | DEI data not collected by this source | ||
| Food Processors Payroll | USCB CBP | DEI data not collected by this source | ||
| Food Processors by employee size | USCB CBP | DEI data not collected by this source | ||
| Nonemployer food manufacturing | USCB NS | ? | Might be in development - national-level study prototyped a method | |
| Farm 2 School Districts | USDA F2S | HR | Could do "highly represented minority" county by school enrollment | |
| Farms Value-Added Products | Census of Ag | NP | NP | Not publicly available. DEI data collected in census. |
| Farms with Direct (Consumer) Sales | Census of Ag | NP | NP | Not publicly available. DEI data collected in census. |
| Value Farm Direct (Consumer) | Census of Ag | NP | NP | Not publicly available. DEI data collected in census. |
| Value Direct per Farms Selling Direct (Consumer) | Census of Ag | NP | NP | Not publicly available. DEI data collected in census. |
| Value of Direct (Consumer) per Capita | Census of Ag | NP | NP | Not publicly available. DEI data collected in census. |
| CSA | Census of Ag | NP | NP | No longer collected |
| Farms Direct to Retail | Census of Ag | NP | NP | Not publicly available. DEI data collected in census. |
| Farms w/ on-farm packing | Census of Ag | NP | NP | Not publicly available. DEI data collected in census. |
| Possible New Indicators Connected to Existing Indicators | Source | R&E | M/F | Notes |
|---|---|---|---|---|
| Producers by R/E & Gender | Census of Ag | Y | Y | Will be added in future updates |
| Average farm size | Census of Ag | Y* | Y* | Publicly available race/ethnicity available for state and some counties. DEI data collected in census. |
| Producers with military service | Census of Ag | Intersections with R&E/gender available at state. | ||
| Producers with military service | Census of Ag | Y | Y | Overlapping categories- farms can have up to four principal producers. |
Sources
- BEA = U.S. Bureau of Economic Analysis
- Census of Ag = U.S. Department of Agriculture (USDA) Census of Agriculture
- Feeding America = Feeding America (non-profit organization)
- OR DHS = Oregon Department of Human Services
- Private = Proprietary information – source not yet specified
- USCB ACS = U.S. Census Bureau – American Community Survey
- USCB CBP = U.S. Census Bureau – County Business Patterns
- USCB NS = U.S. Census Bureau – Nonemployer Statistics
- USDA = U.S. Department of Agriculture
- USDA ERS = USDA Economic Research Service
- USDA F2S = USDA Farm to School Census