In the second article in this collection, I’ll unpack some of the big picture trends found in Part 1. That article showed how the number of farms and acres both declined in Oregon over 2017-2022, contrasting with an increase in the real value of total farm sales. Here, we’ll take a closer look at the distribution of farms and farmland by acreage and sales revenue.
Farms and farmland acres by acreage class
- A farm is defined by the U.S. Department of Agriculture’s Census of Agriculture as an operation where $1,000 or more of agricultural products were raised and sold, or normally would have been sold, during the census year.
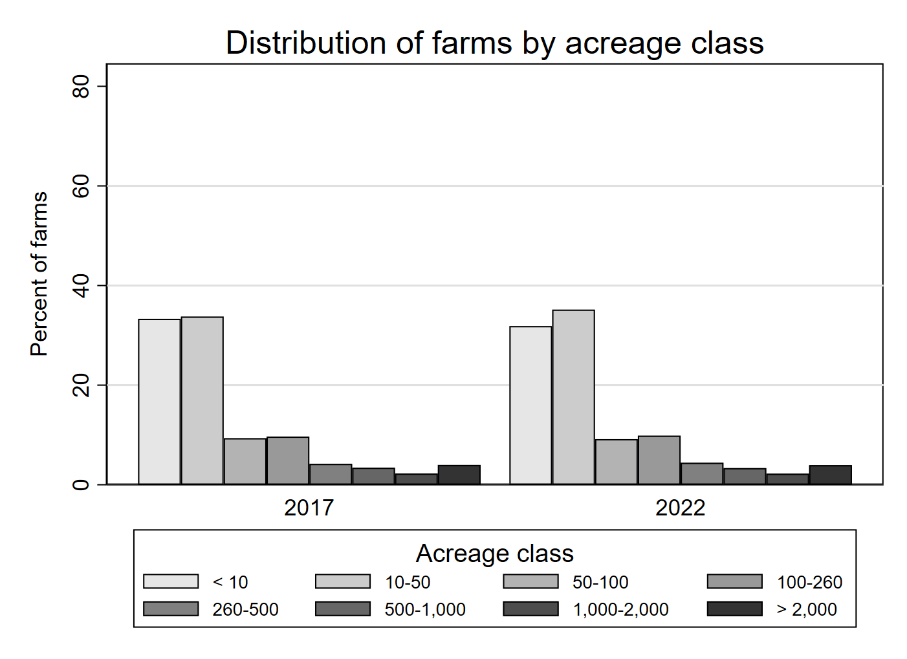
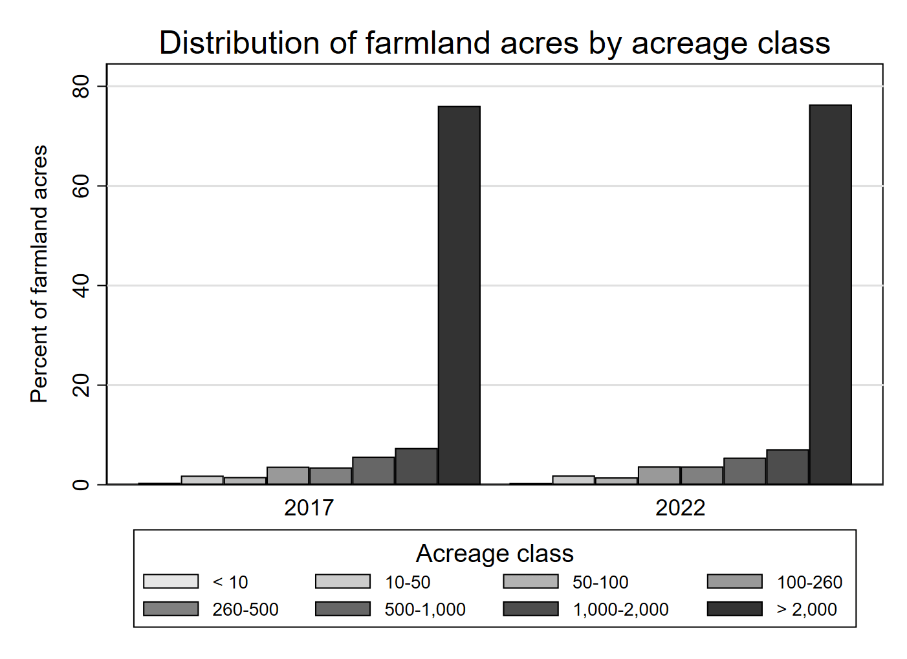
- In 2022, the distributions of farms and farmland acres by acreage class look very similar to the distributions for the previous census in 2017 (Fig. 1). It is important to note that the acreage classification includes both land that is owned and rented into an operation.
- A majority of the 35,547 farms in Oregon are small-acreage. The smallest farms, or those with less than 10 acres, account for 32% of all farms. Farms between 10 and 50 acres account for 35% of all farms.
- Large-acreage farms are relatively rare, accounting for just 6% of all farms. However, they are responsible for a disproportionately large share (83%) of Oregon’s farmland acreage.
- In terms of acreage, small farms (less than 50 acres) account for just 2% of all farmland. Large farms (greater than 2,000 acres) account for 76% of all farmland.
- The similarity of both distributions across years (Fig. 2) suggests that the declines in farms and farmland acres observed between 2017 and 2022 were not concentrated among farms of a specific size, but rather were spread out fairly evenly across acreage classes.
Farms and farmland acres by sales class
- Sales class is defined in the census to mean the total value of all agricultural products sold, not including government payments or other forms of farm-related income, such as agritourism revenue.
- The distribution of farms by sales class looks relatively similar between 2017 and 2022 (Fig. 3). The most notable trend was within the lowest sales class, which declined from 31% to 27% of all farms.
- We learned in part 1 that the census is reporting a decline in the number of farms throughout the state. While it might be tempting to infer that the lowest sales farms are responsible for that decline, remember that farms with less than $1,000 in actual sales are, by definition, capable of producing over $1,000 worth of output. It is possible that some of the low-sales farms in 2017 simply realized their full production and sales capacity in 2022 and moved up one or more classes.
- Another contributing factor is inflation. The sales categories reported in the census are in nominal terms (i.e., not adjusted for inflation), so it is also possible that some of the low-sales farms are earning more dollars of sales revenue, even though the real value of their sales in purchasing-power terms is similar to what it was in 2017. Particularly, note that the eight highest sales categories ($5,000 and above) all had small increases in farm percentages between 2017 and 2022.
- If we consider the number of farms, as opposed to percentages, however, the role played by lower sales farms becomes clearer (Table 1). In 2022, there were:
- 2,197 fewer farms with less than $1,000 in sales.
- A decline of 3,028 farms with sales of less than $10,000.
- Given that Oregon lost 2,069 farms overall since 2017, it would seem likely that at least some came from these low-sales classes, but we can’t say this with any degree of certainty, as we only observe net changes among the categories.
| Number of farms | |||
|---|---|---|---|
| Sales class | 2017 | 2022 | Change |
| < $1,000 | 11,662 | 9,465 | -2,197 |
| $1,000 - $5,000 | 9,814 | 9,206 | -608 |
| $5,000 - $10,000 | 4,159 | 3,936 | -223 |
| $10,000 - $25,000 | 3,695 | 4,055 | 360 |
| $25,000 - $50,000 | 2,096 | 2,268 | 172 |
| $50,000 - $100,000 | 1,626 | 1,714 | 88 |
| $100,000 - $250,000 | 1,755 | 1,693 | -62 |
| $250,000 - $500,000 | 1,089 | 1,146 | 57 |
| $500,000 - $1,000,000 | 803 | 853 | 50 |
| > $1,000,000 | 917 | 1,211 | 294 |
| Total | 37,616 | 35,547 | -2,069 |
- When considering the number of farms at or above the $10,000 sales class, most of them saw an increase in farm count (Table 1). This would seem to be partly driven by upward movement from the lower classes, as mentioned previously.
- The number of farms with over $1 million in sales increased considerably since 2017.
Acreage by sales class trends
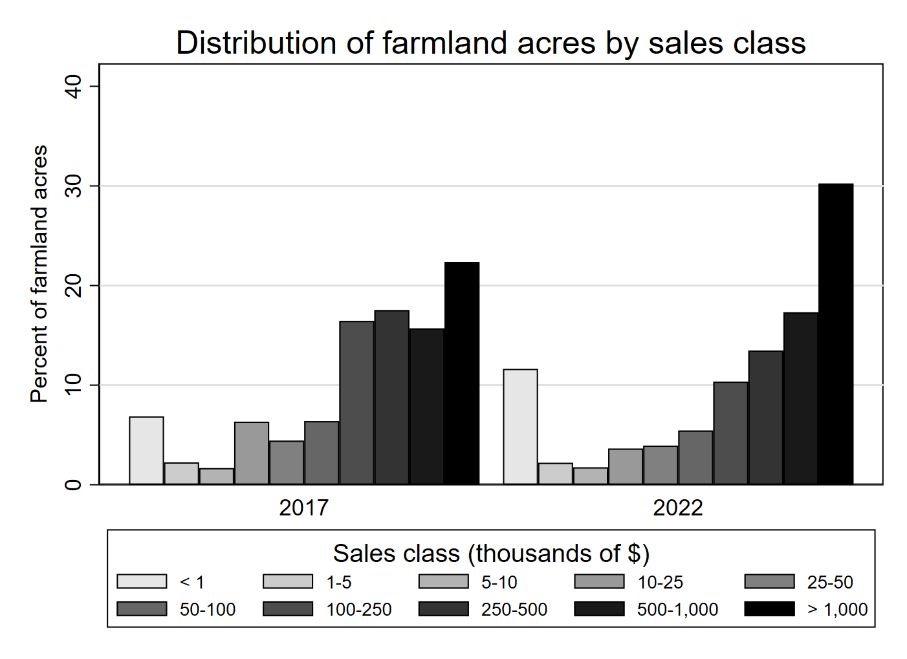
- Looking at the distribution of farmland acres by sales class (Fig. 4), we see increases at both extremes of the classification (less than $1,000 in sales and greater than $1 million in sales).
- At the same time, there are large declines in the acreage for smaller commercial farms with between $100,000 and $500,000 in sales.
- In acreage terms (not shown), these sales classes saw a combined decline of 1.8 million acres.
- Let's look at the changes in the relationship between sales class and farm size (Table 2).
- The average size of a farm in the lowest sales class (less than $1,000) doubled between 2017 and 2022.
- Statewide drought during 2021-2022 may have impacted the doubling of that class, because normally productive operations may have earned minimal sales revenue during the census period.
- Across all other sales categories, the average farm size for both years increases with sales class.
| Average farm size (acres) | |||
|---|---|---|---|
| Sales class | 2017 | 2022 | Change |
| < $1,000 | 94 | 188 | 94 |
| $1,000 - $5,000 | 37 | 37 | 0 |
| $5,000 - $10,000 | 64 | 68 | 4 |
| $10,000 - $25,000 | 274 | 137 | -136 |
| $25,000 - $50,000 | 338 | 265 | -73 |
| $50,000 - $100,000 | 628 | 486 | -142 |
| $100,000 - $250,000 | 1,496 | 935 | -561 |
| $250,000 - $500,000 | 2,570 | 1,799 | -771 |
| $500,000 - $1,000,000 | 3,120 | 3,105 | -16 |
| > $1,000,000 | 3,893 | 3,820 | -73 |
To summarize, between 2017 and 2022, the distribution of Oregon’s farms and farmland by acreage remained relatively constant. However, when considering sales class, the decline in Oregon’s farm count is concentrated among farms with relatively low sales revenue. Declines in farmland acreage, on the other hand, are concentrated among smaller and midsized commercial farms with sales between $100,000 and $500,000.
Disentangling this apparent contradiction is difficult with aggregated data like this, as it only reveals the net change in each farm category. If we knew the increases and decreases that contribute to the net change, we would have a much clearer picture of what is driving the Census-reported decline in Oregon’s farms and farmland between 2017 and 2022.


