Top 10 tips for diving into data
When making comparisons...
- Make multiple comparisons: Compare your community to another geographic area, like the US, a similar type of community, the larger region, or all the rural (or urban) parts of your state. Don’t stop there though; compare your community’s current rate to its past rate or to a desired rate, maybe a goal set by a community visioning process.
- Don’t compare whole numbers: Comparing whole numbers can be misleading, because of differences in the overall population. Normalize the data by calculating and comparing rates per capita or percentages.
- Look for significant differences: Calculate and examine the overlap in margins of error between values when the data come from sample surveys. This is especially important for data from small samples, and especially easy to do with data from the American Community Survey. Don’t stop at margins or error though; test the statistical significance of differences too!
When examining trends over time...
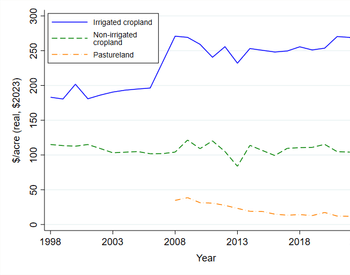
- Adjust all dollar values for inflation: Don’t forget that income, housing values and tax rates are all dollar values that should be converted to real, constant dollars. Use the Bureau of Labor Statistics’ inflation calculator.
- Pick your start and end time periods carefully: Choosing certain time periods like recessions, times of economic booms, seasonal downtimes, the baby boom, or the onset of major policy changes will affect the types of changes you see. Be careful using them, and if you do, be careful explaining the trend over time.
- Question outlier years: If you find an outlier year in your trend, find out why. Consider the influence of policy or program interventions as well as business cycles. Also check for errors in the data.
- Be careful extrapolating the past into the future: The trend may be volatile or highly dependent on external conditions that are also in flux.
- Be aware of changes in measurement: Frequently encountered changes in measurement are industry codes (SIC and NAICS), changes in school achievement testing and graduation rate calculations, and changes in question-wording between the longform of the census and its replacement, the American Community Survey.
Become an expert!
- Examine total rates and rates among groups: Break down your topic of interest by age, gender, race, occupation, employment status and other attributes. For example, learn about the poverty rate among children and the elderly, or identify total median income, and examine the percent of households in various income groups.
- Know your data definitions – what the data really represent: For example, total employment is a measure of jobs not people, and college students are counted at their college address in the census.
Top 10 tips for writing about data
Where to start...
- Find key points from a table/graph: Examine the data to find the largest changes, both positive and negative. Report when the change observed is different than expected, perhaps a number has remained stable. Also, report change that supports your argument/hypothesis.
- Do not overstate the findings: Use calculated margins of error and tests of statistical significance to decide what to report and include these measures in the write-up. Then apply a test of social/contextual significance. If differences in the data are real, are they meaningful? Do not overstate the significance or the magnitude of your findings.
- Explain your key points: Summarize key points in writing to ensure that a reader sees what you think is important and more importantly, why it is important. Rely on data comparisons to convey importance and context.
- Summaries should stand alone: Written summaries should always accompany a table or graph, but don’t assume that anyone who is reading the summary will look at the table to understand your point. Report the major data findings in both the table and the summary.
Improving your skills...
- Capture your audience’s attention: Data analysis becomes useful when it is read by others. A written summary should hold a reader’s attention and be easy to understand. The same writing principles for a persuasive essay apply here. Start with the most important points first, vary your sentence structure, and connect multiple points across different tables coherently and with transitions.
- Improve the readability of your data: A table should offer precise measurement of your data, but approximating this information in your writing can make it clearer to understand. Instead of: 35% or 11% Try: Approximately one-third or around 1 in 10.
- Write with enough numbers but not too many: Don’t try to incorporate every number into a sentence, but try to write informative sentences.
Become an expert!
- Write for your audience: Consider who this information is being presented to and why. Think about what this audience already knows and needs to know the most. If in doubt, write for the general public and include ample explanation.
- Explain what the data represent and where it came from: A single variable can have multiple definitions depending on a data source. Communicate what important variables do and do not measure and if the data definition has changed over time. Always cite the table/graph you are describing, and make sure the original source of data is appropriately attributed.
- Be aware of personal bias: All data analysis and reporting is filtered through the lens of the researcher’s personal history and experience. Consider how your own past experiences affect your interpretation of a given topic. Because it may be easier to find data that support what you think is true, recognize that and acknowledge your potential bias in your work. Seek opposing facts in your data collection, analysis and your writing of a topic.

Want to learn more about this topic? Explore more resources from OSU Extension:
Rural economic development, Community planning