The first article in this collection will look at some of the top-line numbers for Oregon from the 2022 Census of Agriculture, and comparative trends between this census and the previous one in 2017.
State summary
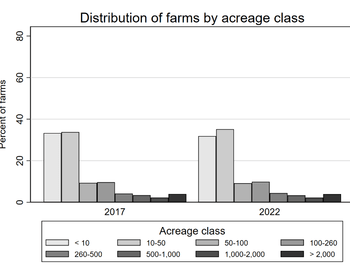
- The number of farms and farmland acres in Oregon declined between 2017 and 2022.
- Oregon lost 2,069 farms and 667,000 acres over this period, representing 5.5% and 4.18% declines, respectively.
- Compared to the United States as a whole, Oregon lost relatively fewer farms but more farmland.
- In contrast, total farm sales in Oregon increased by $865 million in inflation-adjusted terms, in what appears to be a substantial 14.64% gain. However, this increase in sales lags the U.S. average.
- Taken together, these trends point to Oregon having a slightly higher average farm size and significantly higher sales per farm and sales per farmland acre in 2022 compared to 2017.
|
|
2017 |
2022 |
Change |
% Change |
|
Farms |
37,616 |
35,547 |
-2,069 |
-5.50 |
|
|
(1.84) |
(1.87) |
|
|
|
Farmland acres (thousands) |
15,962 |
15,296 |
-667 |
-4.18 |
|
|
(1.77) |
(1.74) |
|
|
|
Total sales (million $) |
5,907 |
6,771 |
865 |
14.64 |
|
|
(1.29) |
(1.25) |
|
|
|
Note: All dollar values for 2017 are adjusted for inflation to the year 2022 using the Gross Domestic Product Implicit Price Deflator. Values in parentheses represent Oregon’s share of the national US total. |
||||
Table 2: Oregon summary of changes in per-farm acreage and sales.
|
|
2017 |
2022 |
Change |
% Change |
|
Acres per farm |
424 |
430 |
6 |
1.40 |
|
Sales per farm (2022) |
157,024 |
190,485 |
33,461 |
21.31 |
|
Sales per acre (2022) |
370,034 |
442,682 |
72,648 |
19.63 |
|
Note: All dollar values for 2017 are adjusted for inflation to the year 2022 using the Gross Domestic Product Implicit Price Deflator. |
||||
County summary
- Counties in Eastern Oregon tend to have more farmland than the rest of the state, whereas the total number of farms tends to be higher in the Willamette Valley and Southern Oregon.
- When compared to 2017, the extent and direction of changes in farms and farmland shows a more mixed pattern:
- Both Curry and Jefferson counties saw acreage declines of over 30%.
- Washington, Baker and Clatsop counties had increases in acreage of at least 20%.
- Wasco and Lincoln counties lost more than 20% of their farms over this period.
- By far, the biggest gain in farms occurred in Jackson County – 12% – which is double the second-largest increase that occurred in Deschutes County, 6%.
- The pattern of farm sales is more varied compared to those of farms and farmland, with the largest sales volumes occurring in the Willamette Valley and Morrow, Umatilla and Malheur counties in Eastern Oregon.
- Wheeler, Lane and Klamath counties all had inflation-adjusted sales declines of more than 25%.
- Josephine County had a sales gain of 86%, by far the biggest in the state, with Polk and Lake counties both seeing gains of over 50%, as well.
Note: The map colors on figures correspond to the value for 2022. Numbers within each county show percentage change compared to 2017.
To summarize, between 2017 and 2022, Oregon saw declines in the both the number of farms and farmland acres. In terms of the economic size of the sector, these losses were offset by a large gain in total sales. The next article in this series will unpack these trends.