Transcript
00:00 Patty Skinkis
This is the High-Res Vineyard Nutrition Podcast Series, devoted to helping the grape and wine industry understand more about how to monitor and manage vineyard health through grapevine nutrition research. I am your host, Dr. Patty Skinkis, Professor and Viticulture Extension Specialist at Oregon State University.
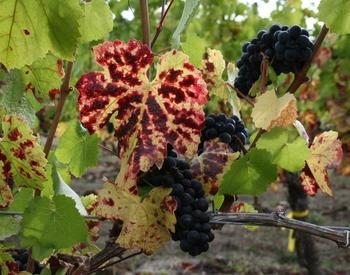
Grapevine nutrient management is important for grapevine health and production and has important implications for both farm economics and the environment. However, much of our research efforts, as you know, focus on nitrogen because it is the most important plant nutrient for growth, and it is needed at larger quantities by the plant than the other mineral nutrients. And thus, of course, there's larger quantities overall in the tissues. Nitrogen, of course, helps the plant build chlorophyll, those green pigments that we see in plant leaves, and it is used for other things though too like building amino acids which are incorporated into enzymes and proteins, all of which are required by the grapevine to grow and produce. Now, our job in the HiRes Vineyard Nutrition Project is to help quantify nutrients in the vineyard on a larger scale than we're used to. But how do we do that effectively once these nutrients, which are minerals, are taken up by the grape vine and incorporated into these different organs? Well, our eyes naturally do this when we look at plants as we look for greenness. Anybody who's ever done some scouting in the vineyards, we know, will look for cues of an unhealthy plant that is less green, yellow, and necrotic. And our eyes do this really well by looking at the entire vineyard or rows, and so essentially looking at the plant canopy overall. However, our current standards, as we've talked about in this podcast over a number of different episodes, we talked about quantifying plant nutrients with tissues. And we're not looking at the whole canopy, we're not looking at whole leaves even, sometimes we're just looking at the leaf blade or the petiole. And so, we're going to step out of just looking at how we've done things as our standard, looking at very small amount of tissues today, and we're going to talk about taking it to the next level, looking at the bigger picture, much like our eyes do. So, joining us today is Dr. Alireza Pourreza. He is an assistant professor and director of the Digital AG Lab at UC Davis, and he's a co-PI on this project, a very important member of our HiRes Vineyard Nutrition Team, because he helps all of us viticulturists think outside of the box into this world of AI (artificial intelligence) and engineering that we are not at all familiar with. And he's been working several years on this question of monitoring plant health and nutrient status specifically in orchards and vineyards. Today he's going to be talking to us about his specific research into this arena but looking at leaf versus whole canopy sensing for nitrogen. Thank you for joining us today, Ali.
03:04 Alireza Pourreza
Of course, thank you for having me. I'm glad to be here with you today.
03:07 Patty Skinkis
So can you tell us a little bit about the research that you're doing to take us from those fine detailed measurements at the potted level-- potted grapevines--or even looking at pieces of the grapevine. I know you're working with Matt Fidelibus on some of this and we talked about this in season 1 of the podcast, but can you tell us a little bit more about the research and diving into the details. So, what are the primary objectives?
03:38 Alireza Pourreza
Of course, so our main goal in this project is to develop a methodology for mapping the vineyard nutrition status, and at this time, we are focusing mostly on nitrogen but eventually we will consider other macro and micronutrients. The desired method that we are looking for should be accessible to all growers, that's regardless of the farm size: a small size, large size growers should be accurate enough, should work consistently regardless of the grape variety, regardless of the trellis system, the phenology, the geographic location, and it should be fast. In other words, it should be able to map a large area in a short time. When we think about all of these conditions that the methodology should have, the best available approach and the best option that comes to mind is using drones or un-crewed aerial vehicles equipped with multi-spectral sensors. So, we are trying to develop a methodology that people can use with the off-the-shelf drones and multi-spectral cameras that are readily available in the market, so that they can do frequent monitoring for nitrogen and also for other stress, for other reasons. Yeah, hopefully by the end of the project we will achieve this goal.
05:15 Patty Skinkis
Can you tell us a bit about the trials that you are currently doing or have done and how you've gone about trying to address this issue of trying to do sensing at different times when the canopy is smaller, or larger, or taking those other factors into account that, like you just mentioned: time of day, sunlight exposure, things like that? So, can you describe some of the work that you've done?
05:42 Alireza Pourreza
Sure, you mentioned that we can monitor at the tissue level or at the whole vine level and that's the primary classification of the research that we are doing. So, we conducted research first at the leaf level with proximity of spectral sensors and we did that because when we use proximity sensors, we don't have to deal with a lot of errors that measurement can contain. So, we know that the leaf can absorb light at different wavelength depending on its biochemical and biophysical traits. Of course, at the leaf level we can measure the most accurate characteristic of leaf and correlate that to plant nitrogen. So that's where we started: at the leaf level. We had some interesting results. At the next level we tried to apply whatever we learned from the leaf level analysis and apply that on a canopy level model. And as I mentioned, when we measure a spectral characteristic remotely using a drone or using satellite, there are several sources of errors that can manipulate deliberately sensed data (spectral data) and eventually make them unreliable for analytics, or any analytics based on those, would be inconclusive. So, first we need to conduct a canopy level radiative transfer modeling, and then we can retrieve plant traits with more certainty that the model that we developed would eventually translate to vine nitrogen level and it can be, hopefully, applied to different varieties, different system, structure of plant and also different phenology, and different geographic location. So, it would be a robust and consistent method.
07:47 Patty Skinkis
And so, when you're talking about what you measured, the individual leaves and then taking it to the whole canopy, can you describe what you are measuring those individual leaves with and how you were doing it and then how that was extrapolated to the whole canopy?
08:02 Alireza Pourreza
Yeah, so when we measure spectral data from a leaf sample, we have a lot more options for our measurement and to make sure that our measurement is accurate. First of all, the sensor and the light source are fully in our control [in a lab], the angle of incident light and the angle of measurement is in a controlled environment, and for all samples it's similar. So, any analysis based on those results would have a higher level of confidence. Also, we can measure transmittance when we do it at the leaf level. We cannot measure transmittance at the canopy level [outdoors, in a field]. And that would open a lot more unknowns about the leaf spectral characteristics to us. So that’s why leaf level analysis is important to develop a baseline for the canopy level analysis. What we did at the leaf level--we compared the 5 or I can say 2 main categories of a spectral analysis. The first category is data-driven and mostly empirical approaches that tries to correlate the spectral data to get plant traits, that was measured by plant physiologist. When we are trying to make that link, we don't pay much attention to the interaction of light with plant tissues or canopy, and we just try to find the best descriptive wavelength and improve the accuracy. The problem with this kind of modeling is that since we are not taking into account the mechanism of interaction of light with the plant, the model will be highly biased to the specific dataset that we use to calibrate this model. And when we try to use this model in another time or another space, geographical location, it basically would not work because we only measured 1 or 2 spots of that specific vineyard for creating this training dataset. And we did not consider all other specific conditions that the vineyard contributes to the spectral characteristic that we measure. So, this is the problem with data delivery. Alternatively, we can use a mechanistic approach or physically based approach, also known as radiative transfer modeling. I call this approach like a measurement because it's more based on how much light is absorbed at different wavelengths, and we know which component absorbs light in which wavelength, so we can do direct measurement based on reflectance at different wavelengths. Because we are doing it mechanically, it will focus on a specific wavelength for each trait and then it won't be impacted, or I can say less impacted by, the specific characteristic of the vineyard. So, we compared the different data delivered approach with an RTM model called Prospect Pro, and we also tried to combine the Prospect with some data delivered approach to see if we can leverage the capability of both the mechanistic approach and the data delivered approach. What we learned is that a hybrid approach actually gives us the best result and offers the most acceptable and retrieval accuracy. We also realized that protein is the best predictor of leaf nitrogen, highly and consistently correlated to leaf nitrogen, regardless of leaf age and phenology and variety. So that’s another big output--that many people think chlorophyll or that we use chlorophyll as the means of nitrogen measurement. But we realized that the relationship between nitrogen and chlorophyll is not consistent. We realized that leaf age affects the accuracy of nitrogen trial by vegetation indexes like NDVI and NDRE which is mostly sensitive to chlorophyll and the light absorbing component of the leaf. Protein is not invisible at near-infrared light; protein actually is in short wave infrared, and with radiative transfer modeling, it was measured at wavelength between 2100 -2200 nanometers which is not available in most multispectral sensors on the market. We also learned that when we calibrate nitrogen by math compared to calibration of nitrogen by area, it can better retrieve remote sensing and RTM models. So, these are the main highlights of what we learned from the leaf level. As I mentioned, we tried to apply that to a canopy level. We did some comparison of physically based approach and data-driven approach and learned that the physically-based or mechanistic approach has the potential for the most consistent vine nitrogen at the canopy level. Also, we realize that the best nitrogen prediction performance within visible and with near infrared region, which is depending on chlorophyll, and without access to protein would happen at bloom. In other words, bloom time is the best time for nitrogen monitoring in a vineyard when we don't have short wave infrared. At the pre-bloom, fruit set and veraison [stages], the accuracy was not as good as bloom, but this is some preliminary data. This year (2023) we are planning to do more temporal data collection to realize the dynamic of nitrogen variation within the canopy, and how it can be retrieved with remote sensing--limited remote sensing.
14:40 Patty Skinkis
So, I think that brings up some really interesting components that I want to come back to. So in the leaf level you found, that it is not the chlorophyll. But for so long we've all been focusing on chlorophyll. The NDVIs are really simple or more simplistic ways of looking at the vines, and so I think that's part of that revolutionary aspect of what we hope to get at, at least the viticulturists on the team. We don't necessarily think NDVI is the way to map nitrogen, but we kind of have gone down this path of looking at other things, so we know chlorophyll is a very small percentage of the total nitrogen integration. The protein is much better, that makes a lot more sense. I mean, I grew up in a different area of agriculture and everybody knew if you wanted high protein, you knew when to harvest your forages for dairy cattle, for example, and so protein and other crops are oftentimes looking at that. However, that still is not , to my knowledge, done through precision agriculture. But I think that makes sense. That's that “aha moment” that we should be looking at with proteins. But as you stated, that takes a different kind of sensor than the team is currently working with. So, have you done those short-wave infrared analyses at the canopy level yet? Or are those things you are planning to do in the future?
16:04 Alireza Pourreza
So, that’s a good question. First of all, exactly yes, protein is the best predictor, but I did not mean to disqualify chlorophyll entirely because that's what we have with the multispectral sensor. To answer your question--no, we don't have accessible technology for remote sensing in short wave infrared and at the drone level. We have some capability at the satellite level, but we know also that in vineyards we need high resolution imagery if we want to do good monitoring. So, to get back to your question--yes, protein is the best. We don't have that capability to monitor protein at shortwave infrared remotely. Chlorophyll still has a correlation with nitrogen if we look at one phenology stage at a time. But if we compare veraison to bloom, we can see at both phenological stage that there is correlation between chlorophyll and nitrogen, but that's not the same correlation. In other words, at each individual stage there is a pattern, but that pattern doesn't translate to another phenology stage. So that's due to the inconsistent relationship of chlorophyll and nitrogen.
17:37 Patty Skinkis
That’s interesting, and I see now why the complication from going from leaf level to canopy is that we've got leaves of different ages. We've got lots of lateral development which now have younger leaves, lateral shoot development on the main shoot, lots of leaves that are different ages, and so that's a lot of complication that comes into play at the canopy level.
17:58 Alireza Pourreza
Exactly. Remote sensing is a complicated problem. It's called the impost problem which may have multiple answers for the same data. So, that's another complexity that we need to figure out, but you mentioned about the leaf age and leaf angle. As I mentioned at the proximity level, we are working in a controlled environment so we can control the incident light and the measurement angles. At the canopy level we have zero control. We have leaves in all kind of angles, depending on what time of the day we've measured the data, or what angle we are looking at the canopy. We may have different measurements, so that's the complexity and that’s what we are trying to solve in the next step. We use the canopy level RTM, but 1 dimension which doesn't take into account all of these details when we are dealing with canopy. So one dimension RTM is the best model for crop like wheat or corn, row crops, but for a specialty crop we need 3D, three-dimensional radiative transfer modeling. In those models, we generate a digital twin of each vine. We introduce the spectral characteristics of the soil, the trunk, the wood, the leaf, the trellis, everything that is in the scene. And we try to generate exactly the same scene that we can observe from the sky, and this is a contribution to a synthetic training dataset that we are planning to combine with some real data and eventually use AI for nitrogen. So, the combination of mechanistic approach and explainable AI so that we know what's going on and how the links between data and output are made and so we have some control over it. We will also assess some other nutrients other than nitrogen. I know nitrogen is the most important but not the only important nutrient, and depending on different location there are other like next or second level important nutrients, and we’ll try to monitor those using a similar methodology.
20:26 Patty Skinkis
So, I think this is kind of interesting for me being a horticulturist, a viticulturist to hear about. You know we're so used to always working with the real thing, the plant--going and measuring--and we spend lots of hours working with data like that. So. I'm just going to walk through this, and you can tell me if I'm not understanding this because I think this is interesting and I hope the listeners do as well. So, the RTM models are only one dimensional, they're used for other crops, probably a bit easier for those annual crops to quantify nutrient levels. So, with the perennial crops we have to have a 3D model, in which case you create a digital image of the plant that then you create a synthetic training data set to inform the artificial intelligence. Is that correct?
21:13 Alireza Pourreza
Exactly. Yes, the image that we are creating is not two-dimensional, it's a 3D image or 3D model--actual size--and as much as possible close to reality. So, we can simulate a data collection session. We know the sun angle based on the time; we know the camera angle, and based on that we can see if the plant was under nutrition stress. How would it look like in the image that we are able to collect? Then we can compare. We can generate the lookup table of different conditions, of course, there are millions and millions of different combinations of conditions. Hopefully we can train an AI model so that when unknown real data comes in, we can do comparison and see what would be the traits for that plant.
22:10 Patty Skinkis
Okay, so this is this is great. So, I'm going to ask you this question. I'm going to bring this question up because I'm sure if a grower was here they'd say “Well why don't you just come measure my orchard or my vineyard because I know where you can do this.” My understanding would be because we only have one shot to get that scenario, versus with this digital 3D image and the different scenarios you create in a short period of time, you can create a whole bunch of scenarios to inform the model. Is that right?
22:42 Alireza Pourreza
Exactly, yes, and so it's an ongoing data set. So, the more we collect data and the more we see other vineyards and see the different structure, we can add to the dataset and it can improve itself, as it moves forward.
23:02 Patty Skinkis
Very cool, very cool. I'm slowly getting to understand how this all works. So, this is interesting. I know you're working with many different crops and generating some of that data to kind of ground truth. So, how does how does that work? How do you ground truth and how do you know? Do you measure trees, or do you get that information from collaborators? Can you tell us a little bit about that?
23:26 Alireza Pourreza
Yeah, so in any project I work with the plant scientist, or plant physiologist, or plant pathologist, depending on the nature of the project. We try to listen to them, see how other people try to monitor the same stress or the same trait with visual or some other subjective method that they use, and we try to use those information as prior knowledge in addition to spectral data that we collect. So, basically my methodology is to get information from any source that I think would be relevant to the target trait that I'm looking for and assimilate all of these data with remotely sensed data, and using this method I think we can get the best possible measurement accuracy and we know no measurement is 100% accurate, even the lab measurement won't be 100% accurate, so we tried to make it as accurate as possible.
24:33 Patty Skinkis
I think that that comment about accuracy is also helpful here because a lot of times as researchers we want to be really specific, and this goes back to a comment that you made about the different types of modeling. The data driven versus the mechanistic modeling. And so often as researchers we want to have everything ground truthed, we have all the data that we wanted, and you're saying that doesn't necessarily always help it. It makes for a small data set that does not always relate. It's not translatable, and I think that's really kind of a good thing to think about. That we don't necessarily always have to be so detailed, but we can use it to inform the models. And I say that because there's a lot of researchers out there that will be like “well a model is only going to tell us a generality.” But then, there's growers who would say “I don't need perfection, I don't need exact, I need guidance,” and having some guidance is better than none. I think that's the cool thing about this project is we're trying to each put aside our areas of research that we kind of get so used to--we get into our vacuum--and we need to kind of come to the table and recognize that you know what is it that we're trying to do and how precise or accurate do we need to be.
25:50 Alireza Pourreza
Exactly, you mentioned something very cool that all models are just trying to simulate and sometimes they cannot realistically simulate. The reason that people have these kinds of feelings about models like crop models or remote sensing models is because we don't have a feedback loop. If we have a feedback loop, then we can realign the model to make it more accurate and the reason that I'm trying to use data assimilation, is because I consider remotely sensed data as one source of data. There is crop variety or crop cultivar specific information, soil information, climate information, management information, and some other not remote sensing modeling if available, if we can use crop growth model, and then we use all of these as output and feedback for each other to help these different individual models improve themselves and then assimilation of all these data would give us the most consistent result. That's my basic theory of using remote sensing and combining data with data sources.
27:08 Patty Skinkis
Yeah, so that feedback loop, that is a critical thing and it's got me thinking about how often, when we do research, we'd get through it, we say “okay, we're done, we have our paper published, let's move on.” And really, I think that's the downfall is we don't just keep going and, just recently I learned about Crop Manage. Crop Manage, as you're probably aware of, is created through the UC system, and I think that is a potential way for us to just funnel some of this information in. I can't promise that, I just learned about it yesterday, but it's a way that perhaps we can take all of those platforms and create a user interface that growers are using and we have a feedback loop. And it's an effort that's in place and we're not starting from scratch every time we start a new grant-funded project. So, I think that's something to think about for myself and the research team and others, that if you use one of these sorts of decision support tools—that has models, many models in them--we need to be providing that feedback loop.
28:24 Alireza Pourreza
Yeah, exactly, each of these different models, they are just pieces of puzzles then when they come together, we can see the full picture.
28:30 Patty Skinkis
Well this is great. I think the next thing I want to ask is, do you have any major plans this next growing season? What is the biggest thing that you hope to accomplish regarding this specific project?
28:45 Alireza Pourreza
So, as I mentioned this year we will focus mostly on this digital twin, and generating the synthetic data set. We will start working a little bit on magnesium. Nitrogen is only one parameter that can be monitored. I think yield forecasting is another great opportunity that can be provided by remote sensing and data assimilation using climate data, soil data, management data as I mentioned, and it provides very valuable information that growers can use to zone their vineyard into several management zones and manage each zone differently based on the plants’ needs. That would improve crop management and definitely reduce waste, and hopefully help us to better maintain the quality of our environment. Yeah, we can use our remote sensing with this methodology for other stresses, other pests, disease monitoring. This all using the same data so we can do one flight, do nitrogen, and do all these other inside maps besides nitrogen with the same flight. So, this is an opportunity that we shouldn't miss because it's not all about nitrogen. It's a combination of different criteria that would help us to make the best decision.
30:19 Patty Skinkis
Yeah, absolutely. So, I want to wrap up with a fun question. What is the most interesting technology you have worked with and why?
30:27 Alireza Pourreza
So that's a good question, most of the technology that I worked with are pretty amazing. The 3D modeling, the LIDAR data collection, and hyper spectral. What I found very interesting is cloud computing and real-time AI which I found very interesting. I believe these two technologies when combined with 5G connectivity, it can do another revolution in agriculture. And not only agriculture, potentially whole crop and food production as well. Hopefully that can help us to come up with a solution with the more food that we need to create and produce for a growing population. So yeah, I'm really hopeful about these two technologies.
31:32 Patty Skinkis
Are they currently being used in agriculture or is it too new?
31:24 Alireza Pourreza
Well, AI has more or less been used, but AI has been revolutionized also. We are using a new algorithm that can evaluate a lot of information in a short time and make some interpretations and generate some results or output. We know all about the ChatGPT and how everyone is excited about that. So, that's a great example that can be applied as a kind of ChatGPT for agriculture. That can help many growers to make better decisions, make informed decisions, rather than just based on experience, or history, or gut feeling. I think that would be one important factor in optimizing health management.
32:15 Patty Skinkis
All right, well, thank you so much for joining us today and sharing some of your research. I look forward to hearing more about the outcomes in the future and if you are interested in learning more about this research, check out the High-Res Vineyard Nutrition Project website at https://highresvineyardnutrition.com/ and you can also find us on social media as well as the DigitalAg Lab (https://digitalag.ucdavis.edu/). You can follow what Ali and his research team is up to by joining them on Twitter (now X), Instagram, and wherever else they are located so you can find out some of the neat things that they are doing. Thank you.
32:50 Alireza Pourreza
Of course, thank you for having me.
How far have we come in developing sensors for monitoring vineyard nutrition? In this episode, Dr. Alireza Pourreza, Associate Professor of UC Cooperative Extension, talks about his lab’s research into nitrogen sensor development and the robust models they feed into that will be useful for farm decision-making.
