Growing Farms Online Course: Learn how to start a successful sustainable small farm.
Developed by OSU Small Farms Program faculty and other farm management experts, you will learn the essentials of designing and growing your own thriving farm business. And the entire program is available online, so you can complete it on your time, around your schedule. Turn your dream of owning and operating a small farm or ranch into a successful reality with this popular program!
Farm profitability, an issue for all farmers, can be a particular challenge for small-scale, diversified farms selling primarily into local-direct and specialty-wholesale markets. These farmers can benefit from practical tools to gather the financial data they need to make informed decisions about their farm businesses. To explore the value of this approach, we used an established market-assessment tool—the Market Channel Assessment Tool (MCAT), developed by colleagues at Cornell Cooperative Extension in New York—with six Oregon farms in the summer of 2014. We learned that while the MCAT is useful for market channel comparison, it is more useful as a tool to prompt exploration of opportunities to improve the performance of specific channels. Based on this experience, we are now working with farmers to develop an easy-to-use cost-tracking system to enhance small farm profitability.
Getting a handle on costs
Rising consumer demand for local, sustainably produced food has created market opportunities for small farms, many of which sell through multiple market channels and manage all or most of these supply chains from field to consumer. But national and Oregon-specific research indicates that many small farms struggle to become profitable. The diversified mix of crops these farms produce, coupled with their smaller scale, means that these farms don’t benefit from the economies of scale that larger, less-diversified farms achieve. What’s more, market prices are typically set or strongly influenced by these larger farms. This makes it crucial for small-scale farms to have a good handle on their production and marketing costs so that they can evaluate which crops and market channels can be profitable. It’s not enough to be highly skilled at growing and selling food; farmers need to know how to gauge production costs for specific crops and assess the profitability of specific market channels and their overall marketing approach.
A recent, multi-year assessment of research, education, and policy needs of Oregon’s organic farmers indicated a need for business, financial, and resource-allocation skills, plus assistance with farm economic analysis. A 2013 survey of 50 Oregon farmers engaged in farm-direct marketing revealed that 84 percent wished to learn more business-development skills; farmers with 9 or fewer years of experience indicated the highest level of interest. This training is increasingly important as the local food marketplace evolves and matures. For example, Oregon farmers report saturation in some traditional direct markets such as farmers markets and Community Supported Agriculture (CSA). In response, some farmers plan to scale up production to go beyond direct markets and sell to retailers, food service companies, distributors, and other wholesale markets. This requires that they have a solid understanding of the crop mix, market channel mix, and pricing that will allow their businesses to succeed financially.
How to assess and compare market channels
How a farm markets its crops affects overall profitability and long-term viability. A combination of several factors—including the economic costs and benefits associated with a given market channel, the degree to which participation in a given market channel exposes a farm to risk, and the extent to which selling through that channel is aligned with a farmer’s personality and values—influence how a market channel affects profitability and long-term viability.
For example, farms may focus on direct markets to capture more of the final sale price. In these markets, farmers keep more of the consumer’s dollar because they take on more of the downstream marketing activities themselves. In contrast, wholesale channels that involve selling through an intermediary to the final consumer often pay lower unit prices to farmers. The trade-off for the lower price is that the farmer is effectively paying someone else to do much of the downstream marketing.
Trade-offs also exist among the different direct market options. A busy day at the farmers market might generate higher sales than a farm stand, but the farmers market might also require more labor for travel, staffing, set-up, and clean-up.
Risk also influences how a market channel affects profitability and long-term viability. Market channels with less dependable sales are more risky for farmers. If sales fall through—for example, due to a bad weather day at the farmers market or a high-volume buyer backing out on a sale at the last minute—farmers are left with perishable inventory that has already had a significant investment of time and money put into it but may go unsold.
As the Cornell University team that developed the MCAT observed, and farmers have experienced, risk and volume can be closely tied together. Dedicating a high volume of product to a market channel that could fall through conjures up the old adage of “putting all your eggs in one basket.” On the other hand, having the option to sell crops through a channel that can absorb a high volume of product can help mitigate the risk of other, less-dependable market channels. Risk can directly affect profitability, and too much risk can contribute to stress and hinder a farm’s long-term viability.
Finally, farmers may have personal preferences for one channel over another. Some farmers thrive on interactions with customers at a farmers market while others prefer to sell through wholesale channels such as retail stores and restaurants. Some farmers prefer selling through a CSA and at farmers markets because of their community-building aspects. Others avoid selling at farmers markets because they want to save weekend mornings for family, not work. Personal preferences may or may not align with actual riskiness or profitability, but are still important to consider in relation to long-term farm viability.
Farms need to account for all of these factors when evaluating different market channels for profitability and viability.
The Market Channel Assessment Tool (MCAT) was developed by Cornell Cooperative Extension as a way to evaluate and compare the different ways small-scale farms sell their crops. The MCAT analysis is based on five factors: a “profit” calculation, sales volume, labor hours, and two farmer-assigned weighting factors for financial risk and lifestyle fit. Values for these five factors are generated from data collected by farmers during a one-week period, plus interviews with farmers. Each farmer determines the relative weight of each factor. The combination of weighted values creates a comparison of channel performance. Farms can use this information to optimize the mix of market channels they use and—ultimately—improve their overall profitability.
We evaluated the MCAT with six Oregon farms in the summer of 2014.
Tracking marketing labor to gauge cost
The main approach of the MCAT is that farms track the time spent on four categories of marketing activities for a one-week period during the peak marketing season. The four categories of activities they track are:
- harvest
- post-harvest (wash, sort, pack)
- sales and bookkeeping
- travel and deliveries
Farms record time spent on each of these activities for each different market channel. For example, if a farmer spends 8 hours selling at the farmers market, this time is recorded as 8 hours of selling activity for the farmers market channel.
Everyone who works on the farm that week—including the farmer(s), all farm employees, family members, and volunteers—records time spent on all of these marketing activities for all market channels for the whole week. Individual hourly wage rates (provided by the farmer) are multiplied by hours per person to determine total marketing labor costs per channel.
Farms have other marketing costs, of course, such as packaging, CSA software, farmers market booth fees, and so on. However, labor is the main focus of the MCAT approach because labor tends to be the primary expense on most small farms. The only nonlabor costs included are the cost of traveling to markets and delivering product. If labor or mileage costs are shared across channels (e.g., delivering CSA boxes and restaurant orders on one trip), they are allocated to those channels based on a percentage of sales.
Farms also record gross sales per marketing channel for the week. For farms that sell product through a CSA, the value of the shares for the week is determined by the farmer, either by estimating the value of the product in the share or by dividing the total share cost by the number of weeks in the season.
We took the data collected by the farms and entered it into Excel-based MCAT worksheets. These worksheets calculate channel-specific values for the sales volume, labor hours, and “marketing profit” factors used in the final channel rankings. For the MCAT, “marketing profit” is calculated as a percentage of gross sales as follows:
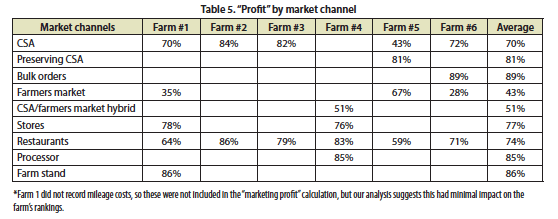
Marketing profit = [gross sales – (labor cost + mileage cost)]/gross sales
The MCAT also recognizes that farmers vary in how they perceive financial risk and “lifestyle fit” for different market channels. To adjust for this, farmers are asked to evaluate both of these factors for each market channel, assigning values that can then be incorporated into channel-ranking calculations.
Market channel rankings are calculated both with each factor weighted equally and with each factor weighted based on its importance to that farmer. Each farm receives a final report with both sets of channel rankings along with calculations for per-channel sales volume, labor hours, and marketing-cost-to-sales-ratio factors. The reports also include practical recommendations based on the assessments.
Oregon’s MCAT experience—the farms
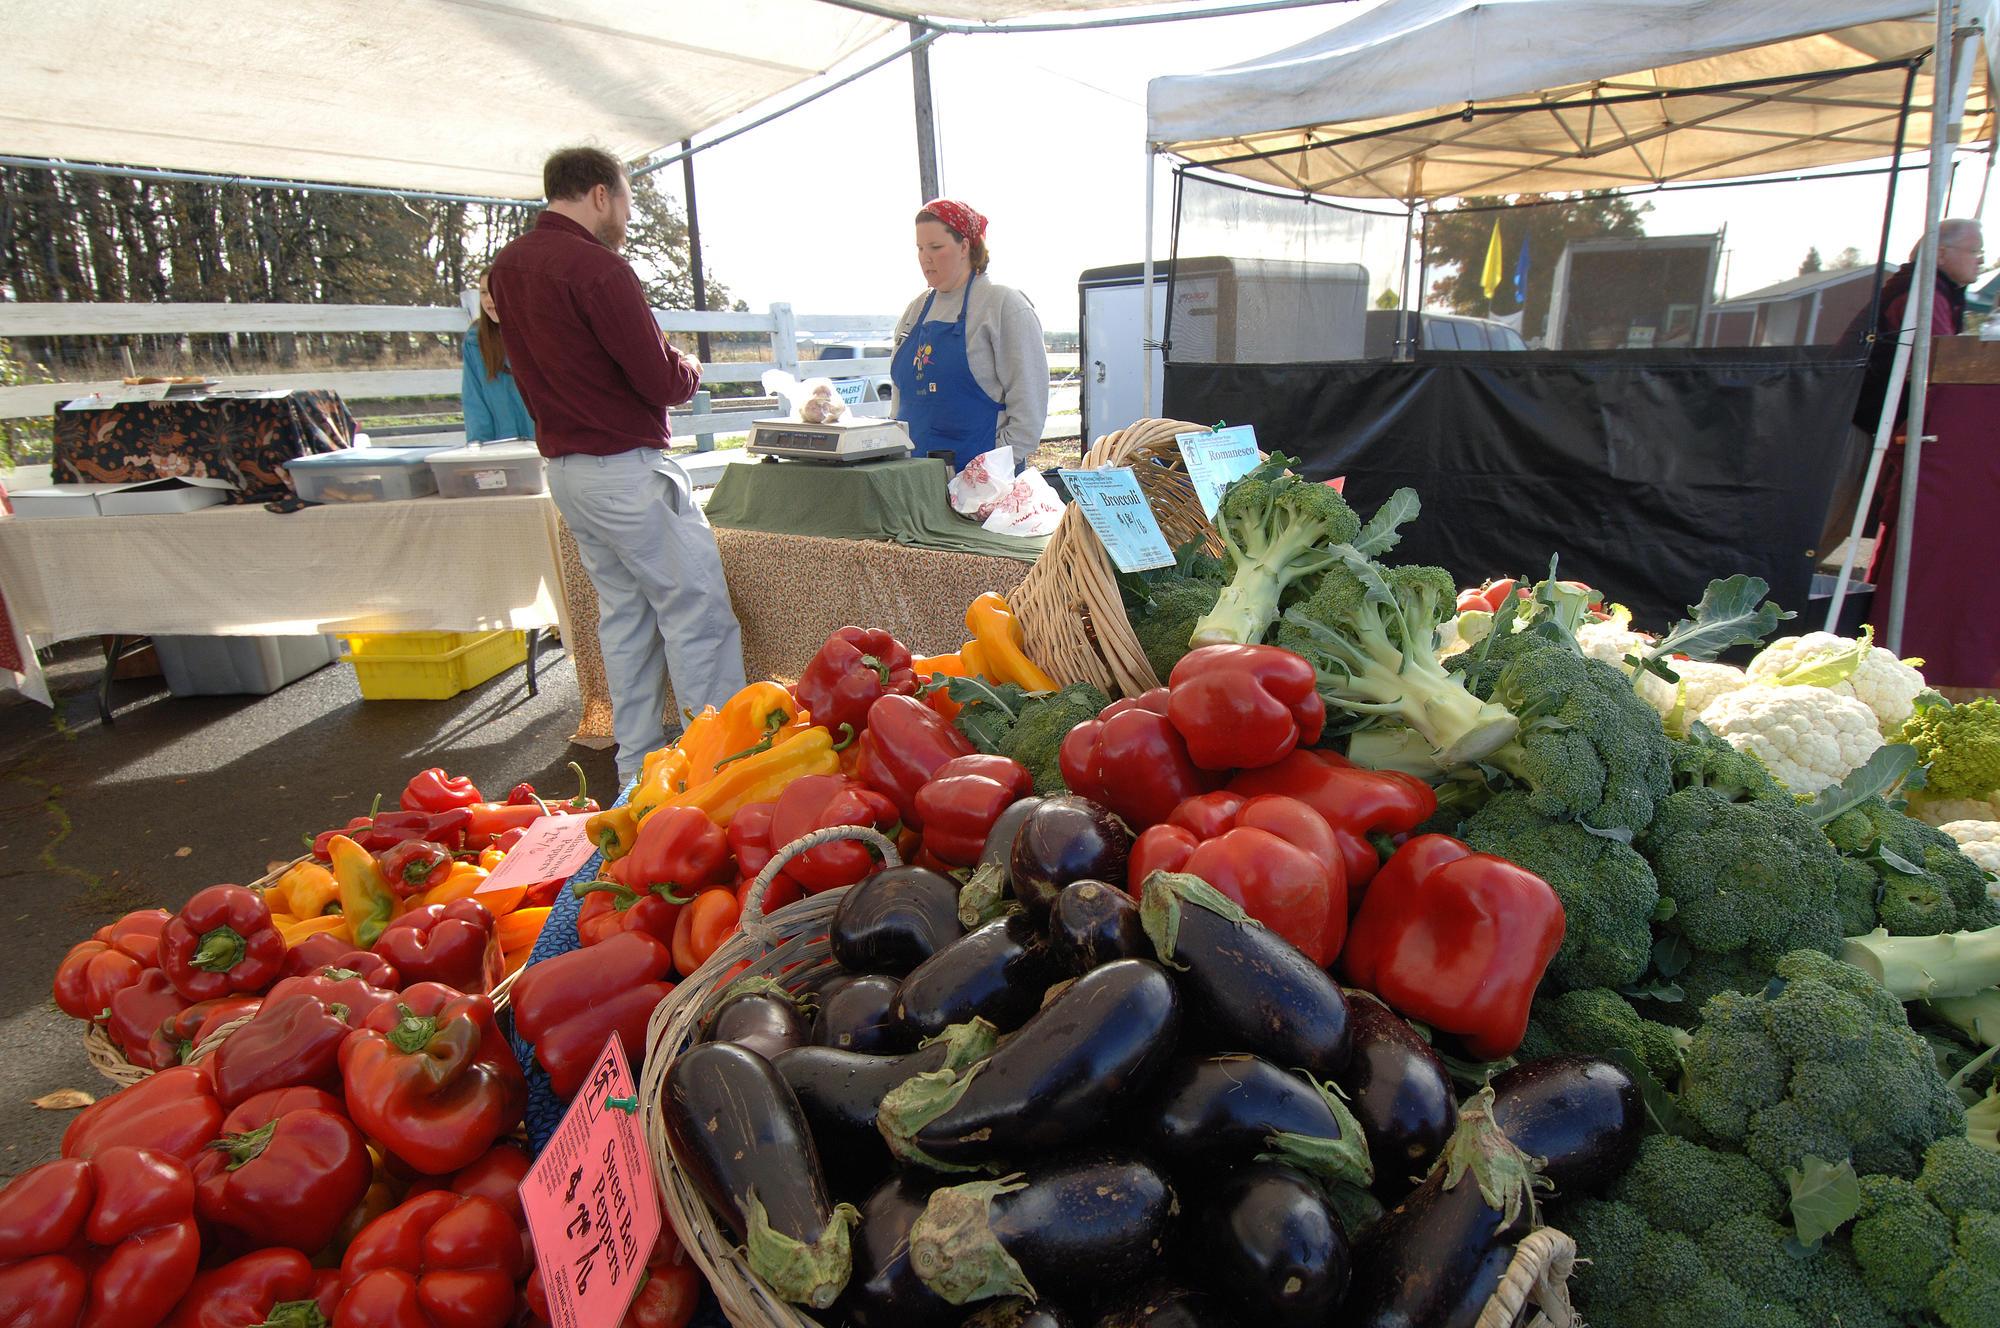
The six farms that participated in our project were selected based on their interest in assessing market channel performance.
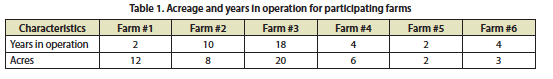
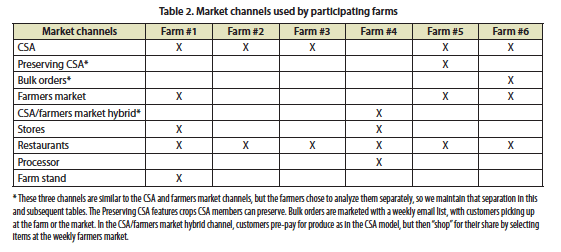
All six grow a wide variety of vegetable crops. Farms vary in size from 2 to 20 acres. Table 1 shows the acreage and years in operation for each farm. Table 2 shows which market channels each farm uses.
For these farms, the most common market channel is restaurants, followed by CSA and farmers markets.
Farm-level data that go into the market channel rankings
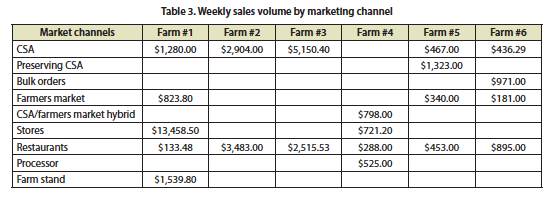
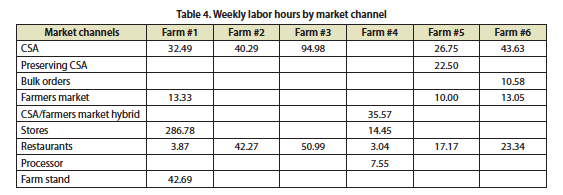
Table 3 and Table 4 (page 6) give the measurements and ratings for each of the five factors that go into calculating the channel rankings: sales volume, labor hours, profit by market channel, financial risk, and lifestyle ranking. We provide all of this detail here so that readers can see how the rankings—shown later—are developed.
Table 5 (page 6) shows the farms’ “profit” results for each market channel. Again, “profit” is calculated as [gross sales – (labor cost + mileage cost)]/gross sales.
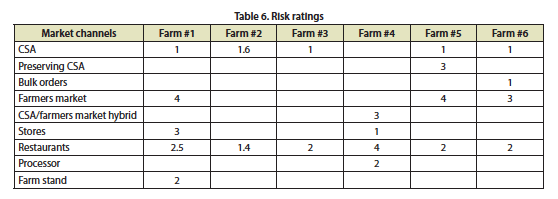
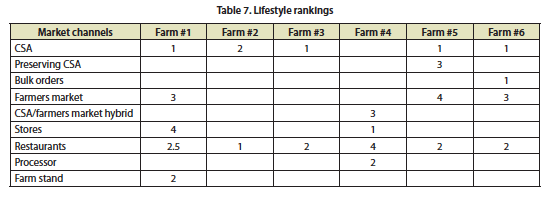
Financial risk and lifestyle ranking calculations for the farms are shown in tables 6 and 7. Farmers rated the financial risk of each of their market channels from 1 (least risky) for their total number of channels (Table 3, page 5). They did the same for lifestyle fit, with 1 meaning most consistent with their lifestyle (Table 4, page 6). Values were not required to be whole numbers and could be equal for multiple channels.
Market channel rankings
The final market channel rankings incorporate all five factors listed above, plus one more set of weights assigned by the farmers for each factor, based on its relative importance to them.
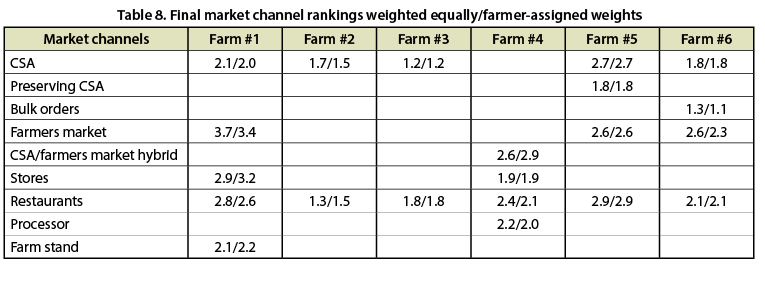
Table 8 shows both versions of the final rankings: (1) with each of the five factors weighted equally and (2) with each factor weighted based on its importance to each farmer. In our study, as the table shows, adding the farmer weights did not change the overall order of the rankings except in one case: for Farm #1, the CSA and farm stand channels go from being equally ranked to CSA ranking slightly higher.
Farmers can use the rankings to compare channel performance and select an optimal mix for their farm businesses. The lower the number, the better the channel. For example, for Farm #5, the preserving CSA is the highest performing channel, and restaurants the lowest. In contrast, restaurants are the best channel for Farm #2. The best channel for Farm #1 is its CSA, closely followed by the farm stand. Bulk orders are the top performer for Farm #6.
Responding to the rankings
All of this information about channel rankings is useful for farms that are interested in scaling back some of their market channels—or potentially dropping some channels entirely—but weren’t sure which to reduce or drop. Yet before a farm chooses to make such a change, it is valuable to explore whether there might be opportunities to improve the performance of a low-ranked channel and thereby enhance overall farm profitability.
That is, the greatest opportunity to enhance overall farm profitability based on MCAT results comes not from comparing channels to each other but from digging into the performance of individual channels, especially poor performers. By examining what drives a specific channel’s marketing costs, farmers can find ways to improve that channel’s performance. This primarily involves looking at which activities have the highest labor requirements, then focusing on opportunities to reduce labor for those activities.
We did this with participating farms, identifying specific changes they could make based on their specific results, and provide examples below.
The starting point for evaluating labor costs is to compare marketing labor costs to gross sales for a specific channel. If marketing labor costs are high relative to gross sales, then there will be fewer dollars left to cover production and overhead costs and deliver profits.
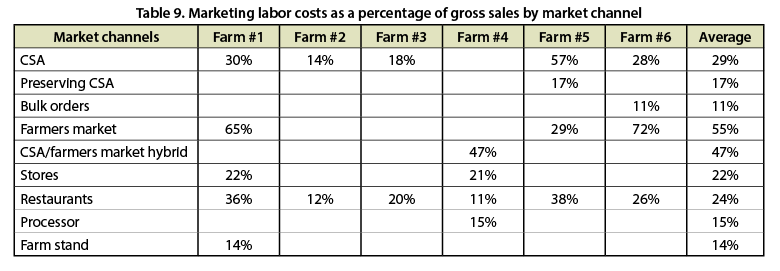
MCAT reports to farmers include a comparison of “Gross Sales to Labor Costs” by channel. Showing marketing labor costs as a percentage of sales facilitates easier comparison between channels, allowing farmers to identify the channels with the highest labor costs and then begin to probe for ways to reduce those, thereby improving channel performance.
For example, Table 9 (page 8) shows the marketing labor costs as a percentage of sales per farm and per channel. Across all farms and channels, the farmers market has the two highest ratios (65 percent and 72 percent). This indicates that for these two farms, #1 and #6, digging deeper into the labor activities for the farmers market channel is warranted.
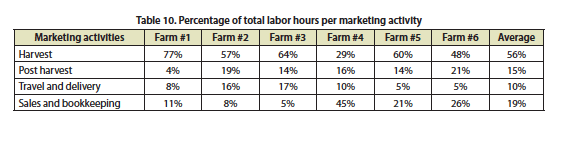
The MCAT also calculates the percentage of total marketing labor spent on each marketing activity. This ratio begins to give farms an idea of which marketing activity is taking up most of their time. For our six farms, harvest is the most time consuming, taking an average 56 percent of total marketing labor hours (Table 10).
This suggests that improvements in harvest efficiency might improve the performance of all market channels and therefore overall farm profitability. In discussions with participating farmers, we identified operational changes generally relevant to all market channels to minimize harvest labor. For example:
- Small-scale, fresh-market vegetable farmers can explore options for mechanizing harvest, such as tractor-pulled potato harvesters and under-cutter bars to expedite root harvest. This may require an upfront capital investment, but these tools will likely pay for themselves in the long run. Tools or equipment for moving harvested crops from the bed to the field edge and ultimately to the pack house also increase efficiency and reduce labor costs.
- As many crops will still be harvested by hand, effective crew management is key to minimizing harvest labor. For most farms, crew management involves both teaching efficient harvest techniques and maintaining crew morale and motivation to work at a reasonable pace.
- Harvest organization also affects harvest labor. Harvesting a full bed of a crop all at once is generally more efficient than harvesting that same volume over several days because set-up and transition time is minimized. That said, larger harvests require more storage space and bigger crews, adding to the need for capital investment and management skills.
Most importantly, the MCAT also calculates labor hours per marketing activity on a per-channel basis. These data provide an even more in-depth look at what activities drive costs. Of all the information generated by the MCAT, this is the most useful for farmers. Looking at the ratio of marketing labor costs relative to gross sales, then digging deeper into which marketing activities take most of the farm’s marketing labor on a channel-by-channel basis, uncovers opportunities to make operational changes that reduce labor and thereby costs, improving overall profitability.
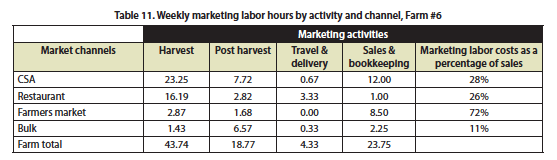
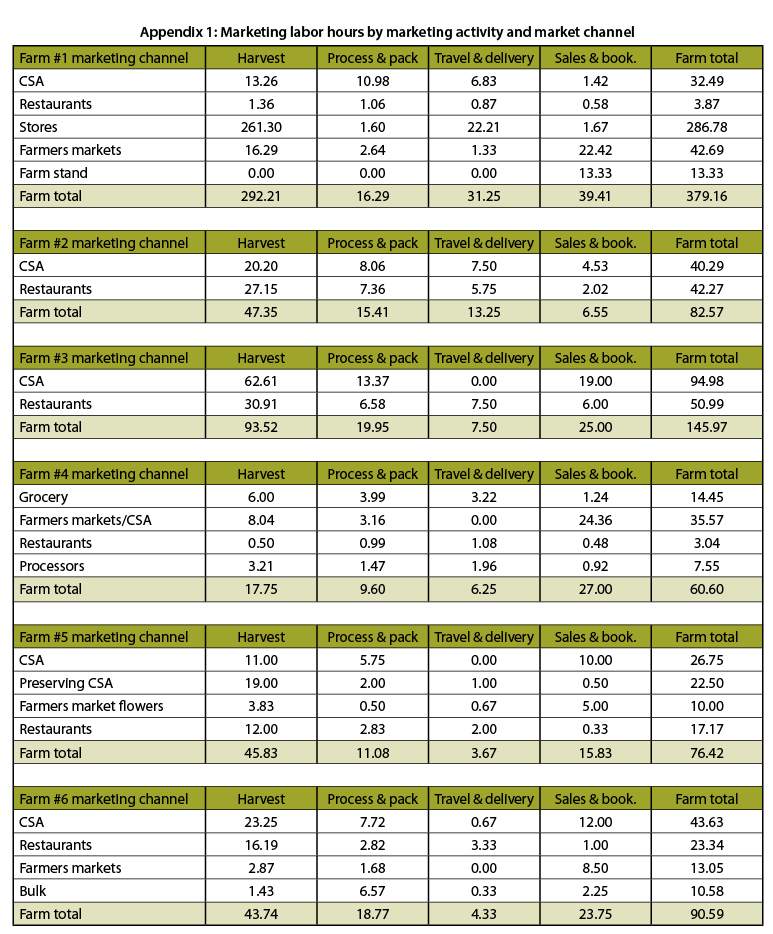
For example, Table 11 shows marketing labor hours per marketing activity and market channel for Farm #6 (see Appendix 1 for this information for all six farms). The ratio of marketing labor costs relative to gross sales is also shown here.
For this farm, the farmers market has the highest marketing labor cost relative to sales. Sales and bookkeeping activity, which in this case is primarily time selling at the market, accounts for most of the marketing labor costs. For the farmers market, sales labor is essentially a fixed cost, because market hours are fixed: whether a farm moves $200 or $2,000 worth of product, at least one person must staff the market booth for the duration of the market. The best opportunity here is to optimize the time spent selling at the market, such as by using the market as a CSA pick-up location. This not only shares the time spent selling at the farmers market with another market channel (CSA), it also encourages CSA members to pick up a few additional items, increasing gross sales.
For Farm #6, the CSA channel has the second highest marketing labor cost relative to sales generated. Harvest is the main activity contributing to marketing labor costs for the CSA channel (assuming that uncounted, off-season marketing labor, discussed earlier, is still less than harvest labor). This farm will want to pay close attention to crops that are included in the CSA share and consider cutting back on crops that are labor intensive to harvest.
Sales and bookkeeping activities also account for a large portion of marketing labor associated with this farm’s CSA. This includes writing the weekly CSA blog, which for many farms involves finding or developing recipes for the crops in the CSA share. In the Portland area, CSA farms can subscribe to a service that provides weekly recipes tailored to that farm’s CSA share. This service has a cost, but it may be less than the labor cost for the farm to handle it internally. Farms can do this cost comparison—do it themselves or farm it out—using their data on labor hours for each activity for a given market channel.
As a final example, the time it takes to staff a CSA pick-up is considered part of CSA “sales.” The alternative to staffing a pick-up is usually pre-packing and delivering CSA shares, which has its own associated costs. It is crucial for a farm to know the minimum number of CSA shares required to make either scenario pencil out. The channel-specific cost data generated by the MCAT can be used as a starting point to evaluate which strategy makes the most economic sense.
Additional considerations, MCAT limitations
Although the MCAT generates a range of useful information, there are two limitations to the standard methodology related to the type and timing of data collection.
Crop mix matters
The MCAT approach accounts for harvest and post-harvest activities as part of marketing labor. Harvest and post-harvest labor hours and therefore cost are largely dictated by crop mix. Because most farms do not sell the exact same crop mix through each marketing channel, the channel comparison is significantly influenced by which crops are sold through each channel. Unless prices increase in direct proportion to the cost of harvest and post-harvest activity, a crop that is more labor intensive to harvest or wash and pack will increase overall marketing labor costs relative to gross sales. In this case, marketing labor costs are higher because of the choice of crop mix rather than the choice of market channel.
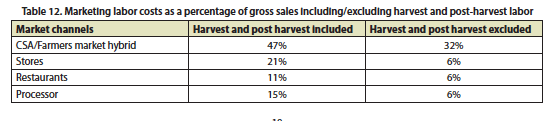
For this reason, it’s useful to look at marketing labor costs with harvest and post-harvest labor both included and excluded. Table 12 (page 10) shows an example using Farm #4 data. When harvest and post-harvest labor costs are included, the marketing labor costs appear to vary among the store, restaurant, and processor channels, with the CSA/farmers market hybrid channel rising to the top.
However, when harvest and post-harvest labor are excluded, we see that the three channels actually have the same costs of sales and distribution. Given this revised picture, Farm #4 might be better off changing its crop mix instead of its market mix.
The timing of CSA marketing labor matters
A small amount of additional data collection may be essential to evaluate the CSA channel fairly. As noted, MCAT is based on the assumption that marketing labor is the most important cost associated with a specific market channel. An important feature of the CSA model is that the work of marketing CSA shares typically happens in the off-season, long before harvest and distribution of shares. For most farms, this means that the one-week marketing labor time study is unlikely to capture the labor (and therefore cost) associated with selling CSA shares. To make a fair comparison between marketing channels, this cost should be counted.
To do this, farms could estimate the number of labor hours they spend selling CSA shares in the off-season. This labor might include designing and distributing CSA brochures, tabling at events, and communication with potential CSA customers. The estimated total hours divided by the number of weeks of the CSA season will equal the number of off-season sales hours per CSA week. Including these hours in the one-week time study of marketing labor would make the market channel comparison more accurate. The MCAT approach gives the CSA channel an unfair edge.
It is also important to reiterate that the MCAT does not track some marketing costs that might affect the relative profitability of market channels, such as packaging materials (e.g., CSA boxes), farmers market fees, and CSA software. Including those would require more data collection but would give a more complete picture.
Despite its limitations, the MCAT is a useful tool for tracking channel-specific marketing costs and evaluating and comparing market-channel performance. The modifications and additional uses for the data that we have suggested will, we hope, improve the value of MCAT to farmers—and Extension educators working with farmers—to enhance farm profitability.
Conclusion
The MCAT is a useful tool to help farms select an optimal mix of market channels. Whether they are trying to manage risk or test the potential of a variety of markets—or both—many new and beginning farmers try to juggle too many marketing channels. This can quickly become overwhelming, especially for farmers with few or no employees. The MCAT uses a combination of quantitative and qualitative factors to help farmers compare how different market channels are performing. This comparison is useful when farms are trying to decide which markets to keep and which to scale back or drop. The Oregon farmers who used the MCAT reported that doing so increased their overall awareness of the complex mix of factors that impact profitability.
Beyond market channel comparisons, however, MCAT may be even more useful to prompt exploration of opportunities to improve the performance of specific channels. Farmers can use information generated through the MCAT not only to prioritize channels but also to improve them.
The marketing costs that the MCAT tracks and analyzes are a critical component of total costs and are sometimes overlooked by farms, especially when farmers discount (or don’t count at all) their own time spent at farmers markets or doing deliveries. Of course, marketing costs are just one component of total farm costs. Ultimately, overall profitability cannot be evaluated without considering production costs and overhead expenses. Enterprise budgets are a standard tool for analyzing this type of data, but small-scale, highly diversified farms—even those with substantial experience and business skills—often find the data collection overwhelming.
Next step: A time-study approach for assessing full-farm costs
To help farms develop a more complete picture of farm profitability, we have developed and are currently testing a highly practical approach based on very short time studies to track all the costs of operating a diversified farm business over a season. In 2015, we ran our first season-long trial with small groups of farmers located in three regions of Oregon, and the second season is now underway.
We have incorporated several valuable aspects of the MCAT into our new approach. Most notable is the very short period for data collection: we observed the success that farmers had with tracking labor for just one week. We also noted the value of tracking a limited set of farm activities at one time. A core component of our cost-study project is that it is integrated into farm activities and minimally burdensome to farmers. It tracks labor for one farm activity at a time, for a limited period of time.
Our experience with MCAT also showed the value of mapping out the specific data to be tracked and providing the farmers with easy-to-use recordkeeping worksheets—critical for farmer follow-through during the peak of the harvest season. Similarly, we have identified the most basic time-study data that farmers need to track to conduct a useful assessment of overall farm profitability. We incorporated a series of webinars and farm visits to communicate the specific data to be tracked for each farm activity. We also developed worksheets for farmers to record this data.
Finally, we heard from farmers that participated in our MCAT project that triggers and prompts would help them remember to start and stop the individual time studies. They also suggested integrating time studies with recordkeeping already occurring. Based on this feedback, we incorporated a discussion on the “nuts and bolts” of the recordkeeping process into our initial orientation for the cost-study project and have continued to revisit this topic as we follow up with farmers throughout the season.
We are conducting our Oregon-based work in consultation with a small group of farmers, consultants, and university researchers across the U.S. focused on practical cost and profitability strategies. We will report on the project in a future OSU Extension publication.
Acknowledgements
The authors wish to thank Matt LeRoux, Cornell Cooperative Extension, for his collaboration. We also thank the two reviewers whose comments significantly strengthened this publication. Financial support for the project was provided by Organically Grown Company and the USDA-NIFA Beginning Farmer and Rancher Development Program.
Additional information
Blanchard, C. 2012. In the Market for Success. Caledonia, IL: Angelic Organics. Online at: http://learngrowconnect.org/sites/default/files/inthemarketforsuccess_0….
Gwin, L. and G. Stephenson. 2013. Research Brief: Research Needs of Oregon’s Organic Farmers. Small Farms Program, Oregon State University.
Hardesty, S. and P. Leff. 2009. Determining Marketing Costs and Returns in Alternative Marketing Channels. Renewable Agriculture and Food Systems: 25(1); 24–34, doi:10.1017/S1742170509990196.
Jablonski, B. and T. M. Schmit. 2015. Differential expenditure patterns of local food system participants. Renewable Agriculture and Food Systems, available on CJO2015. doi:10.1017/S1742170515000083.
LeRoux, M.N., T. M. Schmit, M. Roth, and D. H. Streeter. 2009. Evaluating Marketing Channel Options for Small-Scale Fruit and Vegetable Producers: Case Study Evidence from Central New York. Ithaca, NY: Cornell University.
Murray, T. 2013. Business Development Needs of Oregon’s Farmers. Unpublished report on file with author. School of Business Administration, Portland State University.
National Young Farmers’ Coalition (NYFC). 2011. Building a Future with Farmers: Challenges Faced by Young, American Farmers and a National Strategy to Help Them Succeed. Online. Available at: http://www.youngfarmers.org/reports/Building_A_Future_With_Farmers.pdf.
Pool, K. 2014. Small Farm Business Success: The Farmers’ Perspective. Master’s Thesis, Department of Horticulture, Oregon State University.
Silva, E., F. Dong, P. Mitchell, and J. Hendrickson. 2014. Impact of marketing channels on perceptions of quality of life and profitability for Wisconsin’s organic vegetable farmers. Renewable Agriculture and Food Systems: 30(5); 428–438 doi:10.1017/S1742170514000155.
Stephenson, G., L. Gwin, M. Powell, and A. Garrett. 2012. Enhancing Organic Agriculture in Oregon Research, Education, and Policy (EM 9050). Oregon State University Extension Service in partnership with Oregon Tilth, Inc.
U.S. Census of Agriculture. 2012. U.S. Department of Agriculture. Available at: http://www.agcensus.usda.gov/Accessed: 6/10/2014.
© 2016 Oregon State University
Extension work is a cooperative program of Oregon State University, the U.S. Department of Agriculture, and Oregon counties. Oregon State University Extension Service offers educational programs, activities, and materials without discrimination on the basis of race, color, national origin, religion, sex, gender identity (including gender expression), sexual orientation, disability, age, marital status, familial/parental status, income derived from a public assistance program, political beliefs, genetic information, veteran’s status, reprisal or retaliation for prior civil rights activity. (Not all prohibited bases apply to all programs.) Oregon State University Extension Service is an AA/EOE/Veterans/Disabled.
About the authors