Oregon’s Value of Agricultural Production Increases, Decreases Nationally
- The value of farm production increased 2.5% to $5 billion from 2012 to 2017, while total agricultural production decline -1.6% nationally.
- Oregon farms contributed 1.3% of the total value of US agricultural production in 2017
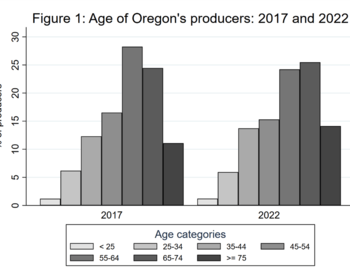
Total Number of Farms Increases in Oregon, Declines Nationally
Oregon’s total number of farm operations increased by 2,177 between the 2012 and 2017 Census of Agriculture (see Figure 1). This represents an increase of 6.1 percent, while nationally the number of farms decreased by 67,083, or 3.2 percent. The number of farm operations has declined in both Oregon (-5.9 percent) and the nation (-7.8 percent) in the past 20 years. Oregon has consistently contained about 1.8 percent of all US farms over this period.
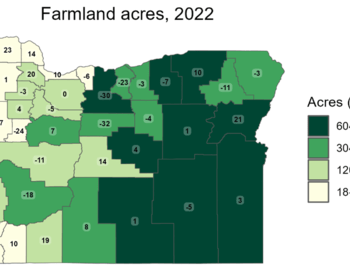
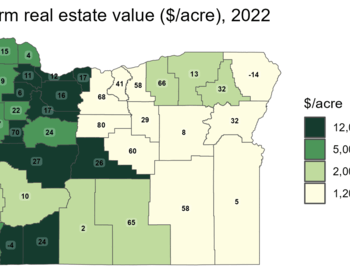
Acres of Land in Farms Declines Faster in Oregon than Nationally
- Total land in farms has been declining since 1997 (US and Oregon)
- In the last 20 years, the amount of acres in Oregon farms has declined 9.6 percent; nationally the number of acres in farms has decreased by 5.7 percent
- Oregon has 339,256 fewer acres in farms than it did 5 years ago (-2.1%); the number of total acres declined by -1.6% in the US (see Table 1)
- This loss of land has occurred while the total value of agricultural production has increased.
Total Production and Total Farms Increase while Land in Farms Decreases from 2012 to 2017
| Year | US | Oregon |
|---|---|---|
| 1997 | 954,752,502 | 17,658,213 |
| 2002 | 938,279,056 | 17,080,422 |
| 2007 | 922,095,840 | 16,399,647 |
| 2012 | 914,527,657 | 16,301,578 |
| 2017 | 900,217,576 | 15,962,322 |
|
Percentage change in last 20 years (1997-2017) |
-5.7 | -9.6 |
| Percentage change in last 10 years (2012-2017) | -2.4 | -2.7 |
| Percentage change in last 5 years (2012-2017) | -1.6 | -2.1 |
| Acres lost in last 5 years (2012-2017) | -14,310,081 | -339,256 |
This analysis focuses on 2017 Census of Agriculture data. Unless labeled, all comparisons of change over time refer to change from 2012 to 2017. See more topics at: Oregon Agriculture by the Numbers - 2017 Census of Agriculture Data
This piece is part of the collection
Oregon Agriculture by the Numbers - 2017 Census of Agriculture Data