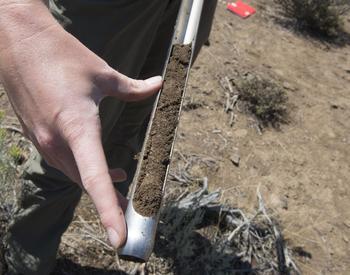
An inventory of all the different kinds of soils in many Oregon counties is available. These inventories were made starting in the 1970’s by soil scientists of the U.S. Department of Agriculture Soil Conservation Service in cooperation with the OSU Agricultural Experiment Station and Dept. of Soil Science. The soil scientists dug hundreds of holes, observed the landscapes and recorded information.
The resulting reports were originally published as books, but are now soil survey interactive maps are available online. There is a wealth of information about the characteristics of the soils in the counties and their suitability for many kinds of agricultural and nonagricultural uses.
What’s in the soil survey?
Soil maps
General and detailed soil maps are available in both the printed and web versions. See the soil survey interactive maps available online. Boundaries between different soils are outlined and soil types are coded. (see Figure 1)
Information about the soils
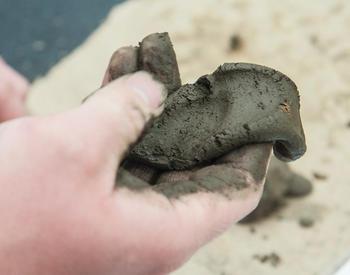
- Soil series descriptions—technical records of the properties of the soils observed. See example below
- Physical and chemical data—results of analytical tests performed in the laboratory
- Soil formation—how the soils developed in relation to the geology, climate and landscapes of the area
- Map unit descriptions—dominant soils, other included soils, landscape positions, erosion potential and appropriate agricultural practices for the soil types actually shown on the maps
Example of a Soil Series Description (excerpt):
Willakenzie Series
The Willakenzie series consists of well-drained soils that are 20-40 inches deep over sedimentary rock. These soils are on low hills and have slopes of 2 to 45 per cent. In areas that are not cultivated, the vegetation is oak, poison-oak, rosebush and widely spaced Douglas-fir. Willakenzie soils are associated with Dupee, Hazelair, Panther, Nekia and Carlton soils. In a representative profile, the surface layer is dark brown silty clay loam about 4” thick. The underlying materials is yellowish-red loam. Willakenzie soils re used mainly for orchards, small grain, hay and pasture. They are also used for timber, wildlife habitat, recreation, homesites, and water supply.
Agricultural interpretations
- Capability—general limitations and risk of damage when soils are used for crops
- Yield potentials—estimated yields of major crops
- Precipitation and growing season data—probabilities of less than or more than average rainfall, dates of latest spring and earliest fall frosts
- Woodland productivity & management—site index data and general susceptibility to erosion, seedling mortality and equipment limitations
- Wildlife habitat potentials—suitabilities for various types of wildlife cover and food sources
Planning interpretations
- Sanitary facilities—soil limitations for septic tank drain- fields, sewage lagoons, landfills
- Building site development—soil limitations for shallow excavations, dwellings, roads and streets
- Construction materials—suitabilities as sources of sand, gravel and topsoil
- Soil and water features—runoff potential, flood hazard, depth to water table, depth to hard or soft bedrock
How to use the printed soil survey report
- Locate your area of interest (AOI) on the General Soil Map
- List all the soil map unit symbols shown on your AOI
- Identify the name of each soil from the symbols by using the Guide to Mapping Units legend
- Read the descriptive information about each soil type in your AOI
- Look up the soil ratings for any specific use or interpretation in the appropriate tables and discussions listed in the front of the book
How can the survey help me?
The survey can provide information useful in buying or selling a parcel of land, leasing land for agricultural or other uses, changing the type of land management (e.g. agriculture to timber), tax assessment, non-agricultural development potential and land use planning, among others.
An introduction to using online soil surveys
Soil survey maps are available online.
On the main welcome page to the NCSS Web Soil Survey, there will be some basic information on how to use the survey on the page. To enter the soil survey information, click on the “Start WSS” button on the left side of the page.
You will arrive at an “Area of Interest Interactive Map” of the continental United States. From here, you need to identify your “Area of Interest” (AOI) before you can get any specific soil information. Your AOI is the parcel of land you wish to examine.
There are several ways to specify your AOI:
- Street Address
- State and County
- Latitude and Longitude
- Township and Range
- 8-digit Hydrologic unit code
You will find these available choices on the right side of the map page. The street address or state & county choices are the AOI methods familiar to most users.
Enter the AOI information in the boxes provided, then click on the “View” button.
Once you click the “View” button, the map on the right-hand side of the page will change to show your AOI. The type of map you see will depend on the AOI you chose. General search areas of interest, such as entire counties, will result in a line map (Fig 2). More specific areas of interest, such as an address, will result in an aerial view map (Fig 3).
To further refine your AOI, use the “Define AOI by rectangle” icon that you will see at the top of your map. In order to view soil information, you must specify a total area that is 10,000 acres or less. Use the rectangle box tool to outline the specific area where you wish to concentrate. If you enclose more than 10,000 acres with the rectangle, you will get an error message and can try again with a smaller rectangle.
Map tools
There are several map tools available to change the views of your AOI map. Tool icons are shown at the top of the map and include zooming in and out, showing earlier views, selecting areas by rectangle or polygon and lists of available data in the current view. Some tools will not work until a small enough AOI has been specified.
Area of Interest (AOI) map
When you use the rectangle or polygon AOI tool, the right-hand map view will change to a close up view of the area you enclosed, overlaid with crosshatching (Fig 4).
Once you have obtained this crosshatched view, the left side of the page will change to show the types of soil information available for your AOI, as well as the size of the parcel you have selected. In addition, the “Soil Map” and “Soil Data Explorer” tabs at the top of the screen will become active. These tabs allow you to explore the details of the soil information for your AOI.
AOI map with soil types overlay
To see a delineation of the soil types for your selected AOI, click on the “Soil Map” tab at the top. The right side of the screen will change to show your AOI with soil types outlined (Fig. 5) and the left side of the screen will show a map legend with information about the soil types.
For a wealth of further information concerning the soils in your chosen AOI, click on the “Soil Data Explorer” tab at the top of the page.
This will return a view with several new tabs including Intro to Soils, Suitabilities and Limitations for Use, Soil Properties and Qualities, Ecological Sites, and Soil Reports. You can view the information under these tabs for all types of soil, or select a subset such as Cropland, Forestland, Urban, Horticulture, etc. by using the drop-down box at the top of the page. Each tab has a large amount of information associated with the general subject, which will appear in an out- line form on the left side of the page. Once you select the information you wish to see and click on the “View Ratings” button, the AOI on the right side of the page will change to show a new map overlay containing your chosen information. Two examples are shown below.
Figure 6 shows the map returned when the options chosen are Soil Properties > Soil Qualities & Features > Drainage Class.
Figure 7 shows the map returned when the options chosen are Forestland > Soil Suitabilities & Limitations for Use > Vegetative Productivity.
Explanatory tables will appear beneath the maps with detailed information.