All authors are a part of the SageSHARE partnership, which created this framework and these resources. To learn more, please visit www.SageSHARE.org.
For definitions of selected terms, refer to the glossary below.
Introduction
Why use a threat-based approach?
Albert Einstein suggested that our perception of space is relative to the speed at which we move through it. Inspired by this principle, we modified it into a new take on land management: Our perception and understanding of the natural world depends on how fast we travel across the landscape. Walking slowly through sagebrush, we can notice an ant trail and the species of forb leaves they carry. We see richness and nuance, complexity and diversity. But when covering hundreds or thousands of acres, we don’t have the luxury of going slow. Management at these scales requires us to move faster, and as we do, the landscape blurs and details grow coarse. We need to find the right ratio of area to detail.
Threat-based land management, the framework presented in this manager’s guide, is a 60-mph approach. Driving at that speed, we see the patterns and problems affecting our rangelands: sagebrush seas and bunchgrass hues, annual grass patches and juniper woodlands. Sagebrush rangeland managers are responsible for vast acres. They cannot slowly observe every detail, especially when the primary threats to the ecosystem — annual grass invasion, conifer encroachment, and wildfire — dwarf finer-scale habitat needs and local management progress.
Threat-based land management was built on the premise that primary ecosystem threats need to be our assessment and management priorities. Consider the changes that large-scale wildfires bring to millions of acres throughout the West year after year. In a matter of days, one wildfire can erase all the gains of small-scale restoration and render any knowledge of habitat composition and conditions obsolete. Effective response to this pace and scale of change requires our management to move faster and focus on primary threats before implementing finer-scale and localized endeavors.
This guide presents an ecosystem framework to prioritize the primary threats to intact upland sagebrush rangelands: annual grass invasion, conifer woodland expansion, and associated wildfire relationships. A single model of nine distinct ecological states (Figure 7) represents a spectrum from intact native plant communities to those converted by primary threats. The associated resource, Threat-Based Land Management in the Northern Great Basin: A Field Guide (PNW 723), was specifically designed to help practitioners map ecological states. In this manager’s guide, graphics (adapted from the field guide) illustrate how to determine ecological state using a color-coded system to represent threats:
- Orange = invasive annual grass threat.
- Teal = juniper expansion threat.
- Purple = the dual threat.
This framework uses vegetation states, ecological threats, and plant community trend to suggest management actions at relevant scales.
We use a six-step process to explain threat-based land management:
- First, this framework uses functional groups to categorize current vegetation and focus managers on the important relationship between perennial bunchgrasses, site availability, and primary threats.
- Second, this guide discusses primary threats, their landscape context, and why simplified state-and-transition models are useful for sorting different vegetation conditions into categories relevant to management.
- As the third and fourth steps, this guide introduces the nine distinct ecological states, teaches practitioners how to use them, and discusses implications at different management scales.
- Fifth, this guide introduces apparent trend, a method to quickly assess whether a site’s trajectory is moving downward to less desirable conditions, remaining stable, or moving upward to favored ecological conditions.
- Finally, the sixth step connects the framework to management decision-making and explores adaptive management, management tools, and sage-grouse habitat requirements. This step is not intended to be prescriptive, but rather to provide an approach for making decisions.
Our framework is not a stand-alone tool. It supports a toolbox of products for assessing biotic and abiotic conditions at multiple scales. Managers are most effective when they can interpret current biotic information with abiotic indicators of site potential and performance. Our framework focuses on efficiently categorizing current biotic conditions, and works in concert with other assessments of abiotic properties, including resistance and resilience.
Few tools address the need for both a broad perspective and local specifics. Tools informing planning and policy issues often deal with regional scales and larger. Tools providing detailed management guidance, such as Ecological Site Descriptions, are typically site-specific. Our framework occupies a middle ground, linking management actions to landscape-level conservation concerns.
Management needs to move fast. Rangeland managers care for large acreages on tight budgets. Conifer encroachment and annual grass invasion affect entire landscapes. The level of detail visible at 60 mph matches the management realities of scarce resources and large-scale threats. It also allows managers to strategize at scales that can be measured in tens or hundreds of thousands of acres. This framework moves at the speed of management, optimizing the science to help rangeland professionals efficiently and effectively categorize, prioritize, and strategize at practical scales.
Who can benefit from this guide?
This manager’s guide is designed for rangeland managers, professionals and stewards. It is an answer to the repeated requests from practitioners and administrators who want to use the threat-based approach but need a detailed resource. Here, we provide the science and rationale behind threat-based land management.
A general audience may need additional background information on key concepts, and we encourage those individuals to consult our additional resources (Appendix A). For specific use in the field, especially classification of ecological states, users should refer to the field guide (PNW 723) and the associated threat-based land management field documentation form (Appendix B).
Which systems work with a threat-based approach?
This framework is designed for upland sagebrush ecosystems in the northern Great Basin, including eastern Oregon, southwest Idaho, and northern Nevada. The general approach we present is relevant to a much broader geography within the sagebrush biome, but specific ecological states, threats, and vegetation dynamics would need to be adapted for different areas.
Similarly, non-sagebrush ecosystem vegetation can be managed with a threat-based approach, but relevant ecology for those systems will be different than what is described here. We designed this framework for the pasture and allotment scale, but it can be, and has been, adapted for larger areas.
Finally, this framework does not exist in a vacuum and is not comprehensive to all scales. To maximize management effectiveness, managers should pair this framework with other resources, including local knowledge and site-specific information such as Ecological Site Descriptions.
Climate and ecological variability across the northern Great Basin
The climate and ecology of the northern Great Basin are complex and vary considerably. These qualities create uncertainty for land managers when it comes to choosing, implementing, and tracking management actions. Annual changes in weather patterns and spatial variation in site characteristics, along with historic and recent disturbances, create many different and intertwined vegetation communities. Managers need to understand and simplify this complexity to efficiently focus their efforts.
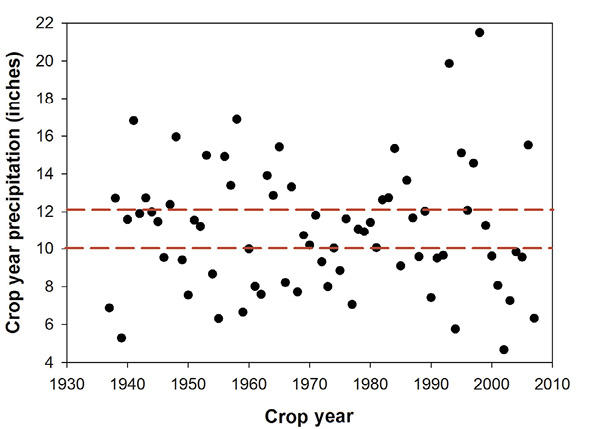
In the northern Great Basin, annual precipitation can fluctuate greatly. For example, at the Northern Great Basin Experimental Range in southeast Oregon, between 1937 and 2007 the annual precipitation ranged from less than 5 inches to more than 21 inches (Figure 1). Of the 70 years in that period, only about 1 year in 4 fell within 10% of the long-term average. This fluctuation can have a major impact on plants. Annual precipitation is especially important for vegetation in dry systems like the sagebrush ecosystem, driving plant growth and biomass. Wet years may be highly productive; during dry years, plants may be dormant (Bates et al. 2006, Bates 2009, Boyd and Svejcar 2011). This annual variability in vegetation has important implications for management concerns such as wildfire risk.
Climate change will likely make predicting management outcomes even more difficult. A recent review projected that the northern Great Basin will experience increased temperatures, drier summers, and more variable and unpredictable annual precipitation (Mote et al. 2013). Hotter, drier rangelands with increased wildfire risk could create new plant communities with previously unreported species composition and abundance (Polley et al. 2013). With all these potential shifts, managers will need to classify vegetation in broader categories in order to assess success.
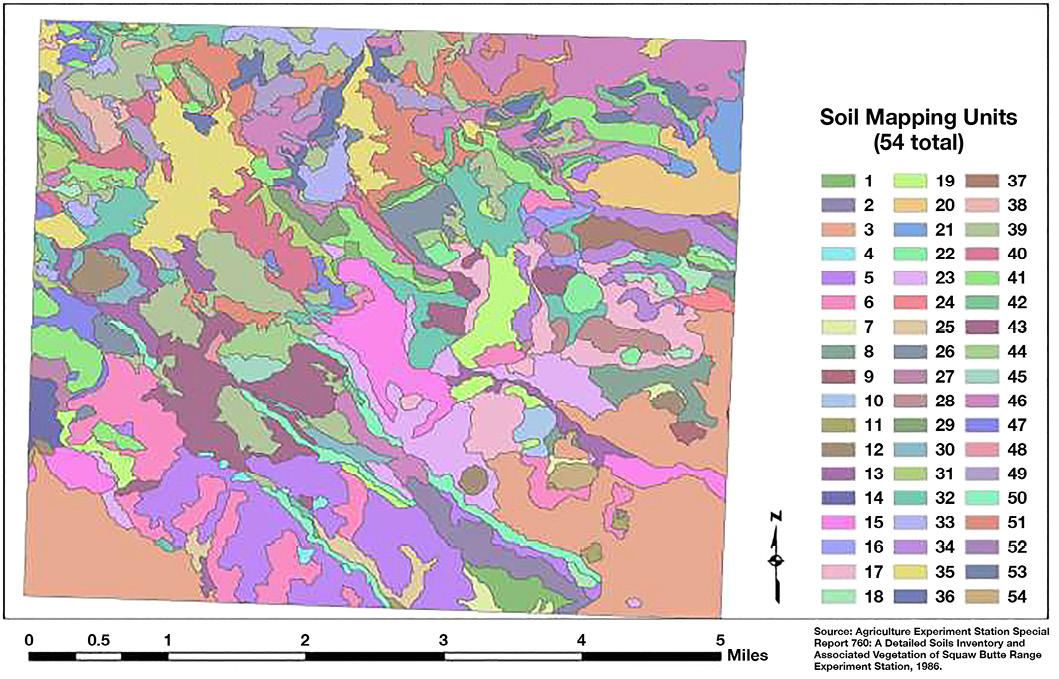
Spatial variation in slope, aspect, and soil conditions can differ tremendously over relatively short distances. This region has a tumultuous past including volcanic activity, uplifting mountains, and glacial activity with ice dams and enormous Pleistocene lakes (Svejcar 2015). The resulting geology, topography, and sediments create a complex mosaic of soils. For example, a detailed soil survey of the 16,000-acre Northern Great Basin Experimental Range conducted between 1982 and 1984 found 54 different soil mapping units, each with distinctive soil types (Lentz and Simonson 1986) (Figure 2). Pastures in the northern Great Basin are often the same size as the Northern Great Basin Experimental Range. At that scale, it isn’t realistic for managers to plan for or manage so many distinct units and their related plant communities.
The climate and ecological variability in this region make it impractical to micromanage for highly specific vegetation characteristics. Threat-based land management is a more generalized approach and can guide land management without overwhelming personnel and other resources. Balancing site-specific details with broad vegetation classifications can be a significant challenge. With limited resources and competing obligations, managers need a way to simplify the complex variation inherent to rangeland landscapes while retaining ecological validity and management relevance. Using the threat-based land management framework, the speed and scale of categorizing the landscape can match the speed and scale of effective management, decision-making, and action.
Overview of method
The following are the six steps for implementing threat-based land management. The theory and rationale behind each step is discussed further in this guide. The method begins with an additional Step “0” to emphasize the importance of clear management objectives when using any decision-support system, including this one. Threat-Based Land Management in the Northern Great Basin: A Field Guide (PNW 723) follows the same six-step process and is specifically designed to walk managers through applying this framework in the field with a user-friendly and field-ready format.
- Establish your management objectives: Clearly stated objectives are necessary to make key scale and management decisions.
- Understand relevant ecology: This method uses functional groups and simplified vegetation patterns to identify ecological states.
- Understand threats: In the northern Great Basin, the primary threats are annual grass invasion, conifer encroachment, and their interaction together and with wildfire.
- Understand states: In this framework, nine different states represent current vegetation condition. These states are evaluated and distinguished by key functional groups.
- Choose appropriate scale and delineate states: Mapping can be difficult and subjective no matter what classification is being used. This section offers considerations for identifying an appropriate mapping scale. A decision tree and photographs help with determining state.
- Assess apparent trend: Apparent trend is a snapshot estimate of plant community trajectory. It is a useful and efficient tool for assessing which locations are stable or may require intervention or additional monitoring.
- Identify management actions: This section provides a few examples of how state and trend information can streamline the selection of management actions. More specific applications of this framework will be explored in additional publications and resources.
0. Establish your management objectives
Management objectives are critical to any planning effort because they guide project steps. For instance, increasing forage supply for livestock may entail very different strategies than improving nesting and foraging conditions for sage-grouse. Objectives connect managers’ knowledge with actions to achieve the desired outcomes.
There are many criteria for creating strong objectives. These include making the objectives measurable, directly linked to an assessment process, and inclusive of ecological processes that can be influenced either through manipulation or maintenance. There are many resources to help managers develop strong objectives. For example, the Bureau of Land Management’s Assessment, Inventory, and Monitoring Program has resources for developing management objectives and choosing an appropriate mapping scale (Bureau of Land Management, MacKinnon et al. 2011).
In this framework, setting management objectives is Step 0. This step should occur before starting any management efforts, whether you use this method or a different management framework. To identify, map, and manage ecological threats effectively, land managers should know what their desired outcomes are. Without clear and robust management objectives, success will be impossible to measure.
1. Understand relevant ecology
This framework categorizes vegetation in functional groups, making it easier to assess the ecology of large landscapes. Functional groups are commonly used in landscape ecology because collecting monitoring data tends to be quicker and less prone to observer error than identifying plants individually (Lavorel et al. 1997, Duckworth et al. 2000). Visually evaluating trend is simpler with only seven functional groups instead of 25–30 different species. Finally, variation in individual species abundance resulting from spatial variation in soil composition (Figure 2) is less of a problem.
While the basis of this guide is measuring functional groups, it can be valuable to record the presence of individual species as well. In some cases, management decisions require knowledge of species and even subspecies (as in the case of big sagebrush, Artemesia tridentata). For example, it would be appropriate to measure density of large perennial bunchgrasses as a functional group but also note that Idaho fescue (Festuca idahoensis) and bluebunch wheatgrass (Pseudoroegneria spicata) are co-dominant. The density measurement provides an indication of understory condition, and the dominant species indicate site resilience and inform seeding mixes where restoration is required.
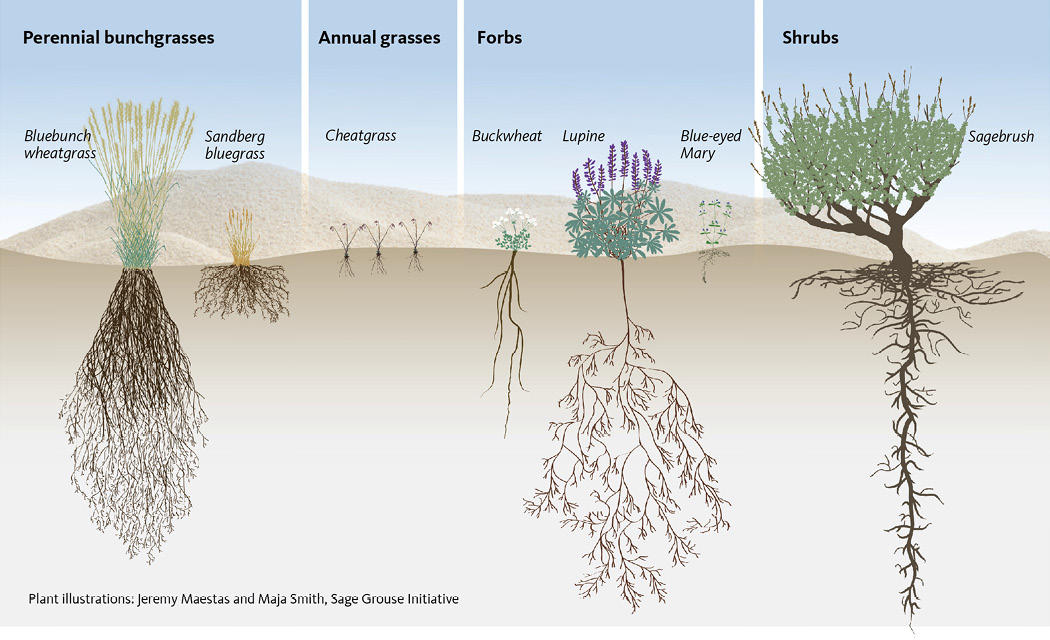
This framework uses seven different functional groups: large perennial bunchgrasses (LPBG), small perennial bunchgrasses (SPBG), invasive annual grasses (IAG), annual forbs (AF), perennial forbs (PF), sagebrush and conifers (Figure 3). Rationale for the groups and important species in the northern Great Basin are described below.
Large perennial bunchgrasses
Large perennial bunchgrasses are critical for the long-term sustainability of native vegetation communities because they effectively compete with annual grasses (Davies 2008, Boyd and Svejcar 2011, Davies et al. 2011). Their root-masses bind soil in place and increase infiltration (Pierson et al. 2007). They also provide forage and habitat for wildlife.
Primary species include bluebunch wheatgrass, Idaho fescue, Thurber’s needlegrass (Achnatherum thurberianum), needle and thread (Hesperostipa comata), squirreltail (Elymus elymoides), and Indian ricegrass (Achnatherum hymenoides). The non-native bunchgrass crested wheatgrass (Agropyron cristatum) and its allies are widespread across the northern Great Basin and fill an ecological niche similar to that of native LPBGs . That said, the role of crested wheatgrass should be based on specific management objectives (see step 4).
Small perennial bunchgrasses
Small perennial bunchgrasses are separate from larger bunchgrass species because they fill a different ecological niche (James et al. 2008). They are characterized by relatively shallow root systems that may compete differently with invasive plant species. These grasses can dominate in harsh, shallow soil sites or where heavy and continuous grazing has reduced other bunchgrasses. In much of the northern Great Basin, the primary species is Sandberg’s bluegrass (Poa secunda), a low-statured and early growing grass common across the western sagebrush ecosystem.
Invasive annual grasses
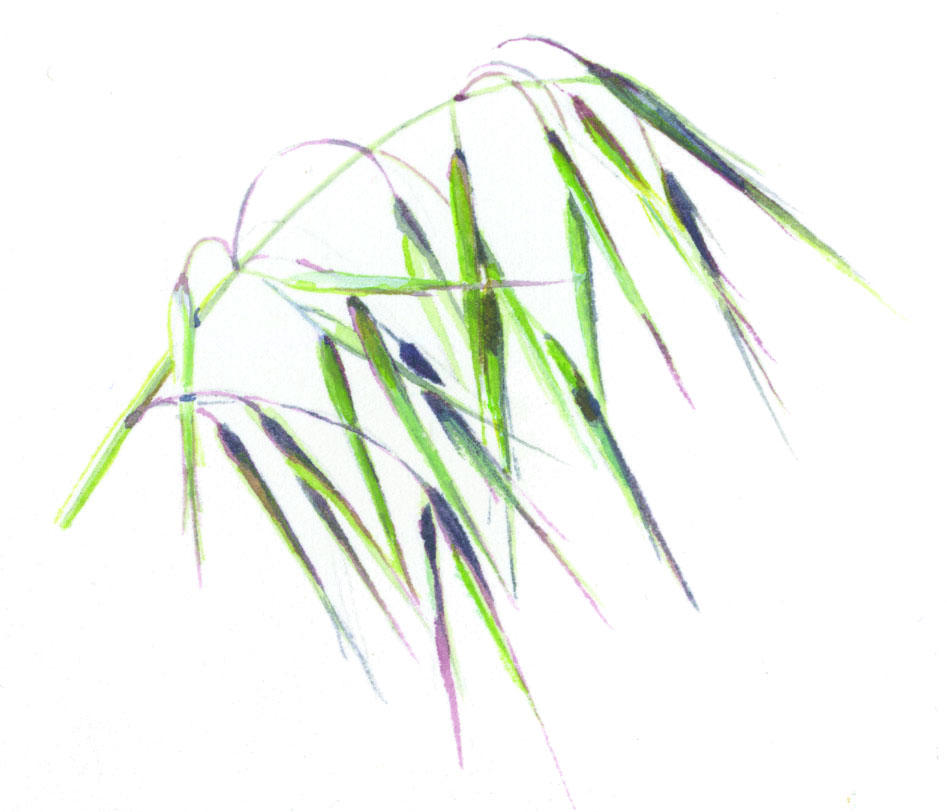
Invasive annual grasses can fundamentally alter vegetation communities by filling in areas where native grasses are not sufficient. This dramatically increases fire frequency and leads to a loss of sagebrush and perennial grass cover. The primary species in this group are cheatgrass (Bromus tectorum), medusahead (Taeniatherum caput-medusae), and ventenata (Ventenata dubia), though other species are expanding in parts of the northern Great Basin. This framework does not focus on native annual grasses because they are not prominent in this region.
Annual forbs
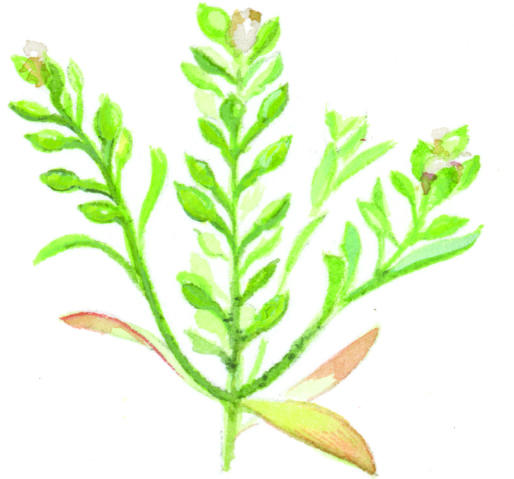
These small-statured plants have highly variable productivity, depending on yearly and site conditions. Common species include native blue-eyed Mary (Collinsia parviflora) and the non-native alyssum (Alyssum desertorum). Some common mustard species can reach substantial heights on disturbed soils or under favorable climatic conditions. Generally, annual forbs may not have tremendous ecological impact. In some years, though, their density and cover can overwhelm perennial forbs. Large numbers of non-native species can indicate depleted understory conditions.
This category does not include larger-statured weedy species such as yellow star thistle (Centaurea solstitialis). These are commonly listed as noxious weeds and should be mapped and managed on a species-specific basis. The best way to identify separate species within this group (for example, small-statured forbs vs. knapweeds) is for experienced managers to examine them at the site.
Perennial forbs
Perennial forbs consist of native species that often have highly variable distributions and respond with dramatic variation in production (cover, density, size, etc.) annually based on growing conditions. At a given site, this group typically includes more species than the other functional groups. Inventory date can influence sampling results for this group. Some species are brittle once dry and thus may be missed in late-season sampling (Pokorny et al. 2004). This group does not include noxious weed species, such as skeletonweed (Chondrilla juncea), which should be mapped and treated on a species-specific basis with expert and local knowledge.
Sagebrush and other shrubs
This group includes shrub species and subspecies. Identifying the species and subspecies of sagebrush can help determine site potential, plant community resilience, and restoration practices. Common sagebrush species and subspecies include Wyoming big sagebrush (A. tridentata ssp. wyomingensis), mountain big sagebrush (A. tridentata ssp. vaseyana), and low sagebrush (A. arbuscula).
Other shrub species can help identify past land use and site potential, and generally should be noted to the species level. For example, a high proportion of rabbitbrush (like Chrysothamnus viscidiflorus) may indicate a past disturbance, greasewood (Sarcobatus vermiculatus) may indicate saline soil conditions, and low sagebrush may indicate shallow soil conditions.
Conifers
This group includes tree species that are encroaching on the historically treeless sagebrush ecosystem. Large and expanding populations of western juniper (Juniperus occidentalis) are of major concern in the northern Great Basin, while Utah juniper (Juniperus osteosperma) and pinyon pine (Pinus sp.) are major threats in other regions. As with sagebrush, we recommend identifying individual species in this group. For this guide, we use the term “juniper” when discussing conifer encroachment because western juniper is the most prevalent conifer species in the northern Great Basin.
Plant succession: Perennial bunchgrasses as the glue of the sagebrush ecosystem
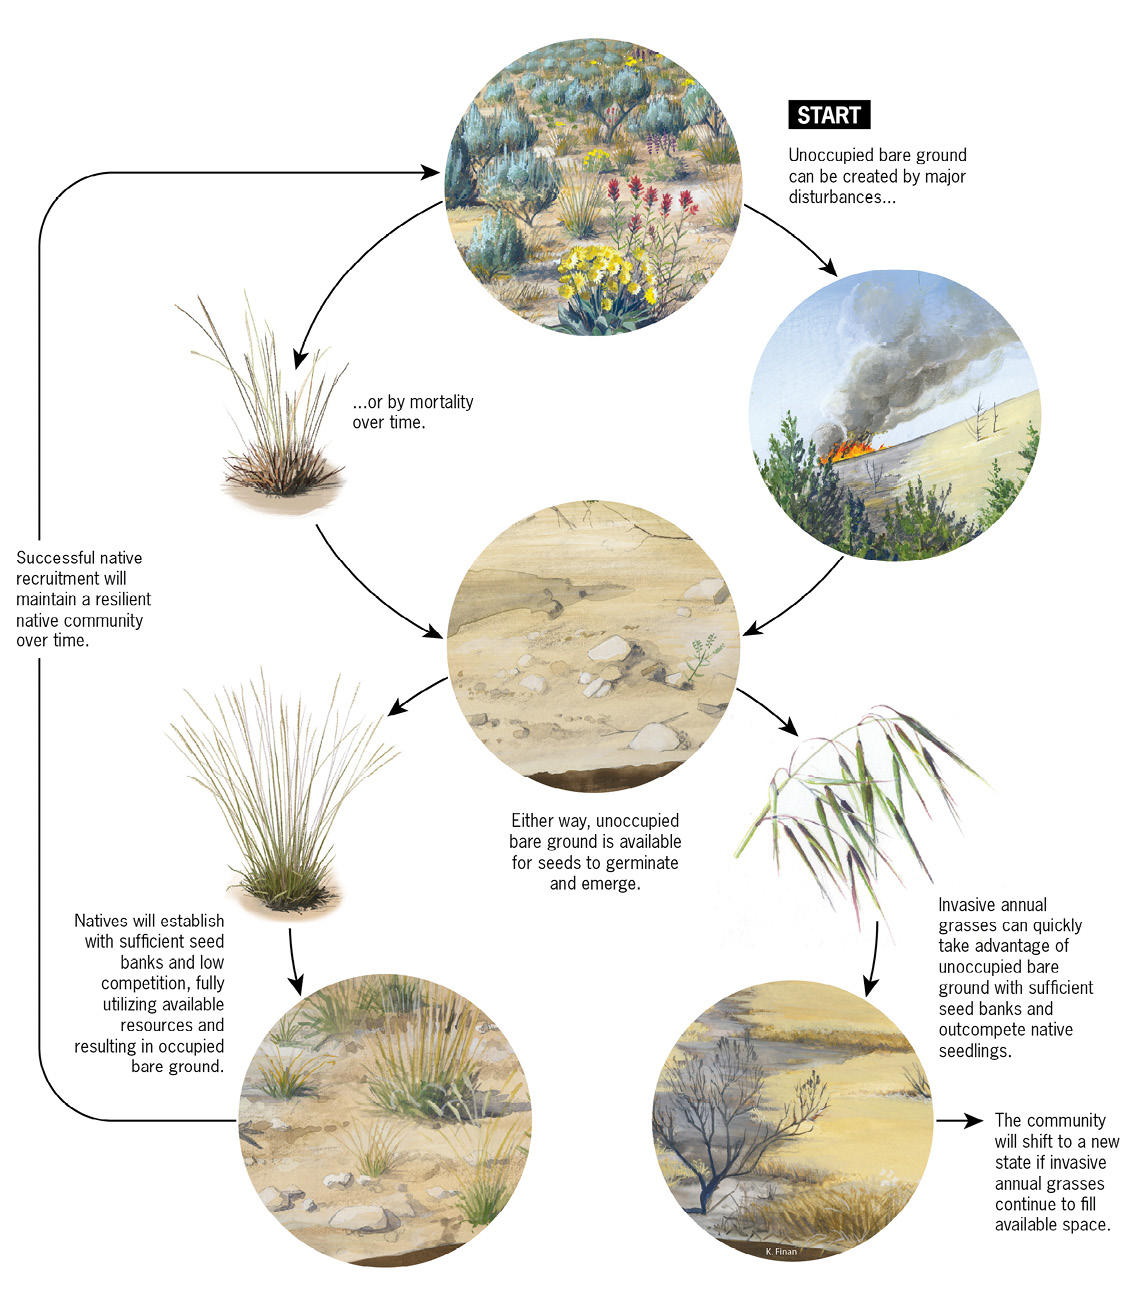
Vegetation change occurs when new functional groups occupy gaps in existing vegetation. In the northern Great Basin, large perennial bunchgrasses are the glue holding the sagebrush ecosystem together. Loss of these species by disturbance or mortality over time creates openings for invasive annual grasses to establish and eventually dominate (Svejcar et al. 2014) (Figure 4).
Once present, invasive annual grasses have the performance edge to replace perennial vegetation. Restoration is very difficult once invasive annual grasses gain dominance because native perennials are poorly adapted to the more frequent fires often associated with annual grass invasion. While established perennials can compete with cheatgrass and medusahead, their slow-growing seedlings are poorer competitors. This relationship makes bunchgrass density and gap size (distance between bunchgrasses) useful metrics for assessing how vulnerable a site is to invasive annual grasses.
2. Understand threats
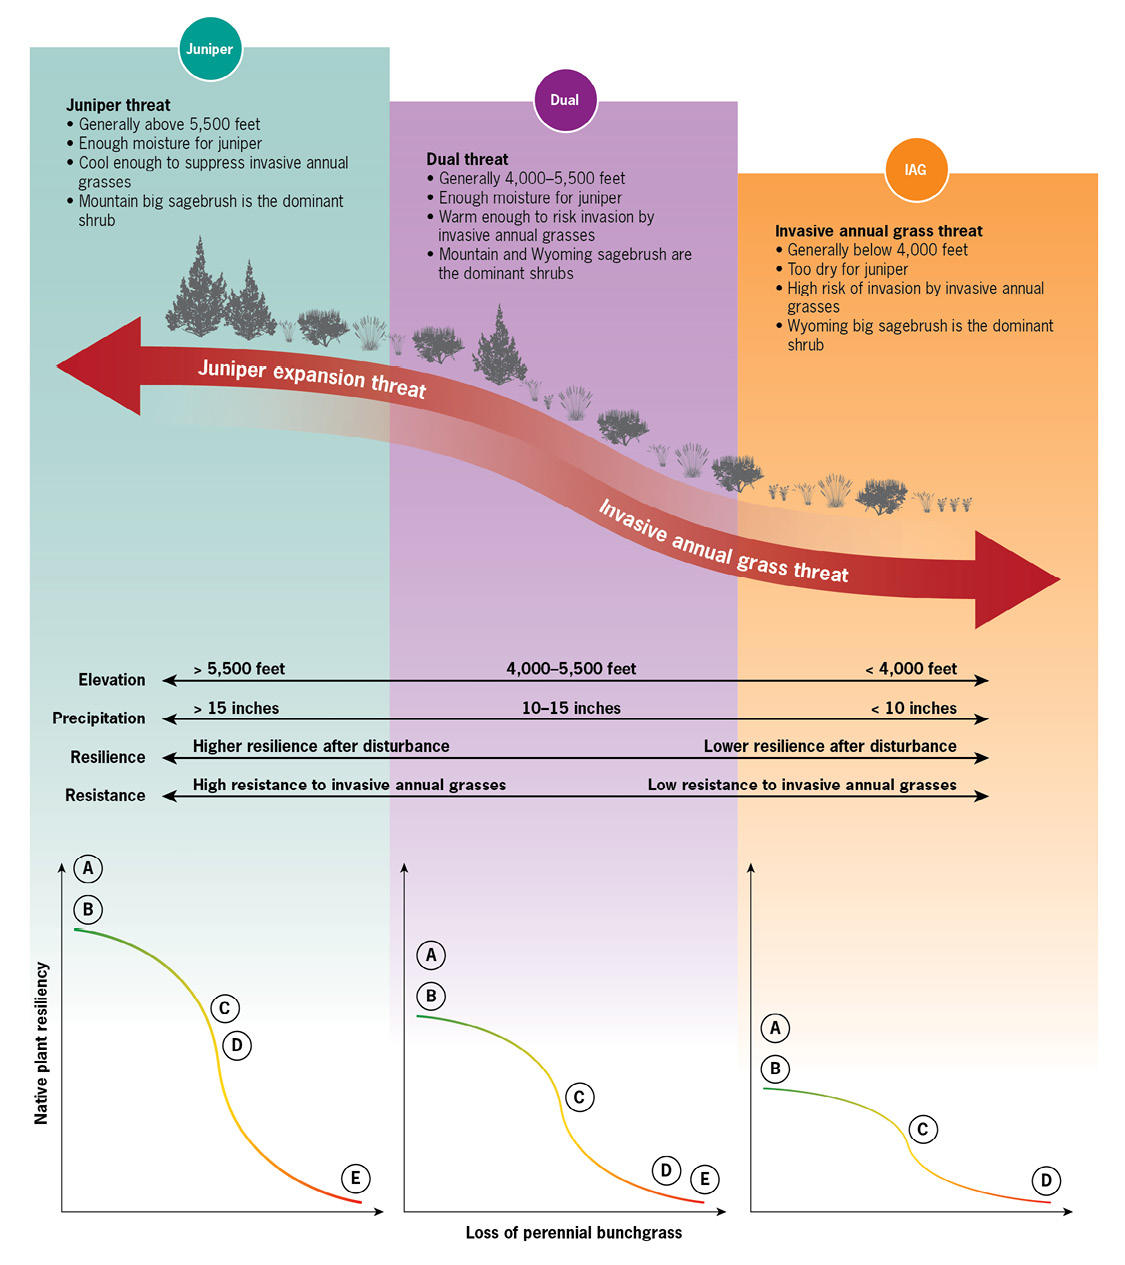
The primary threats to intact sagebrush ecosystem function in the northern Great Basin include invasion of annual grasses, expansion of native juniper populations, and associated changes to fire regimes. While other factors also threaten this ecosystem, their contributions to fragmentation and loss of intact plant communities are largely secondary to those of the primary threats. Managers must first address these primary threats to healthy ecosystem function because, if left unchecked, primary threats will likely make other management priorities unachievable.
Annual grass invasion, juniper encroachment, and the management challenges they present vary at different elevations. Invasion of annual grasses and their interaction with wildfire is most problematic in low- to mid-elevation Wyoming big sagebrush plant communities. Invasive annual grasses form continuous fuel beds, leading to larger, more frequent fires that can reduce or eliminate desired perennial plant species. Juniper encroachment is most problematic at higher elevations, where it has increased dramatically. Increased juniper can reduce desired perennial vegetation and negatively impact sensitive wildlife. For example, sage-grouse avoid habitat with even small amounts of juniper due to an instinctive aversion to vertical structures and the associated higher predation risk (Coates and Delehanty 2010, Baruch-Mordo et al. 2013, Severson 2016, Severson et al. 2017). Another example are the several species of sagebrush-obligate songbirds that are less abundant at untreated sites compared to sites where juniper has been removed (Holmes et al. 2017). Both threats can be found in many mid-elevation transitional communities.
Threat-based land management explicitly focuses on primary threats to ecosystem function. This framework describes how primary threats erode stability in plant communities and how management can influence those factors. By prioritizing the most pressing issues, managers can contain, stabilize, improve or protect a plant community based on the expression of primary threats. Ultimately, the goal of this framework is to promote resilient sagebrush ecosystem vegetation for key needs such as wildlife habitat and livestock forage.
Threat-based land management and state-and-transition models
This framework is based on state-and-transition models. STMs represent variation in plant community composition and structure (states) along with the factors that shift a plant community from one state to another (transitions), linking ecological condition with factors driving variability. Taken collectively, this information provides a blueprint for moving a plant community to a desired state, or maintaining that state once it is achieved.
The complexity of STMs should be proportional to their intended use. Complex models with many states (and further phase subdivisions) can describe plant community change over time. These models typically attempt to quantify probabilistic transitions between specific vegetation phases and states (Bestelmeyer et al. 2003, Stringham et al. 2003). Researchers use these models to develop testable hypotheses that improve our understanding of plant community ecology.
Land managers concerned with decision-making at much larger scales may opt for simpler models related to specific management concerns. This is particularly true when large areas of rangeland are being impacted by the same few threats or management challenges. Threat-based land management was developed for this situation. It illustrates plant community change and transition factors relative to the management issues associated with primary threats.
This framework identifies major vegetation states representing plant communities with unique combinations of threats and levels of risk. This approach follows that originally proposed by Westoby et al. (1989). Because this framework has few states to consider, and because those states are typically highly recognizable, these models diverge from other STM approaches that include phase subcategories. In doing so, this simple but useful framework can be easily communicated to and adopted by a diverse set of stakeholders. Additionally, these generalized states can simplify diverse species composition into a few ecologically-based categories relevant to large-scale management planning.
This framework is not meant to account for all possible vegetation states. Instead, it focuses on identifying the states most relevant to ecosystem integrity. It illustrates predominant and recognizable states as well as the changes between states due to major disturbances and primary threats to the ecosystem. The framework does not preclude using the more complex models for site-specific decision-making.
Sagebrush threat model development for the northern Great Basin
Three original threat-based land management STMs were developed between 2012 and 2014 in response to the potential Endangered Species Act listing of greater sage-grouse. These models were intended to bridge the expertise and concerns of a range of stakeholders to create constructive and consistent management goals across land-ownership boundaries.
Three initial sagebrush threat models focused on:
- Invasive annual grass threat
- Invasive annual grass and juniper expansion threat (dual threat)
- Juniper expansion threat
With subsequent development and adaptation by land managers, these three models have been condensed into a single framework focused on ecosystem management (Figure 5). This makes state categorization easier, as practitioners can use a single decision tree when assigning states. Additionally, it simplifies the challenge of mapping out separate models on a landscape, the boundaries of which are often difficult to determine and can vary with different mapping scales. However, practitioners still need to understand the three different threat combinations in the original models since they affect choosing the right management for a specific site.
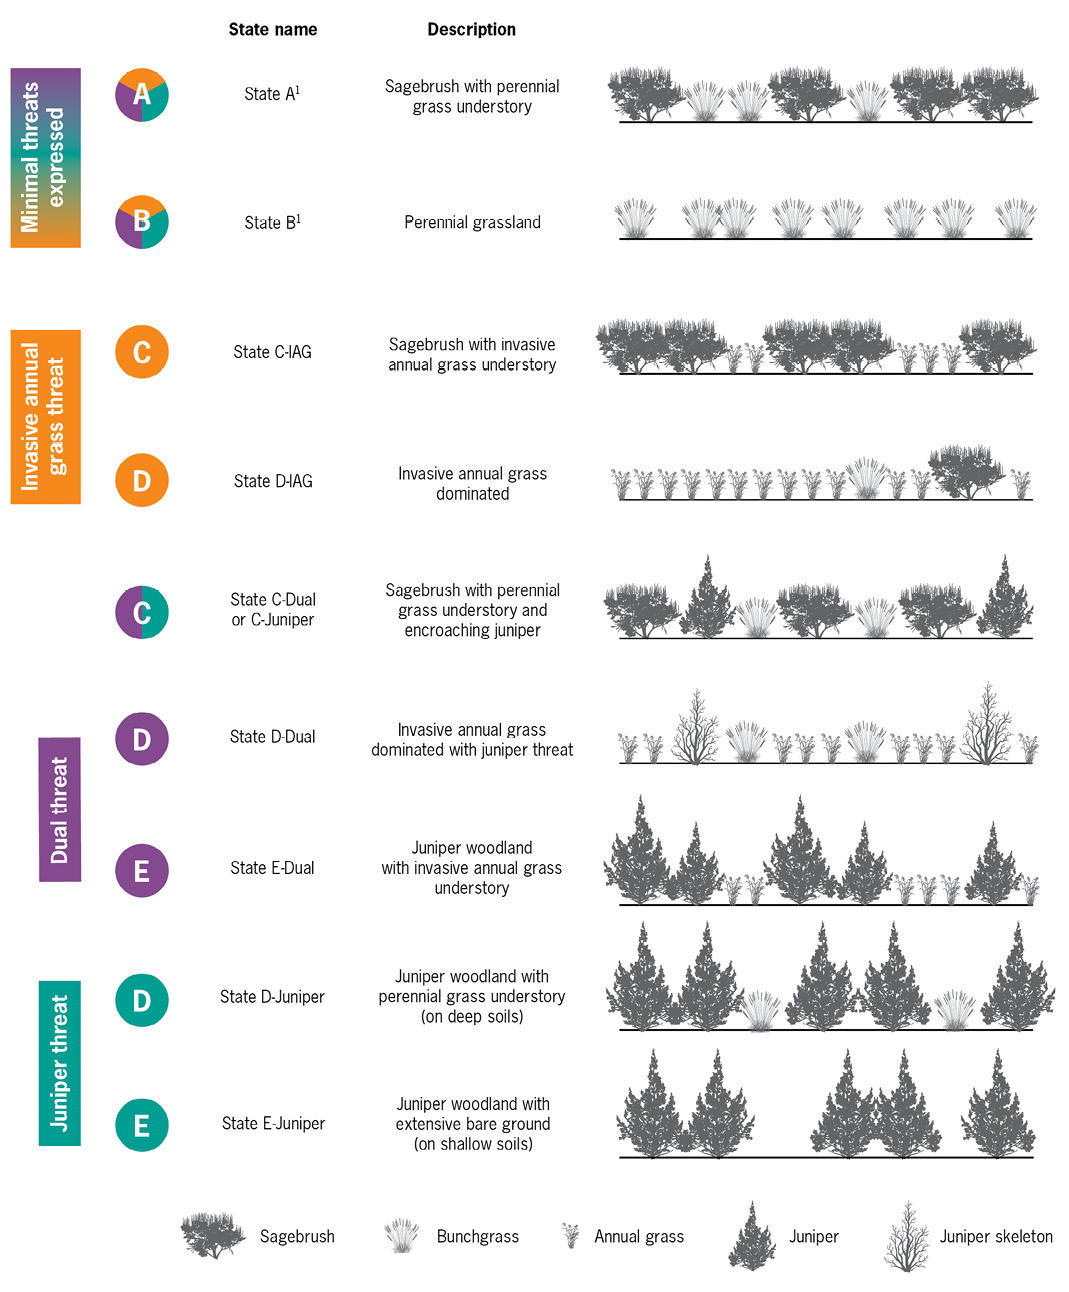
Keeping with this recommendation, states are placed in one of three different ecological threat categories with a corresponding color: invasive annual grass threat (orange), juniper threat (teal), or dual threat (purple)(Figure 5). Each state is designated by a letter between A and E. States A and B have minimal threats expressed, while states C to E have higher levels of threats expressed. The name of each state is the combination of the letter name and the threat expression (Figure 5). For example, State C is denoted as C-IAG, C-Juniper, or C-Dual, depending on whether it is within the Invasive annual grass, Juniper, or Dual threat models, respectively.
Linking plant community ecology with resistance and resilience
Resilience and resistance are important tools for understanding which threats might affect an area of interest in a plant community. Resilience denotes the likelihood that, following disturbance, a plant community will return to pre-disturbance conditions. Resistance denotes the likelihood that, following disturbance, a plant community will not experience significant increases in invasive annual species.
Abiotic conditions have large implications for resilience and resistance. For example, both resilience and resistance tend to increase with elevation and precipitation, linked to the changes in temperature and available moisture. Plant community resistance increases with elevation because lower temperatures limit invasive annual grass reproduction. Plant community resilience also increases with elevation because increasing precipitation and plant productivity reduces the competitive advantage of invasive annual grasses (Chambers et al. 2014). At relatively warm and dry low-elevation sites, resilience and resistance are very low, and undesired transitions may be difficult to reverse. Preventing these transitions using tools such as fuels management and grazing management is a priority. At relatively cool and moist higher-elevation sites, undesired transitions are more easily reversed and restoration is more likely to succeed.
Biotic conditions also have a large influence on resilience and resistance. Resilience and resistance vary strongly among states. This variation is collectively represented as “native plant resiliency” (Figure 6), which is simply the likelihood that a plant community will return to a desired native plant composition following disturbance. Variation in native plant resiliency is largely driven by the abundance of desired perennial vegetation. Perennial bunchgrasses are particularly important because they are key to reducing the establishment and expansion of invasive annual grasses. Where juniper is the only threat, reduced perennial grass abundance can lead to degraded site conditions (such as erosion) following removal or reduction of juniper. Thus, the difference in native plant resiliency between states is based largely on the abundance of native perennial bunchgrasses (Figure 6).
3. Understand states
Within the context of the three primary threats, this framework uses a consolidated decision tree to depict nine different ecological states (Figure 7). The associated resource, Threat-Based Land Management in the Northern Great Basin: A Field Guide (PNW 723), was specifically designed to help practitioners map ecological states (Appendix B). In this manager’s guide, graphics adapted from the field guide demonstrate the process of determining state. Each threat category is color-coded in the decision tree: the invasive annual grass threat with orange, the juniper expansion threat with teal, and the dual threat with purple. Plant community states are indicated by letters A to E. States A and B are categorized as “minimal threats expressed” and are color-coded with all three colors because even the most intact sites are at risk if stressed and disturbed, especially when degraded sites are nearby.
The decision tree is expressly not quantitative. However, quantitative guidelines can help determine plant community membership in states. These guidelines are not absolute breakpoints and should be interpreted using information on both current site characteristics and ultimate site potential. These guidelines should not substitute for local knowledge. Photographs of typical examples for each ecological state can be seen in Figure 8.
This framework is relevant to landscapes where the potential and desirable condition is sagebrush ecosystem vegetation. Historically non-sagebrush sites, including wetlands, riparian areas, and old-growth juniper woodlands, should not be managed using this framework in its current form because the states in this guide are not designed for those communities. Understanding and differentiating potential and desirable native vegetation from historically non-sagebrush vegetation is best supported with local expert knowledge and site-specific planning tools such as ecological site descriptions.
The transitional nature of plant communities
Understanding the trend of plant community change relative to primary threats is as important as assigning states. Some sagebrush plant communities will not fit cleanly into one of the states identified in the decision tree (Figure 7). These transitional or intermediate plant communities often need more intensive evaluation and monitoring to clearly understand how they are changing. Estimating vegetation changes with a high level of certainty requires trend monitoring. However, managers often lack the luxury of trend-monitoring information when and where it is needed, forcing them to use point-in-time assessments for conservation planning. Managers must be able to characterize the plant community state and its apparent trend with sufficient certainty to interpret the relative risk of primary threats and to understand how to reduce or eliminate those threats.
Sites with uncertain states need more trend monitoring. Additionally, as apparent trend uncertainty increases, the frequency with which you monitor actual trend should increase as well. For example, a low-elevation Wyoming big sagebrush plant community with an overstory of sagebrush cover greater than 10% and an understory co-dominated by perennial and invasive annual grasses is not easily placed in a state in the framework — it’s a mixture of States A and C. For a site intermediate between States A and C, managers should indicate a plant community in transition and describe apparent trend based on management and plant community characteristics. Managers should increase monitoring intensity in these situations, particularly if a trend is not apparent in the initial assessment. For more specific information on determining apparent trend, refer to step 5.
4. Choose an appropriate scale and delineate states
Questions surrounding scale can create confusion when mapping states across an area of interest. Deciding what area is large enough to matter but small enough to manage is a persistent problem with any mapping exercise. This confusion can be reduced by establishing management objectives and clear project area boundaries. For example, the Bureau of Land Management’s Assessment, Inventory, and Monitoring Program has resources for developing management objectives and choosing an appropriate mapping scale (Bureau of Land Management, MacKinnon et al. 2011).
This framework is generally best suited to the pasture scale (10,000s of acres) but can be used at coarser or finer scales. However, at the scales used for project implementation (1,000s of acres or finer), additional tools such as ecological site descriptions will help inform how specific sites will likely respond to management actions.
Individual managers will have to make decisions about the scale at which they should map threats. As a starting point, managers can determine the smallest scale at which they would implement a management practice. This would be the finest scale at which mapping would produce information relevant to management planning in service of a specific objective.
Factors to consider when developing objectives and deciding on relevant scale include:
- Potential for successfully meeting project objectives.
- Resource and financial constraints and planning barriers (for example, National Environmental Policy Act requirements, ownership boundaries).
- Feasibility of treatment implementation.
- Spatial arrangement of threats across the landscape (for example, patch size and extent).
Mapping is an iterative process. Managers need to consider objectives, states, and appropriate mapping scale collectively (Figure 9). Remote sensing products can be used to initiate field mapping exercises and estimate map unit sizes. However, because of the detail available in many remote sensing products, managers will have to weigh the advantages and disadvantages of different pixel sizes. Lastly, personal preferences inevitably affect this process: Some managers are inclined to lump together habitat conditions resulting in coarser scale polygons, while others prefer finer-scale polygons and split the same conditions.
This guide does not provide a full accounting of all possible considerations related to scale (for example, differing grain of remote sensing data sources), but the following examples attempt to illustrate the importance and complexity of forethought when relating scale, threats and management objectives.
In Figure 10, two adjacent pastures are mapped by different land managers with different management objectives. The management objective for Pasture 1 (red) is to maintain livestock forage within a native plant community. State C-Juniper is mapped in Pasture 1 to capture the bulk of expanding juniper but does not include isolated trees farther out because the manager does not think they are currently impacting forage production in otherwise intact State A. The manager is planning a juniper cut of the largest trees to prevent the eventual transition to States D-Juniper or E-Juniper and a subsequent loss of understory plants. The manager could have mapped the outlying juniper as well, but management objectives focused on addressing only the main juniper stand.
In contrast, the manager for Pasture 2 (blue) has a management objective of improving sage-grouse habitat. The manager for Pasture 2 was very concerned with all the encroaching juniper, as even sparse juniper cover can lower habitat value for sage-grouse. Thus, the State C-Juniper polygon encompasses all juniper present in the pasture.
This companion example demonstrates how mapping scale decisions are dependent on management objectives and the extent and distribution of key threats. There are tradeoffs in each plan. The uncertainty associated with specific outcomes reinforces the necessity of investing in trend monitoring and applying adaptive management, in which questions of scale are included (discussed in the next step).
5. Assess apparent trend
Apparent trend is a point-in-time estimate of vegetation community trajectory, based on management, site, and plant community factors (Figure 11). Understanding vegetation change with certainty requires actual trend monitoring over multiple years, which is often expensive and time-consuming. Apparent trend provides a rapid assessment of likely vegetation change and can inform management decisions when actual trend monitoring is unavailable or infeasible. In practice, even seasoned range professionals experience some discomfort assessing apparent trend. To decide how to monitor a site, managers should consider effort, uncertainty, and potential management actions.
Assessing apparent trend is summarized into five evaluation factors. The following is a discussion of each factor. Estimates of apparent trend are ideally based on multiple factors, and site-specific characteristics will influence each factor’s relative importance. Local and expert knowledge will greatly improve the utility of estimating apparent trend. Managers should consider the results of all five factors collectively when determining if the apparent trend is upward, stable, downward, or unclear. Unclear apparent trend is often caused by multiple contradictory factors and means more frequent actual trend monitoring is needed.
Factor 1. Consider the condition of interspaces between existing desirable vegetation.
The threat of invasive annual grasses increases with available space. Mature perennial vegetation limits the amount of available space present. If the site has a functional shrub component, large perennial bunchgrasses in the interspaces between shrubs indicate a stable or upward trend. If shrubs are largely absent but large bunchgrasses are present, desirable cover between bunchgrasses includes bare ground, biological crusts, litter and desirable forbs. While other apparent trend factors can partially mitigate a site’s trend if they are positive (see factors discussed below), invasive annual grasses in the interspaces generally indicate a downward apparent trend.
Managers need to assess both the current and potential expression of invasive annual grasses. Assessing potential expression is necessary because cover and density of these species will fluctuate with variation in annual precipitation and temperature. To estimate potential, managers can determine if the soil profile is occupied or unoccupied by the roots of desirable plants or available for invasive annual grass roots.
Root activity belowground will dictate whether an open space (bare ground) is really available to invasive species. While bare ground may appear barren and problematic aboveground, managers need to consider if perennial plant roots are occupying the soil. Perennial root masses take up nutrients and water, reducing resources available to invasive annual grasses and limiting the expression of the threat.
In healthy sagebrush ecosystems, desirable perennial plant roots occupy soil profile niches beneath apparent bare ground. In healthy range, scientists call bare areas occupied bare ground. Conversely, in plant communities where perennial vegetation, particularly large perennial bunchgrasses, is reduced or lacking, niches are left unfilled and apparent bare ground can be considered unoccupied bare ground. These areas are susceptible to invasive annual grasses.
Perennial bunchgrass density is the best indicator of whether bare ground is occupied or unoccupied. Closely spaced, mature perennial bunchgrasses will greatly limit unoccupied bare ground. Generally, if perennial bunchgrasses are an easy step apart from each other, their density should be adequate and any apparent bare ground is likely occupied by perennial root masses. Conversely, if bunchgrasses are more than a step apart, much of the apparent bare ground is likely unoccupied and available to invasive annual grasses.
Factor 2: Consider the likely future potential for juniper woodland encroachment.
Juniper can encroach into otherwise intact sagebrush habitat over a few decades. Only the complete lack of juniper trees, seedlings and saplings indicates a stable apparent trend. Sites with large juniper (greater than 6 feet tall) are likely already experiencing negative effects of encroachment and have a strong downward apparent trend. For sites without large juniper, managers should look carefully for seedlings and saplings (less than 6 feet tall) that indicate future encroachment. The density of juniper and the proximity to seed sources will affect the rate of future encroachment at a site.
Factor 3: Assess evidence that desirable vegetation is successfully recruiting.
While mature perennial plants are required to maintain a site’s resistance to invasive annual grasses, managers should look for evidence that desired perennial plants are successfully recruiting. Even without disturbance, perennial plants must periodically recruit new individuals to sustain their presence in the plant community over time. A site has a stable or upward apparent trend if multiple age classes of desired perennial plant functional groups are present at acceptable densities. Apparent trend could be downward for sites with only mature individuals and limited or no evidence of recruitment by desirable functional groups, particularly if unoccupied bare ground and invasive annual grasses are present.
Factor 4: Consider the potential for bunchgrass mortality in the event of wildfire.
While large perennial bunchgrasses are the most important functional group for a resistant plant community, they need to survive wildfire to maintain long-term site resiliency. Heat intensity and associated bunchgrass mortality can be highly localized during a wildfire. Bunchgrass mortality is typically highest beneath shrub canopies because woody shrub biomass burns with high heat intensity for extended durations (Hulet et al. 2015). Bunchgrasses occupying interspaces between shrubs typically survive wildfires at higher rates because they experience briefer and less intense heating.
If mature, deep-rooted perennial bunchgrasses primarily occupy shrub interspaces, apparent trend is likely stable or upward. If bunchgrasses are primarily located beneath shrub canopies and not in shrub interspaces, apparent trend is downward.
Factor 5: Consider how timing, intensity and duration of livestock grazing, in combination with grazing by wildlife and wild horses or burros, affect desirable vegetation.
Grazing management should promote healthy bunchgrasses and, in turn, resistance to invasive annual grasses. A loss of deep-rooted perennial vegetation resulting from unfavorable grazing practices compromises the plant community’s resistance to invasive annual grasses and reduces resiliency of the plant community to disturbance. While evidence of grazing can be observed in the field, this factor will require additional knowledge about grazing management on the site. Also consider grazing by wildlife and wild horses and burros, if present.
A site has an apparent upward trend if the current grazing management promotes desirable vegetation with planned periods of rest and recovery when it is actively growing, and overall forage demand is in balance with forage supply. A site has an apparent stable trend if current grazing management maintains but does not promote desirable vegetation. A site has an apparent downward trend if the current grazing management consists of continuous or heavy use during active growing seasons, and forage demand consistently exceeds forage supply.
6. Identify management actions
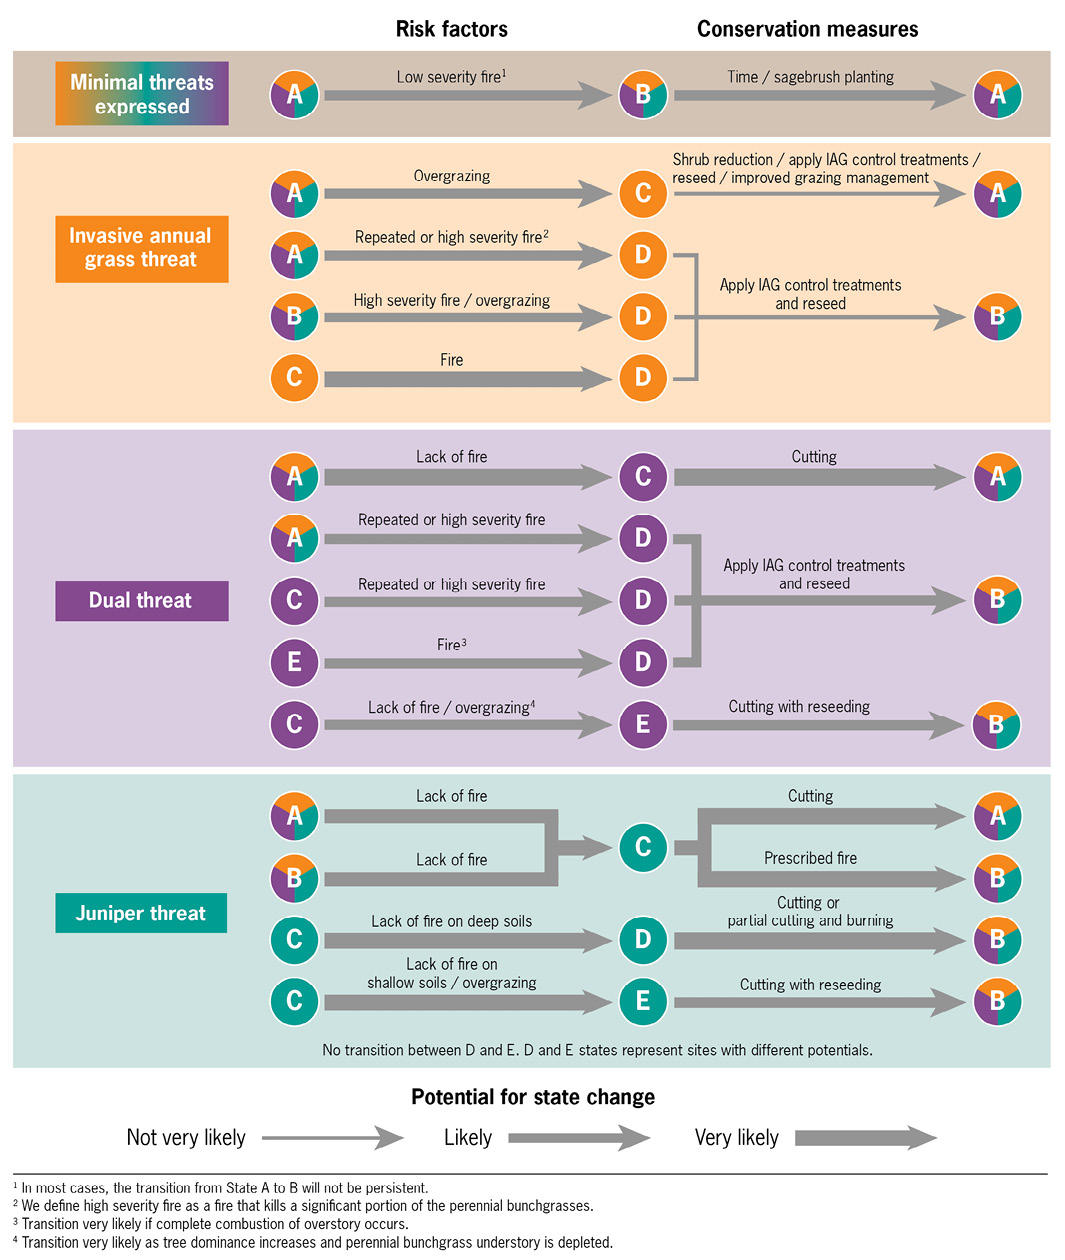
Managers should consider state and apparent trend collectively to prioritize sites and select actions that support their management objectives. Events that could degrade a site’s state are termed risk factors, and management actions targeted at remedying a risk factor are termed conservation measures (Figure 12). Managers can infer risk factors and corresponding conservation actions from a site’s state. Apparent trend informs how likely it is that a risk factor will degrade a site or a conservation measure will improve it. Figure 12 combines this information with a selection of linked risk factors and conservation measures by state and threat. Managers should also incorporate site-specific information, including proximity to degraded sites, when selecting risk factors and conservation measures.
For example, consider a hypothetical pasture with management objectives to prioritize forage needs for seasonal livestock grazing and habitat quality for sage-grouse. A relatively homogenous portion of the pasture that is large enough to matter but small enough to manage is mapped as State C-IAG with a downward apparent trend. The state and apparent trend prioritize this site for intervention because the most prominent risk factor — wildfire — would eliminate the site’s forage and habitat value. Conservation measures to address this risk factor are identified, including wildfire prevention, weed management and seeding. Land managers are now ready to refine management actions by integrating additional resources such as ecological site descriptions for planning more site-specific details like an appropriate seed mix. Results of these actions need to be monitored, and that information should inform adaptive management of the site to support achieving the management objectives.
Each of three topics featured in the previous example are discussed in the remainder of this section:
- Applying adaptive management.
- Matching multiple management tools to different scales.
- Using this framework to support specific issues such as sage-grouse conservation.
Applying adaptive management
Sagebrush ecosystem management takes place within an environment that varies widely. Because of this variability, the effectiveness of management practices is not assured, whether the goal is to maintain plant communities in a desired state or move plant communities from an undesired state toward more acceptable conditions. To be effective, conservation must be applied within an adaptive management framework.
In its simplest form, adaptive management is repeating the cycle of conservation planning, implementation and monitoring that links management actions to management objectives (Figure 13). In this process, long-term trend monitoring and other data sources become relevant to land management decision making. After implementing conservation measures, the learning process begins. This involves periodic evaluation of changes in plant community composition, and then relating those changes back to conservation measures or other possible causes (Morghan et al. 2006).
Managers should also consider and monitor additional relevant factors to separate the effects of implemented conservation measures from other sources outside of management control. Outside factors could include abiotic variables such as weather or biotic variables such as insect outbreaks. If regular monitoring indicates that plant community change is consistent with management expectations, then current management continues until the next evaluation. If plant community change is inconsistent with management expectations, then managers should attempt to discern if alternate conservation measures are needed, or if outside variables (weather, wildfire, etc.) are decreasing the effectiveness of current management actions. When trend monitoring shows that an unfavorable, primarily management-driven plant community change has occurred, the management plan should change.
Trend monitoring can also be conducted in untreated areas to act as control comparisons. The use of controls will help managers separate the effects of fluctuating environmental conditions from the effects of conservation measures.
The most important point is that management of sagebrush plant communities is a process that unfolds in a variable environment. In such an environment, conservation measures are not guaranteed to be effective and must periodically be evaluated and modified as needed through adaptive management.
Matching multiple management tools to different scales
Threat-based land management and management planning are not independent of other tools and frameworks currently being used for similar purposes. This framework focuses on current biotic conditions and complements existing abiotic-oriented tools. The differing utility of these tools largely has to do with scale. To illustrate through example, consider the following scenario:
A BLM rangeland management specialist is tasked with assembling a management plan for a 20,000-acre allotment in Wyoming big sagebrush habitat threatened with annual grass invasion. The primary management objectives are to promote and maintain potential year-round sage-grouse habitat.
The rangeland management specialist should first identify habitat already meeting objectives and its associated trend: areas of State A that possess the structural and compositional characteristics consistent with potential year-round sage-grouse habitat. All State A habitat requires maintenance to prevent annual grass invasion because, once expressed, this threat is difficult to reverse. However, given the acreage involved and the limited management resources, the specialist should prioritize the most-at risk acres. To prioritize management of State A habitat, the specialist could overlay resistance and resilience (R&R) information to identify areas with low R&R values. Low R&R areas are the most at risk for annual grass invasion and the most difficult to restore should they cross a critical threshold of annual grass abundance. When ready to select specific maintenance management actions for prioritized risk areas, the manager can consult ESD information to understand local site characteristics including soils and detailed vegetation phases that will inform grazing management.
In the above example, threat-based land management provides point-in-time information on biotic conditions used to bridge large-scale abiotic (R&R data) and site-scale (ESD data) information. All three of these components are necessary and should be used in concert to determine appropriate management actions. There is no single tool capable of directing all management actions in complex sagebrush ecosystems. The question that informs management decisions is not, “What is the right tool?”, but instead, “How can available tools be used together?”
Threat-based land management and sage-grouse habitat
This framework was originally created to assess habitat suitability for greater sage-grouse by identifying threats to the species and implementing appropriate conservation measures to achieve species-specific management goals. Conservation concerns for sage-grouse populations and subsequent petitions for federal Endangered Species Act listing culminated in a “Not Warranted” decision in 2015, following unprecedented efforts to conserve their populations and habitat. This framework was developed as a part of those efforts. The U.S. Fish and Wildlife Service currently uses an adapted version for sage-grouse-specific candidate conservation agreements on private and public lands in Oregon. Similarly, the Oregon Greater Sage-grouse State Action Plan (Sage-Grouse Conservation Partnership 2015) uses an adapted version of this framework for its mitigation and development programs in sagebrush ecosystems.
Following subsequent development, this framework now serves as an ecosystem assessment and management tool that is useful in multiple management scenarios. Sage-grouse habitat conservation concerns are now just one of many specific applications of this framework instead of its sole purpose. Sage-grouse continue to be an indicator species for overall health of the sagebrush ecosystem. Thus, understanding how this framework can support sage-grouse-specific conservation efforts and tools remains important.
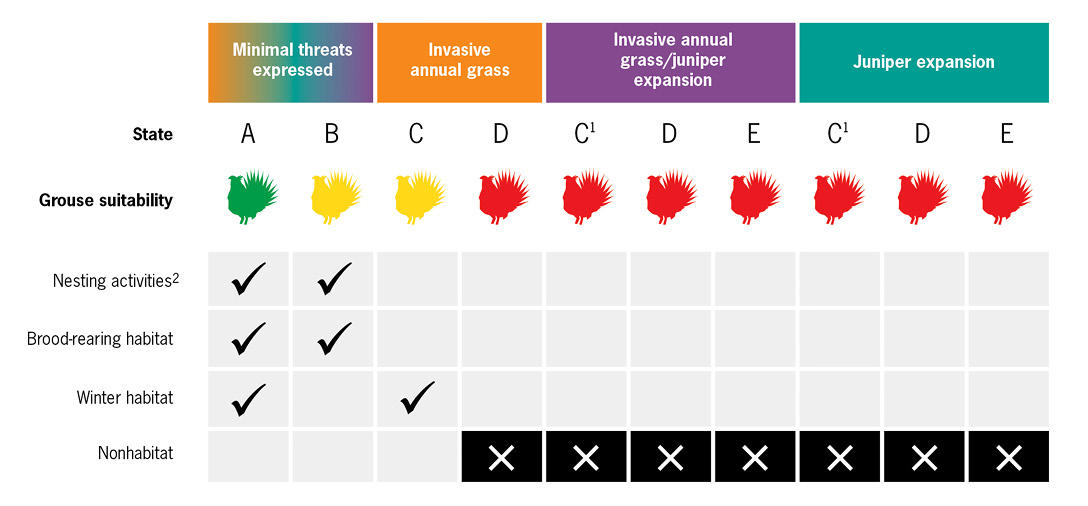
Threat-based land management does not provide an explicit assessment of sage-grouse habitat. Rather, it matches generalized sage-grouse habitat needs to states because the threats facing sage-grouse are the same as those facing the northern Great Basin sagebrush ecosystem. This connection is based on broad vegetation elements of sage-grouse habitat as characterized by Crawford et al. 2004 (Figure 14). Other factors also drive sage-grouse distribution, specifically mesic habitat availability (Donnelly et al. 2016), so state condition does not imply that sage-grouse use a site or will in the future. Instead, vegetation structure and state composition can be used to qualitatively generalize if potential seasonal or year-around sage-grouse habitat is available.
The potential that certain states can provide seasonal habitat is important, given that sage-grouse habitat requirements characteristically shift throughout the year. The annual life-history of sage-grouse is typically divided into three periods. Each period is described below to help readers understand how sage-grouse seasonal habitat needs might correspond to ecological states.
Breeding/nesting habitat
During the spring lekking period, sage-grouse use areas of low-statured vegetation (both shrubs and herbaceous) for purposes of mating display and breeding. This habitat type is rarely limited on a landscape basis. In the pre-laying period a month prior to nesting, females focus more of their diet on protein-rich forbs.
Sage-grouse typically nest under mature sagebrush. In some cases, they may nest under other shrubs or even grasses. Females rely on perennial bunchgrasses near the nest to provide screening cover from nest predators. Perennial grass height and cover will vary considerably based on both ecological site and yearly conditions. Mature sagebrush with umbrella-shaped canopies provide increased screening cover for nests, and the canopy shape also hinders other animals from grazing the screening cover underneath (France et al. 2008).
Brood-rearing habitat
Sage-grouse brood-rearing can be separated into distinct time phases. During early brood-rearing, chicks primarily eat insects, with forbs becoming a larger diet component after the first few weeks. Habitat used during this period typically has reduced sagebrush canopy cover, increased forb and perennial grass cover, and is near nesting habitat. As the growing season progresses, hens with broods move into late brood-rearing habitat rich with succulent forbs, although they do consume some sagebrush. While succulent vegetation is often associated with riparian areas, meadows, springs, or seep, broods may migrate to higher elevations, effectively following the progress of plant phenology upslope.
Winter habitat
During winter, sage-grouse feed almost exclusively on sagebrush. The importance of shrub height is contextual: On sites with deep snow, tall, mature big sagebrush is important to ensure food accessibility; on wind-swept ridges with minimal snow cover, sage-grouse use smaller-statured low sagebrush.
Matching sage-grouse habitat needs with states
Whether or not sage-grouse will actually use a site depends on many additional factors and secondary threats. That said, the states used in this framework should adequately reflect potential sage-grouse habitat availability at a site (Figure 14).
State A habitat, specifically, should provide potential habitat for sage-grouse during all seasons of the year, due to adequate sagebrush cover and robust native understory components (Figure 14). State A suitability for brood-rearing habitat depends on additional factors such as forb availability (which varies year to year) and site potential. State B habitat, given its robust native herbaceous vegetation communities, provides potential brood-rearing habitat for sage-grouse (Figure 14). State B habitat may provide marginal nesting and wintering habitat, but only if remnant or reestablishing sagebrush cover is present on the site.
State C-IAG habitat has adequate sagebrush cover and provides potential wintering habitat to sage-grouse (Figure 14). State C-IAG habitat may provide marginal nesting habitat if remnant native herbaceous vegetation exists. Sage-grouse will tolerate some invasive annual grass cover at a site (Coates et al. 2016); however, the behavioral response of sage-grouse to invasive annual grasses requires more study. State D-IAG likely provides limited or no habitat value to sage-grouse during any season, due to limited sagebrush cover and depleted native herbaceous vegetation (Figure 14).
States C, D and E under the dual and juniper expansion threats represent habitat sage-grouse will likely avoid, due to the presence of juniper (Figure 14). Without management intervention (such as juniper cutting), marginal habitat with encroaching juniper will quickly lose any remaining value as habitat.
Conclusion
Threat-based land management demonstrates the value of simplified state-and-transition models for land management at appropriate scales. Practical constraints, including budgets, personnel and time, limit which ecosystem features can be managed. Because the effect of primary ecological threats (like invasive annual grass and juniper expansion) is disproportionate compared to other threats, most land managers’ goals will require addressing primary threats first. The simple models presented here combine the urgency of primary ecological threats with the practical capabilities of management. In doing so, this framework supports the communication, collaboration and structured decision-making needed to make lasting conservation gains in the sagebrush ecosystem.
Selecting and prioritizing management actions is a difficult and context-specific process. While this manager’s guide discusses the general theory for using this framework in practice, additional resources help address other fundamental aspects and details for specific land-management issues. To support this need, the SageSHARE partnership will continue to create management case studies that discuss in detail how threat-based land management can support and improve both public and private land management. These resources and additional materials will be available online at www.SageSHARE.org.
Glossary of selected terms
(Listed in order mentioned in text)
Ecological state: States are an integral part of all state-and-transition models. In this framework, a state refers to a plant community defined by functional groups and unique combinations of ecological threats and levels of risk.
Ecological threat: Widespread and important biotic processes that compromise desirable vegetation conditions. In this region, primary ecological threats include invasive annual grasses, encroaching conifer woodlands, and their interaction with each other and with wildfire.
Apparent trend: A snapshot estimate of potential plant community change based on five factors for assessing which locations are improving, degrading, stable, or in need of additional monitoring. While a useful tool, these indicators are not a substitute for actual trend information. Apparent trend helps identify where additional monitoring might be needed.
Functional group: Biotic components of ecosystems that perform the same function or set of functions within the ecosystem.
Resistance: The ability of an ecosystem to remain unchanged in the face of disturbance.
Resilience: The ability of an ecosystem to respond to a disturbance by rapidly recovering.
Unoccupied bare ground: Bare ground that is set within a local environment of reduced perennial bunchgrass abundance relative to site potential. Lack of perennial bunchgrasses can create high resource availability that favors proliferation of invasive annual grasses and other undesired species.
Occupied bare ground: Bare ground in which most resources are fully utilized. Practitioners can assess if bare ground is likely occupied by measuring the density of large perennial bunchgrasses. The abundance of perennial bunchgrasses is reflective of a site’s potential. Relatively high bunchgrass abundance reduces resource availability and decreases probability of increases in invasive annual grasses and other undesired species.
Risk factor: A generalized event and action that could cause a state to degrade.
Conservation measure: A generalized action that could cause a state to improve.
Management action: A project-specific action prescribed to maintain or change a vegetation community attribute. Management actions are informed by generalized risk factors and associated conservation measures. They should be relevant to current state and apparent trend, and support management objectives.
References cited
Baruch-Mordo, S., J.S. Evans, J.P. Severson, D.E. Naugle, J.D. Maestas, J.M. Kiesecker, M.J. Falkowski, C.A. Hagen, and K.P. Reese. 2013. Saving sage-grouse from the trees: A proactive solution to reducing a key threat to a candidate species. Biological Conservation 167:233–241. Elsevier Ltd.
Bates, J. 2009. Herbaceous Succession After Burning of Cut Western Juniper Trees. Western North American Naturalist 69:9–25.
Bates, J.D., T. Svejcar, R.F. Miller, and R.A. Angell. 2006. The effects of precipitation timing on sagebrush steppe vegetation. Journal of Arid Environments 64:670–697.
Bestelmeyer, B.T., J.R. Brown, K.M. Havstad, R. Alexander, G. Chavez, and J.E. Herrick. 2003. Development and Use of State-and-Transition Models for Rangelands. Journal of Range Management 56:114.
Boyd, C.S., and T.J. Svejcar. 2011. The influence of plant removal on succession in Wyoming big sagebrush. Journal of Arid Environments 75:734–741.
Bureau of Land Management. n.d. Assessment, Inventory, and Monitoring: support for BLM AIM projects and programs. http://aim.landscapetoolbox.org/design/indicators-methods/.
Chambers, J.C., R.F. Miller, D.I. Board, D.A. Pyke, B.A. Roundy, J.B. Grace, E.W. Schupp, and R.J. Tausch. 2014. Resilience and Resistance of Sagebrush Ecosystems: Implications for State and Transition Models and Management Treatments. Rangeland Ecology and Management 67:440–454.
Coates, P. S., and D. J. Delehanty. 2010. Nest Predation of Greater Sage-Grouse in Relation to Microhabitat Factors and Predators. Journal of Wildlife Management 74:240–248.
Coates, P.S., M.A. Ricca, B.G. Prochazka, M.L. Brooks, K.E. Doherty, T. Kroger, E.J. Blomberg, C.A. Hagen, and M.L. Casazza. 2016. Wildfire, climate, and invasive grass interactions negatively impact an indicator species by reshaping sagebrush ecosystems. Proceedings of the National Academy of Sciences 113:12745–12750.
Crawford, J.A., R.A. Olson, N.E. West, J.C. Mosley, A. Michael, T.D. Whitson, R.F. Miller, M.A. Gregg, C.S. Boyd, S. Journal, N. Jan, J.A. Crawford, R.A. Olson, N.E. West, J.C. Mosley, M.A. Schroeder, T.O.M.D. Whitson, R.F. Miller, M.A. Gregg, and C.S. Boyd. 2004. Ecology and Management of Sage-Grouse and Sage-Grouse Habitat. Society for Range Management 57:2–19.
Davies, K.W. 2008. Medusahead Dispersal and Establishment in Sagebrush Steppe Plant Communities. Rangeland Ecology & Management 61:110–115.
Davies, K.W., C.S. Boyd, J.L. Beck, J.D. Bates, T.J. Svejcar, and M.A. Gregg. 2011. Saving the sagebrush sea: An ecosystem conservation plan for big sagebrush plant communities. Biological Conservation 144:2573–2584.
Donnelly, J.P., D.E. Naugle, C.A. Hagen, and J.D. Maestas. 2016. Public lands and private waters: Scarce mesic resources structure land tenure and sage-grouse distributions. Ecosphere 7:1–15.
Duckworth, J.C., M. Kent, and P.M. Ramsay. 2000. Plant functional types: An alternative to taxonomic plant community description in biogeography? Progress in Physical Geography 24:515–542.
France, K.A., D.C. Ganskopp, C.S. Boyd. 2008. Interspace/Undercanopy Foraging Patterns of Beef Cattle in Sagebrush Habitats. Rangeland Ecology & Management 61:389–393.
Holmes, A. L., J. D. Maestas, and D. E. Naugle. 2017. Bird responses to removal of western juniper in sagebrush-steppe. Rangeland Ecology & Management 70:87–94.
Hulet, A., C. S. Boyd, K. W. Davies, and T. J. Svejcar. 2015. Prefire (Preemptive) Management to Decrease Fire-Induced Bunchgrass Mortality and Reduce Reliance on Postfire Seeding. Rangeland Ecology & Management 68:437–444. Elsevier B.V.
James, J. J., K. W. Davies, R. L. Sheley, and Z. T. Aanderud. 2008. Linking nitrogen partitioning and species abundance to invasion resistance in the Great Basin. Oecologia 156:637–648.
Johnson, D., M. Cahill, C. Boyd, V. Schroeder, L. Foster, A. Sitz, J. Kerby, T. Svejcar, and J. Cupples. 2019. Threat-Based Land Management in the Northern Great Basin: A Field Guide. PNW 723, https://catalog.extension.oregonstate.edu/pnw723. Corvallis, OR: Oregon State University Extension Service.
Lavorel, S., S. McIntire, J. Landsberg, and T.D.A. Forbes. 1997. Plant functional classifications: from general groups to specific groups based on response to disturbance. Trends in Ecology & Evolution 5347:474–478.
Lentz, R.D., and G.H. Simonson. 1986. A detailed soils inventory and associated vegetation of Squaw Butte Range Experiment Station. Volume 760. Corvallis, OR.
MacKinnon, W.C., J.W. Karl, G.R. Toevs, J.J. Taylor, M. Karl, C.S. Spurrier, and J.E. Herrick. 2011. BLM core terrestrial indicators and methods. Tech Note 440. National Operations Center, Denver, CO.
Morghan, K.J.R., R.L. Sheley, and T.J. Svejcar. 2006. Successful Adaptive Management — The Integration of Research and Management. Rangeland Ecology & Management 59:216–219.
Mote, P.W., J.T. Abatzolglou, and K.E. Kunkel. 2013. Climate variability and change in the past and the future. p. 25–40 in Climate change in the Northwest: Implications for our landscapes, waters, and communities, M.M.M. Dalton, P.W. Mote, and A.K. Snover (ed.). Washington, D.C.: Island Press.
Pierson, F.B., J.D. Bates, T.J. Svejcar, and S.P. Hardegree. 2007. Runoff and Erosion After Cutting Western Juniper. Society for Range Management 60:285–292.
Pokorny, M.L., R.L. Sheley, T.J. Svejear, and R.E. Engel. 2004. Plant species diversity in a grassland plant community-evidence for forbs as a critical management consideration. Western North American Naturalist 64:219–230.
Polley, H.W., D.D. Briske, J.A. Morgan, K. Wolter, D.W. Bailey, and J.R. Brown. 2013. Climate change and North American rangelands: Trends, projections, and implications. Rangeland Ecology & Management 66:493–511.
Sage-Grouse Conservation Partnership. 2015. The Oregon sage-grouse action plan. Salem, OR.
Schroeder, V., and D. Johnson. 2018. Western Roots: Diving into a sagebrush sea of diversity. PNW 714, Pacific Northwest Extension, Oregon State University, University of Idaho, Washington State University.
Severson, J.P. 2016. Greater sage-grouse response to conifer encroachment and removal. PhD dissertation, University of Idaho: Moscow.
Severson, J.P., C.A. Hagen, J.D. Maestas, D.E. Naugle, J.T. Forbes, and K.P. Reese. 2017. Short-term response of sage-grouse nesting to conifer removal in the northern great basin. Rangeland Ecology & Management 70:50–58.
Stringham, T.K., W.C. Krueger, and P.L. Shaver. 2003. State and Transition Modeling: An Ecological Process Approach. Journal of Range Management 56:106.
Svejcar, T. 2015. The northern Great Basin: A region of continual change. Rangelands 37:114–118.
Svejcar, T., J. James, S. Hardegree, and R. Sheley. 2014. Incorporating Plant Mortality and Recruitment Into Rangeland Management and Assessment. Rangeland Ecology & Management 67:603–613.
Westoby, M., B. Walker, and I. Noy-Meir. 1989. Opportunistic Management for Rangelands Not at Equilibrium. Journal of Range Management 42:266.
Appendix A: Additional resources
The following resources and compiled bibliographies should be used in conjunction with this manager’s guide to provide additional background information on key concepts, and we encourage individuals to use these resources. While these do not represent an exhaustive compilation of the relevant literature, these resources should be more than adequate for filling in any background knowledge gaps.
Please see also the companion publication: Threat-Based Land Management in the Northern Great Basin: A Field Guide (PNW 723).
For a collection of robust educational resources for sagebrush landscapes, SageSTEP lists several compiled bibliographies at http://sagestep.org/ed_resources.html. Several of those bibliographies are also listed below.
Primary threats
SageSTEP Threats to Sagebrush Ecosystems
Greater Sage-grouse (Centrocercus urophasianus) Conservation Objectives: Final Report
Saving the sagebrush sea: An ecosystem conservation plan for big sagebrush plant communities
Invasive annual grasses
SageSTEP cheatgrass bibliography
Ecologically Based Invasive Plant Management
Field Guide for Managing Cheatgrass in the Southwest
Conifers
SageSTEP pinyon and Juniper woodlands bibliography
Western Juniper Field Guide: Asking the Right Questions to Select Appropriate Management Actions
Biology, Ecology, and Management of Western Juniper
Wildfire
Great Basin ecology
SageSTEP Great Basin bibliography
Wildlife in sagebrush ecosystems
SageSTEP wildlife in sagebrush ecosystems bibliography
BLM Greater Sage-grouse bibliography
USFWS Greater Sage-grouse Review
USGS Greater Sage-Grouse: ecology and conservation of a landscape species and its habitats
Science Framework for Conservation and Restoration of the Sagebrush Biome
State and transition modelling in rangelands
How Rangelands Change Through Time (State and Transition Models) Collection of Relevant Research
Greater sage-grouse habitat assessment framework
https://www.fs.fed.us/sites/default/files/sage-grouse-habitat-assessmen…
BLM assessment, inventory and monitoring
http://aim.landscapetoolbox.org/
Resistance and resilience
Science Framework for Conservation and Restoration of the Sagebrush Biome
Ecological site resources
What are Ecological Site Descriptions (ESDs)?
Ecological site information system
Rangeland monitoring
Nevada Rangeland Monitoring handbook
Sagebrush ecosystem plant functional ecology
SageSTEP Sagebrush Ecosystems and Restoration bibliography
Plant succession and novel plant communities
Oxford Bibliography of Succession
Climate-related range shifts — a global multidimensional synthesis and new research directions
Land management and objective setting
Management and conservation practices
Sage-grouse Conservation: Linking Practices to Habitat Metrics
See appendices of the above report for a list of collected works on each of the topics below
- Rangeland fuels/fire risk management (pages 110–113)
- Grazing management (pages 117–119)
- Seeding treatment (pages 124–128)
- Mechanical treatments (conifer management, shrub reduction, invasive management and wildlife habitat improvement) (pages 135–137)
- Invasive annual grass management: herbicide treatment (pages 141–142)
Appendix B: Threat-based land management field documentation form
See the supplemental PDF provided above
© 2019 Oregon State University.
Published and distributed in furtherance of the Acts of Congress of May 8 and June 30, 1914, by the Oregon State University Extension Service, Washington State University Extension, University of Idaho Extension, and the U.S. Department of Agriculture cooperating. The three participating Extension services offer educational programs, activities, and materials without discrimination on the basis of race, color, national origin, religion, sex, gender identity (including gender expression), sexual orientation, disability, age, marital status, familial/parental status, income derived from a public assistance program, political beliefs, genetic information, veteran’s status, reprisal or retaliation for prior civil rights activity. (Not all prohibited bases apply to all programs.) The Oregon State University Extension Service, Washington State University Extension, and University of Idaho Extension are an AA/EOE/Veterans/Disabled.
About the authors


Related publications
© 2019 Published and distributed in furtherance of the Acts of Congress of May 8 and June 30, 1914, by the Oregon State University Extension Service, Washington State University Extension, University of Idaho Extension and the U.S. Department of Agriculture cooperating. The three participating Extension services offer educational programs, activities and materials without discrimination on the basis of race, color, national origin, religion, sex, gender identity (including gender expression), sexual orientation, disability, age, marital status, familial/ parental status, income derived from a public assistance program, political beliefs, genetic information, veteran’s status, reprisal or retaliation for prior civil rights activity. (Not all prohibited bases apply to all programs.)