Introduction
Forage-based industries are essential to food supply and local economies across the Pacific Northwest. Wheel lines are commonly used to irrigate forages in the Pacific Northwest. A substantial decline in snowpack levels in the western United States will force many agricultural irrigators to work with a less-than-ideal water supply and use water-efficient strategies to maintain satisfactory production levels. Aside from the water shortage, irrigators should consider how mismanaged irrigation can reduce profits. Every gallon of water pumped results in higher energy bills. Mismanaged irrigation is also likely to prevent crops from reaching their optimal yields, encourage nutrient leaching and runoff, and lead to a less-than-optimal cost-to-return ratio. Managing water resources efficiently greatly benefits irrigators and other community water users.
Wheel lines consist of moveable irrigation systems, usually stationary for 12- or 24-hour sets. These systems have unique management challenges. It can take several days to water an entire field. Irrigators must consider the rate at which moisture is depleted from the soil and the rate at which the wheel line applies water across the field. These considerations determine optimal irrigation set times, how many wheel lines are needed to adequately irrigate a field, and an irrigation schedule throughout the growing season. This publication provides step-by-step guidance to help irrigators design an irrigation program tailored to their scenario, as well as other general tips for enhancing wheel-line irrigation efficiency.
Irrigation application rate: step-by-step calculations
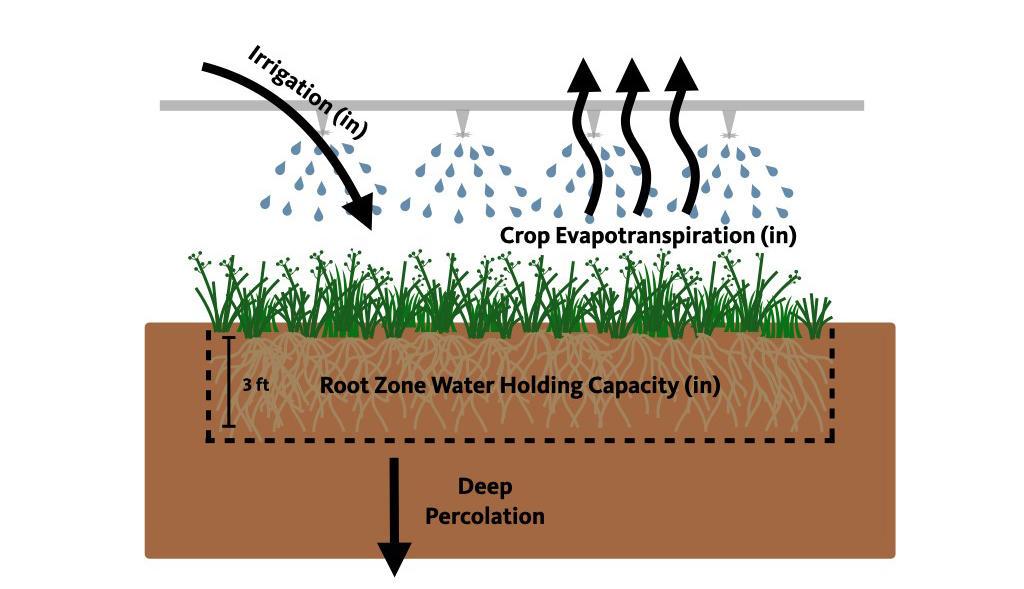
Each irrigation event should apply enough water to prevent crop water stress until the next irrigation event while minimizing water loss through deep percolation. In other words, irrigators must maintain soil moisture levels between maximum allowable depletion (MAD) and field capacity (FC).
To do this:
Step 1. Determine the rate at which your wheel line can apply water (measured in inches per hour or inches per set).
Step 2. Determine how many inches of water the soil can hold in the rooting depth of the forage crop (soil water holding capacity, or SWHC).
Step 3. Determine how much water (measured in inches per day) is pulled out of the soil (transpired) each day by the forage crop based on values from a nearby AgriMet weather station.
Step 1: Determine the rate at which your wheel line can apply water
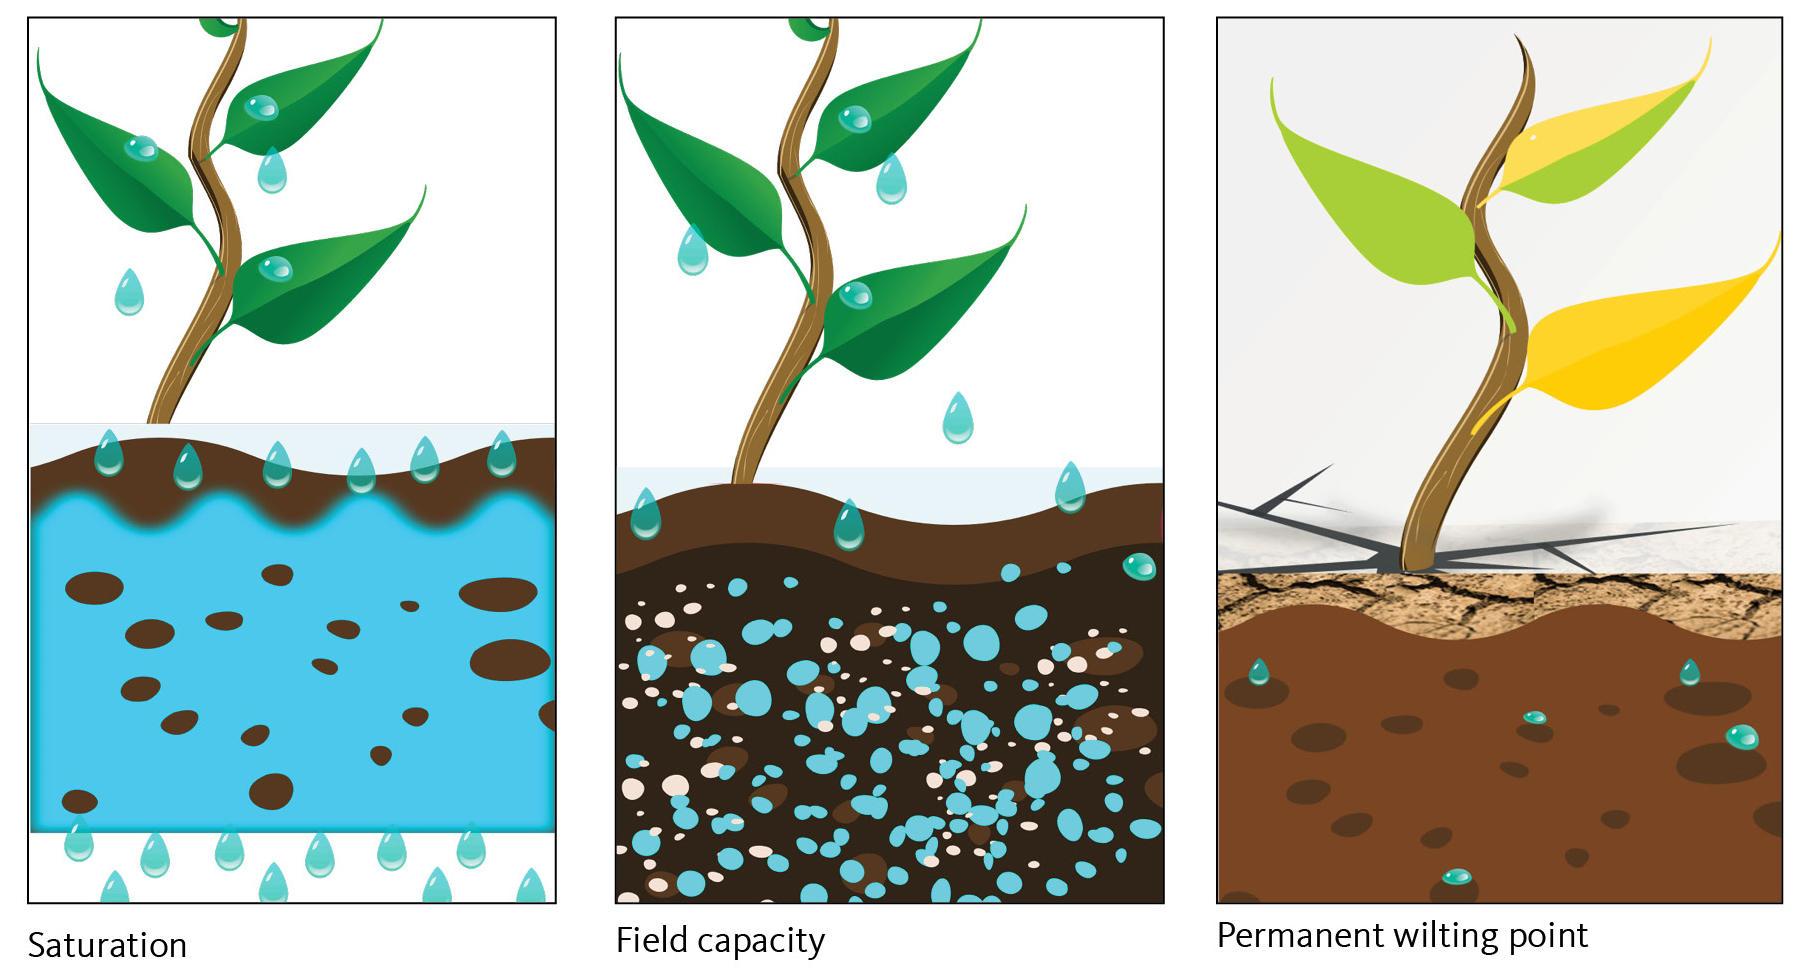
1A: Calculate the amount of water (in gallons) applied per irrigation set: Fixed run times for wheel lines are typically 12 or 24 hours. The goal in selecting a run time is to time your wheel-line positioning so that the amount of water the soil profile can hold is similar to what your irrigation system can apply in a 12- or 24-hour set. In other words, the goal is to reach field capacity in a fixed irrigation time. Field capacity occurs when the soil holds as much moisture as it can after drainage ceases following an irrigation or rainfall event. If the sprinklers on a wheel line apply water at a rate of 6 gallons per minute (GPM), the amount of water leaving the sprinklers for a 12- and 24-hour set can be calculated:
Sprinkler water application rate in GPM x minutes in an hour = gallons applied in an hour per sprinkler
6 GPM x 60 minutes/hour = 360 gallons applied per hour per sprinkler
360 gallons/hour x 12 hours = 4,320 gallons applied per sprinkler in a 12-hour set
360 gallons/hour x 24 hours = 8,640 gallons applied per sprinkler in a 24-hour set

1B: Determine how much water is being applied, considering wheel-line inefficiencies: Given the nature of wheel-line sprinklers, water droplets spend a considerable amount of time in the air after leaving the sprinkler. Water droplets suspended in the air are susceptible to evaporation and wind drift. It has been estimated that wheel-line irrigation system efficiency is between 60% to 75%, with 70% generally used as a season-long average. This means that only 70% of the water leaving the sprinkler of the wheel line is making it to the ground. Therefore, only 3,024 gallons of water are efficiently applied with a 12-hour set, and 6,048 gallons of water are efficiently applied with a 24-hour set, using the previous example with sprinklers that run at 6 GPM.
1C: Convert the total amount of water applied (in gallons) to inches by considering the area where sprinklers apply water: If risers from the main line are 48 feet apart, then the wheel line is responsible for irrigating 24 feet on both sides of the wheel line at any given position. If sprinklers on the wheel line are 30 feet apart, each sprinkler would be responsible for irrigating 15 feet on either side of the sprinkler laterally along the wheel line. The area the wheel line is responsible for irrigating can be calculated by:
Sprinkler application area = length x width
(15 feet + 15 feet)(24 feet + 24 feet)
(30 feet)(48 feet)
30 feet x 48 feet = 1,440 square feet
The area an individual wheel-line sprinkler is responsible for applying water to is 1,440 square feet. Since there are 144 square inches in a square foot, one wheel-line sprinkler applies water to 207,360 square inches. Since a gallon of water is 231 cubic inches of water, it would take 898 gallons of water to apply 1 inch of water to this area.
This means that in a 12-hour set, considering the previous example, an individual sprinkler applies 3.4 inches of water to the ground and 6.8 inches in a 24-hour set.
Another option for determining wheel-line application rates is a direct measurement using catch cans (Figure 2). This approach requires a few empty cans and a ruler. Place several straight-walled cans (empty soup, tuna or coffee cans work well; select one type) underneath your wheel line, with the cans centered between two sprinklers. Ensure the cans are level and the crop canopy will not intercept the irrigation water. Back the wheel line up to the previous riser and run the system for an hour. Move the wheel line back over the catch cans and run the system in that position for another hour. Finally, move the wheel line to one riser beyond the catch cans and run for a third hour. Now measure the water depth per can and find the average depth. Multiply this average application rate by your set time to determine inches of irrigation application.

A local Natural Resource Conservation Service or Soil and Water Conservation District office can help determine your wheel line’s application rate.
Step 2: Determine how much water the soil can hold within the rooting depth of forages (soil water-holding capacity, or SWHC)
The effective rooting depth for most established perennial forage grasses is approximately 3 feet. However, alfalfa is a noteworthy outlier, with rooting depth often exceeding 5 feet. Sometimes, if the soil is shallow or a hardpan is present, the rooting depth might be less than 3 feet. For this article, a 3-foot rooting depth is used, but beware of the various parameters in your pasture or hayfield that warrant using a number more or less than 3 for your own irrigation calculations. To find out where the bulk of the crop roots are, dig a hole using a backhoe or shovel and see how deep most of your forage roots extend into the soil.
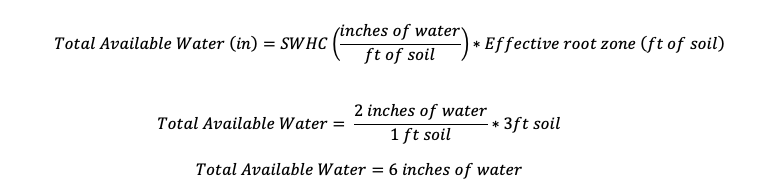
2A: Determine the total available water in your soil: Soil texture — the proportion of sand, silt and clay — determines how much water your soil can hold (Table 1). Larger soil particles, like sand, have less surface area on which water can cling than silt and clay. For this example, we assume the soil is sandy loam holding roughly 2 inches of water per foot of soil. If we have a rooting depth of 3 feet, and the soil can hold 2 inches per foot of soil depth, then we can calculate how much water the soil can hold for forage roots to access.
| п»їTable 1. Average water holding capacity per 1 foot of root zone depth (assuming uniform soil properties throughout the profile. | |
|---|---|
| Soil type | Average soil water holding capacity (inches/foot) |
| Sand | 1 |
| Sandy loam | 1.8 |
| Silt loam | 2.2–2.5 |
| Clay | 2.2 |
Source: Pasture and Grazing Management in the Northwest (PNW 614).
2B: Determine the Maximum Allowable Depletion (MAD): Not all the water in the soil profile is available to plant roots for absorption. A portion of water is so tightly held by the soil that crop plants can’t use it without slowing growth. Generally, when soil water content drops below 50% of capacity, forages have difficulty taking up the remaining water. Growth slows and yields drop. The point at which roots can no longer draw water from the soil profile is referred to as the permanent wilting point. Maximum allowable depletion is the maximum amount of moisture the soil can lose without affecting growth or yield. In forages, 50% MAD is generally used to avoid water stress. Since the 3 feet of fine sandy loam soil can hold 6 inches of water, the maximum allowable depletion in this scenario would be 3 inches. AgriMet evapotranspiration data can be used to ensure that soil water depletion does not exceed 3 inches between irrigation events. Use a soil map to determine your soil’s texture. The NRCS Web Soil Survey can determine the water-holding capacity of soils on your farm or ranch.
Step 3: Use AgriMet crop water-use data to determine when your crop needs irrigation. This information can also help determine set times or if you need to buy another wheel line, etc.
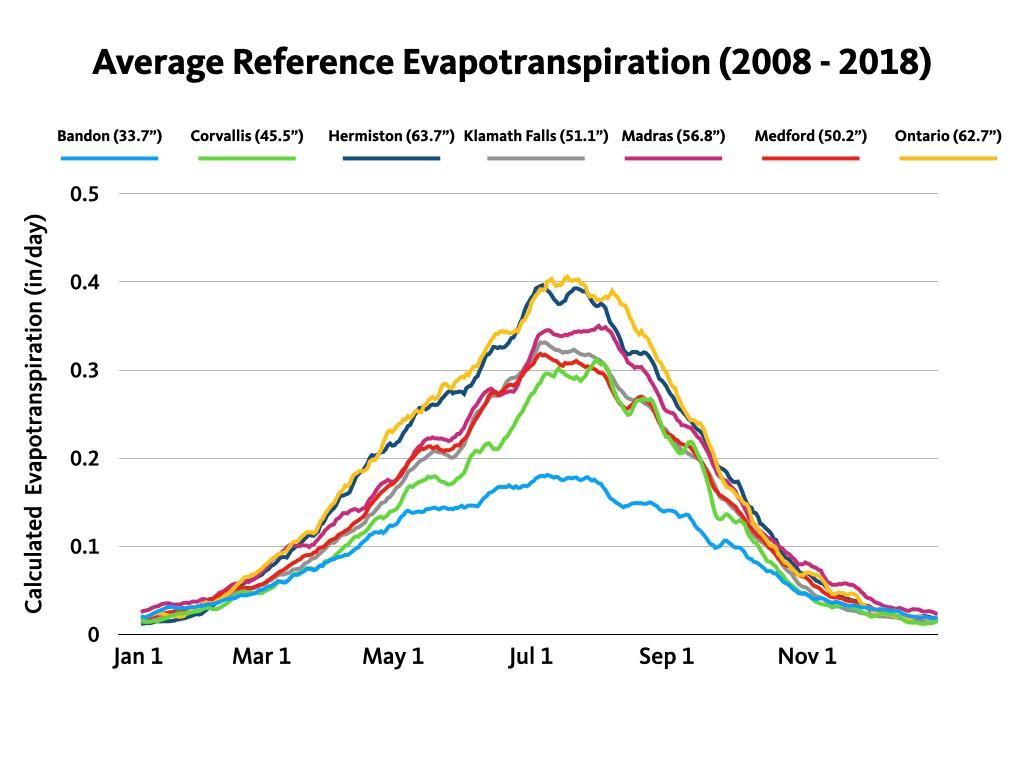
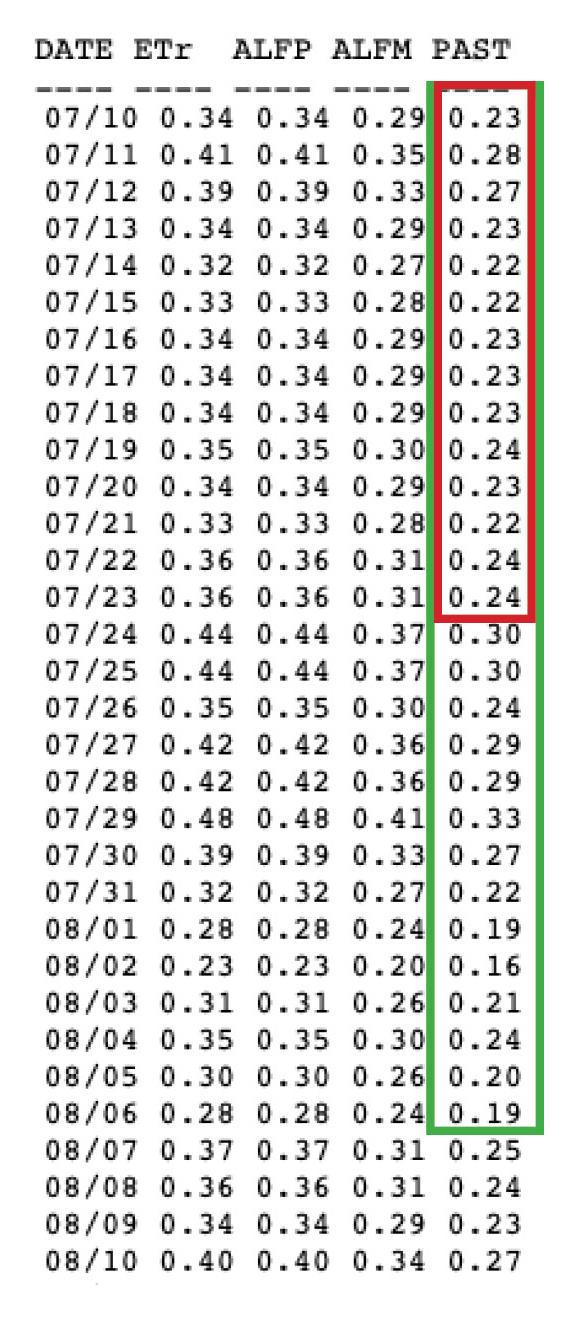
Evapotranspiration measures water losses through evaporation from the soil and plant surfaces and the transpiration of the plants. Evapotranspiration varies from place to place and day to day depending on the amount of solar radiation, temperature, humidity, wind speed and other weather and management factors. Figure 4 shows a screenshot of the reference evapotranspiration (ETr) and crop evapotranspiration estimates for pastures (ETc; PAST) obtained from an AgriMet station in Klamath Falls, Oregon. For pasture or forage managers, this crop evapotranspiration number would be the preferred data for practical applications. The red square highlights the daily crop evapotranspiration for 14 days (period of July 10 to July 23), which adds up to 3.31 inches, close to the 3.4 inches that can be applied in a 12-hour set from our previous example. This means that for 12-hour irrigation sets, one wheel line would be needed for every 14 risers because this is how long it takes for the amount of water that can be applied in 12 hours to transpire from the soil following an irrigation event. The green box in Figure 4 shows daily evapotranspiration for 28 days (period from July 10 to Aug. 6), which adds up to 6.74 inches, which is close to the 6.8 inches that can be applied in a 24-hour set from our previous example. This means that for 24-hour irrigation sets, one wheel line would be needed for every 28 risers.
Considering the example in steps 1 and 2, 12-hour sets would be preferable. Twelve-hour sets would prevent soil moisture from decreasing below the maximum allowable depletion. Soils with higher water-holding capacities may warrant 24-hour sets. If 24-hour sets are preferable, consider replacing nozzles with ones with a slower application rate, such as 3 GPM. A longer set time could be used to save on labor.
Given the choice between more frequent, shorter irrigation sets versus less frequent, longer irrigation sets, the less frequent irrigation sets would offer additional water savings. For every individual irrigation event, around 0.1 in of water is lost through evaporation from the forage canopy and never infiltrates the soil.
Historical AgriMet crop evapotranspiration rates (ETc) reveal the maximum daily pasture ETc rates during July and August, usually the months with peak evaporative demand. In Klamath Falls, ETc rates as high as 0.3 inches per day have been recorded. If the wheel line can only apply 3.4 inches in a 12-hour set, that would cover 11 days of 0.3 inches of daily ETc. This means that one wheel line would be needed for every 11 risers to prepare for several days of peak ETc. Different sprinkler nozzle sizes might apply more or less water in a set such that the water applied is closer to the maximum recommended depletion.
Soil moisture sensors can help set an irrigation schedule. Place a sensor at the bottom of the rooting zone, then turn on the irrigation and time how long it takes for a soil moisture reading. This would perhaps give you a better idea of how long your irrigation sets should be with your specific soil. Also, this would tell you what your soil moisture sensor reading looks like at field capacity, which can be split in half to determine your maximum allowable depletion.
Management considerations to promote efficiency
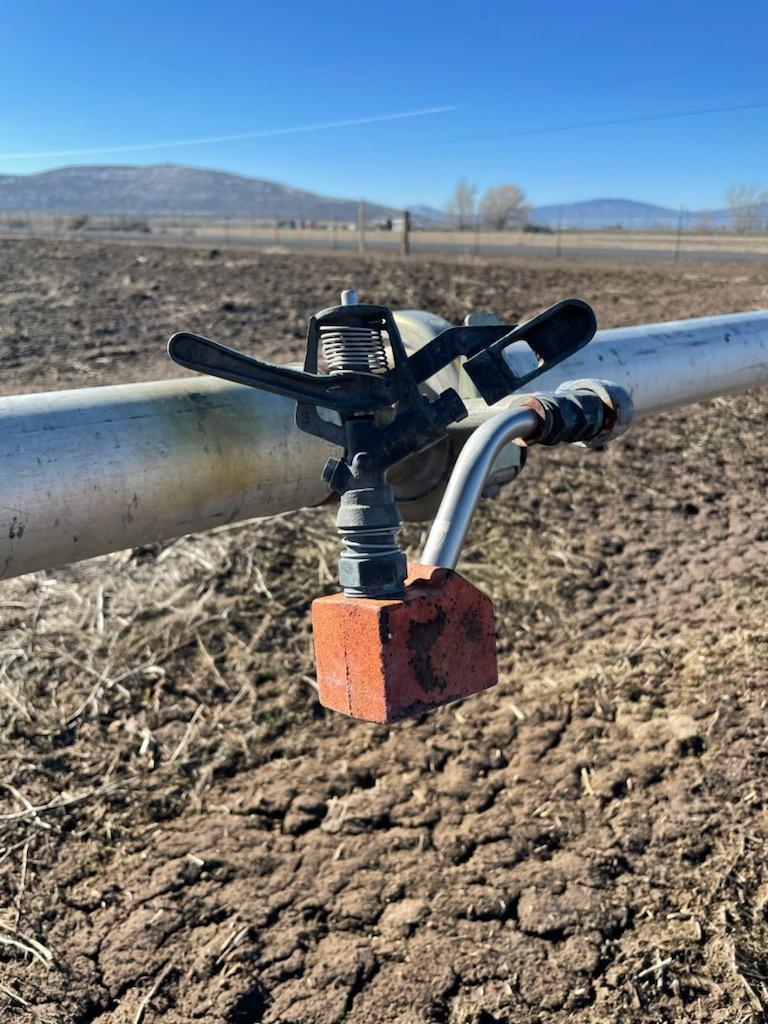
Aside from tracking soil moisture depletion and properly timing irrigation events, ensuring application uniformity is another important consideration. In underirrigated areas, crop growth is limited and can lead to an accumulation of nitrates. However, trying to irrigate the underirrigated areas to a point of satisfactory production means that the other parts of the field are being excessively irrigated, which may result in nutrient leaching below the root zone and a higher potential for disease. Make sure the sprinklers are as level as possible. It may be worth buying sprinkler levelers (Figure 5).
Insufficient uniformity can become visually apparent (Figure 6). However, evaluating your system for uniform water application at the beginning of the growing season and in between cuttings could help improve crop water use efficiency, improve forage quality and reduce the visual evidence of non-uniform irrigation applications.
You can also use a grid of straight-walled cans to measure water application uniformity. The distance between catch cans within this grid should be no more than 10% of the water application radius of the sprinklers. (If sprinklers throw water 50 feet, the catch can distance should be equal to or less than 5 feet.) Run the wheel line for an hour at the riser before the catch cans, then run the wheel line directly over the catch cans for an hour, then run the wheel line for an hour at the riser after the catch cans. Measure the water depth (for example, using a graduated cylinder or a ruler) in each catch can and compare those measurements across catch cans to identify differences that may indicate insufficient uniformity.

The publication Determining the Application Uniformity of an Irrigation System discusses some calculations that allow the irrigator to quantify uniformity. When using Christiansen’s Coefficient of Uniformity (discussed in the aforementioned publication), coefficient values less than 83% indicate poor uniformity.
The uniformity of wheel-line applications is affected by the patterns for moving wheel lines across a field. There are three general patterns for moving wheel lines across a field: TAXI, WIPE and SKIP (Figure 7). These patterns also involve human factors and labor constraints that might reduce optimal irrigation scheduling.
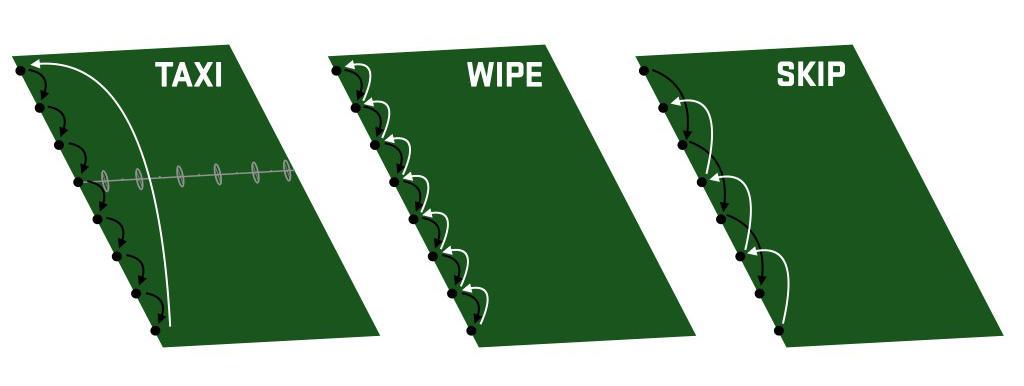
The TAXI pattern involves irrigating at each riser down the field's length and then transporting (like a taxi) the line back to its original position before starting another irrigation cycle. The TAXI pattern is the best choice for water application uniformity. However, it requires more labor on the day the line has to be moved back to its starting position. The TAXI pattern is recommended when irrigators want to optimize water use and maximize forage production.
The WIPE pattern involves irrigating at each riser in one direction down the field and then returning to each riser in the opposite direction. The WIPE pattern saves on labor but produces poor water distribution uniformity and variable return intervals. It is not recommended because some parts of the field will always be over-watered while others will be water stressed. This may result in nutrient leaching and in reductions in growth and yield.
The SKIP pattern involves irrigating at every other riser down one direction of the field, then irrigating at the risers that were skipped in the opposite direction down the field. The SKIP pattern involves a similar level of labor as WIPE and would appear to provide better water application uniformity. The SKIP pattern can offer an acceptable compromise between TAXI and WIPE, allowing for better soil moisture depletion and making over-irrigation less likely while reducing the need for the long return trip associated with the TAXI pattern. However, many growers have had poor experiences with the SKIP pattern, as variable winds from day to day can affect uniformity.
When the irrigation water supply is scarce, ensure you manage your wheel line efficiently. These suggestions can help you maximize forage production while ensuring optimal water use.
Resources
Bureau of Reclamation. 2022. Agrimet Pacific Northwest Region.
Mote, P. W., S. Li, D.P. Lettenmaier, M. Xiao and R. Engel. 2018. Dramatic declines in snowpack in the western US. Npj Climate and Atmospheric Science, 1(1), 1-6.
Neibling, H. 1997. Irrigation systems for Idaho agriculture. University of Idaho, College of Agriculture, Cooperative Extension System, Agricultural Experiment Station.
Pickrell, J.A., F.W. Oehm and S.R. Hickman. 1991. Drought increases forage nitrate and cyanide. Veterinary and human toxicology, 33(3), 247-251.
Regan, R. Practical Nursery Irrigation Workshop: Determining the Application Uniformity of an Irrigation System.
Shewmaker, G.E. and M.G. Bohle. 2010. Pasture and Grazing Management in the Northwest (PNW 614). Pacific Northwest Extension.
U.S. Department of Agriculture. 2020 State Agriculture Overview – Idaho. Retrieved Feb. 8, 2022.
U.S. Department of Agriculture. 2020 State Agriculture Overview – Oregon. Retrieved Feb. 8, 2022.
U.S. Department of Agriculture. 2020 State Agriculture Overview – Washington. Retrieved Feb. 8, 2022.
USDA Natural Resources Conservation Service. 2022. Web Soil Survey.
Appendix A
Step 1: Determine the rate at which your wheel line can apply water
1A: Determine the individual sprinkler water application rate at which your wheel line can apply water based on your hour sets (12 or 24 hours)
Sprinkler flow rate of 6 GPM x 60 minutes in an hour
= 360 gallons applied per hour, per sprinkler
360 GPH x 12 hours = 4,320 gallons applied per sprinkler in a 12-hour set
360 GPH x 24 hours = 8,640 gallons applied per sprinkler in a 24-hour set
1B: Determine how much water actually reaches the soil. Wheel lines are roughly 70% efficient.
4,320 gallons x 0.7 = 3,024 gallons applied in a 12-hour set
8,640 gal x 0.7 = 6,048 gallons applied in a 24-hour set
1C: Convert gallons of water applied to inches of water applied.
Find the area for each sprinkler. We assume that the water leaving each sprinkler’s area is equivalent to the water entering from the neighboring sprinkler or in a following or previous set.
Sprinkler application area = length x width
(15 feet + 15 feet)(24 feet + 24 feet)
(30 feet)(48 feet)
30 feet x 48 feet = 1,440 square feet
The sprinkler in this scenario covers 1,440 square feet
Convert to inches
1 foot = 12 inches
12 inches x 12 inches = 144 square inches (in2) in 1 square foot (ft2)
144 in2/ft2 x 1,440 ft2 = 207,360 in2
This sprinkler applies water to 207,360 square inches.
The volume of a gallon of water is 231 cubic inches (in3).
207,360 in2 ÷ 231 in3/gal = 898 gal/in
It would take 898 gallons to apply 1 inch of water with this sprinkler.
3,024 gal ÷ 898 gal/in = 3.4 inches of water applied in 12-hour set
6,048 gal ÷ 898 gal/in = 6.8 inches of water applied in 24-hour set
Step 2:
2A: Determine how much water the soil can hold within the rooting depth of forages.
Soil rooting depth = 3 feet
Water holding capacity of fine sandy loam = 2 inches per foot

2B: Determine the ‘maximum allowable depletion’ to avoid permanent wilting point.
6 inches of water x 0.5 = 3 inches
Step 3: Track Agrimet to determine proper set times and if another wheel line may be needed to ensure the proper irrigation of forages
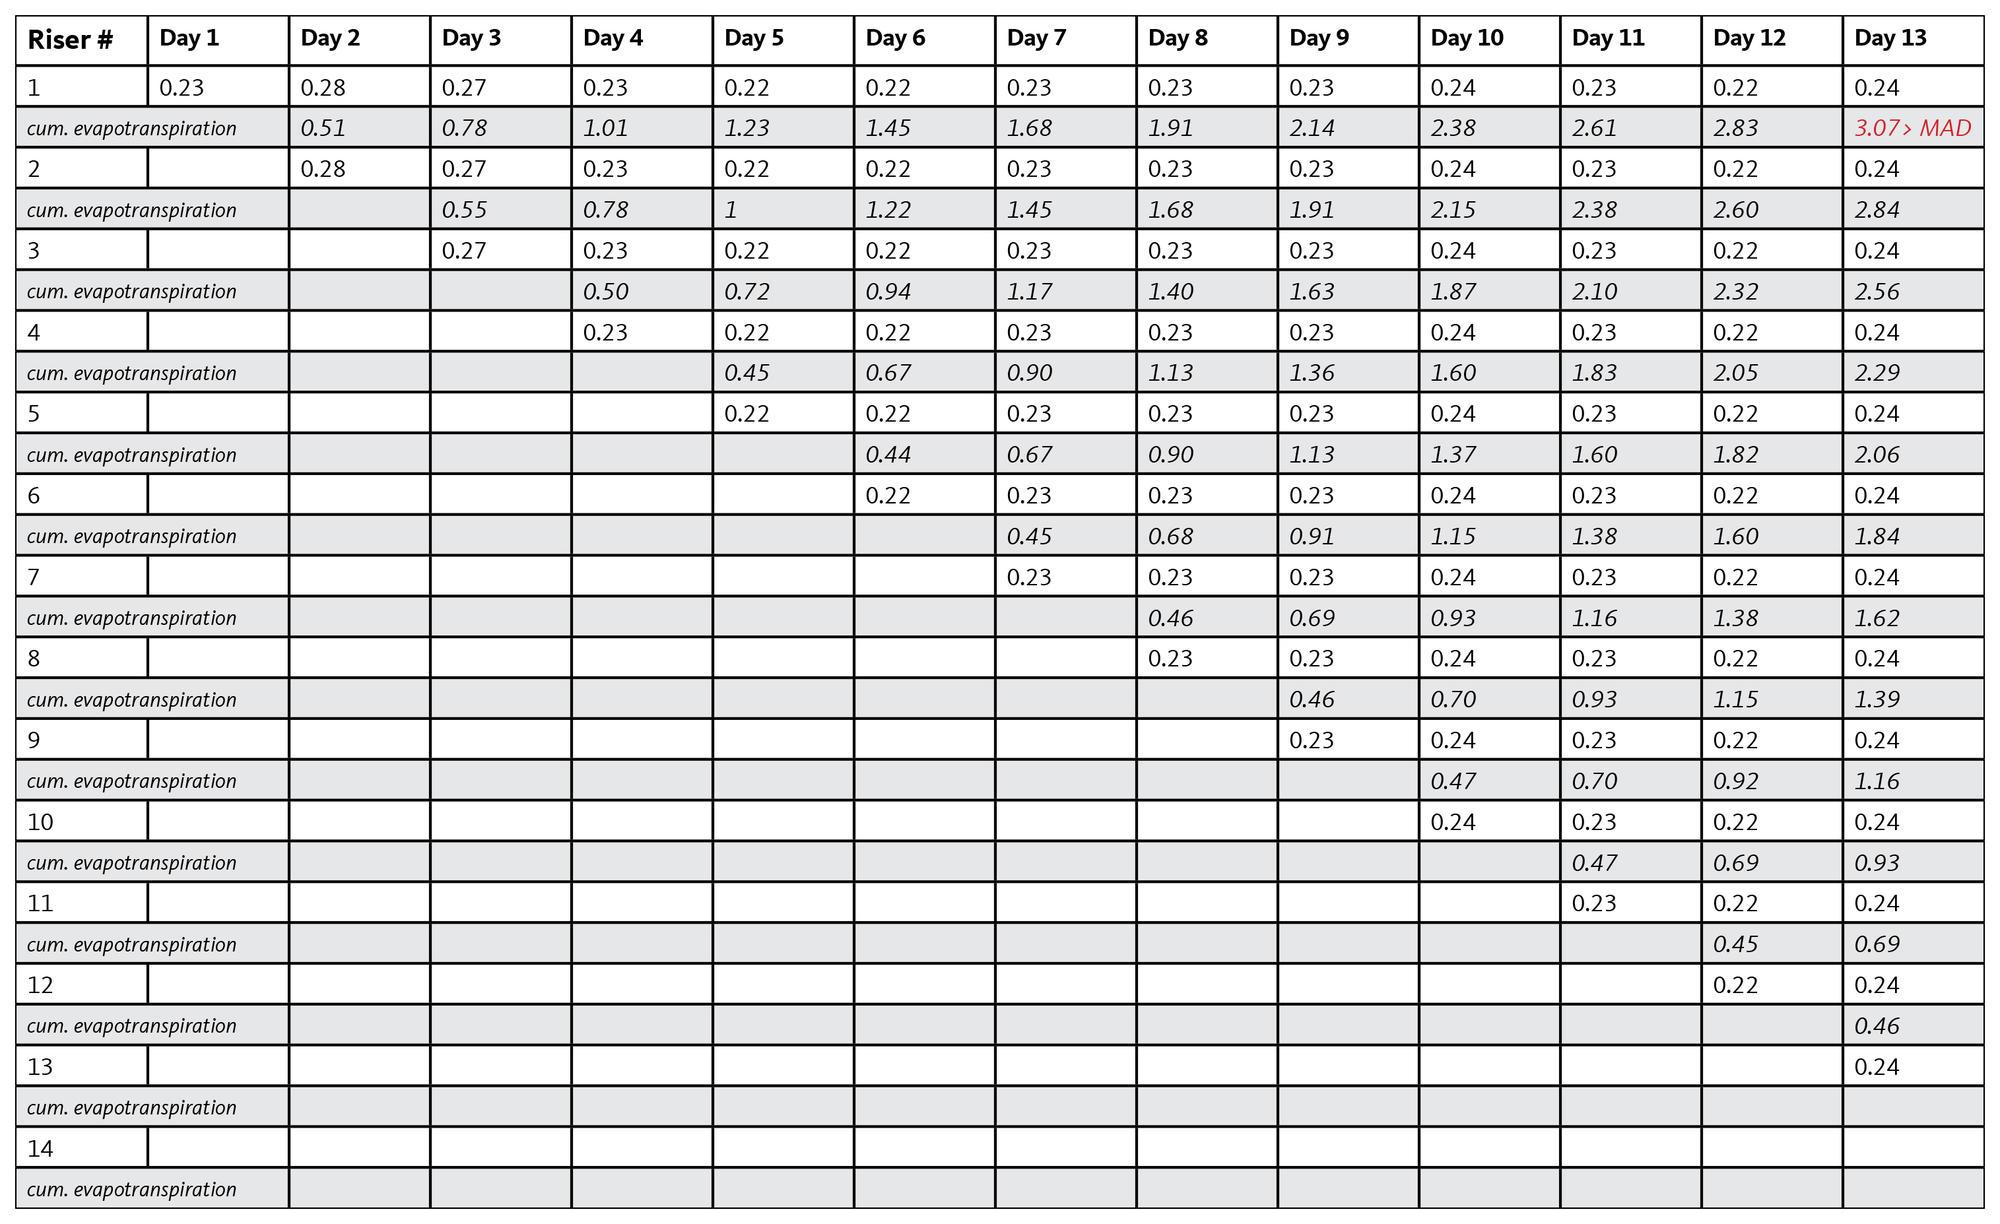
With the maximum allowable depletion set at 3 inches, we only want to allow 3 inches of water to become depleted from the soil. We then can apply just over 3 inches in a 12-hour set. Calculations start with the soil being saturated, and subtract daily Agrimet evapotranspiration rates from there. Use Figure 4 from Step 3 of the article.
The table below represents a field being irrigated by a wheel line, stopping to irrigate at each riser. Once the wheel line moves to the next riser, the irrigated area is at field capacity, and evapotranspiration begins. These numbers are found in the Agrimet data listed in Figure 4 from the main article. Once the cumulative evapotranspiration number reaches the predetermined value for maximum allowable depletion, the wheel line must return to this riser to irrigate before the forage in that area experiences drought stress. In this example, the maximum allowable depletion was reached after 13 days.