Contents
- 2016 Oregon sweet cherry production statistics
- Methods
- Results
- Percent acreage infested and treated, by pest
- Costs of pesticide application by pest species
- Costs of other pest management activities
- Pesticide use
- Overall economic impacts
- Discussion
- References
- Appendix 1. Equations
- Appendix 2. Survey question outline

This report presents data from the Oregon State University’s Crop Pest Losses Impact Assessment program: a collaboration among Oregon State University’s Oregon IPM Center, the University of Arizona’s Arizona Pest Management Center, the USDA Western IPM Center and industry partners. The program facilitates the collection of real-world data on the impacts of insects, diseases, weeds and other pests on key crops in a crop production season.
Improving our understanding of crop yield losses and their contributing factors is critical to improving agricultural production and increasing food security. Currently, quantitative data on pest impacts are very limited, and estimating crop loss data is challenging. However, quantifiable measurements of pest pressure, pesticide use, costs, and yield and quality losses due to pests are our most objective tools for assessing the status of and trends in the uptake of integrated pest management. These data are also valuable in supporting IPM evaluation and needs assessment, in priority setting and education, and for informing federal decision-making, including the US Environmental Protection Agency’s pesticide registration and review process. In particular, assessments of crop losses that occur despite all of the crop protection strategies deployed are critical for identifying needs and for improving pest management decision-making.
Based on multidisciplinary expertise and incorporating survey methods developed over decades in Arizona, we have designed and delivered a detailed survey. This instrument aims to capture information from commodity group pest managers (generally crop consultants) regarding the impacts of pests, including yield losses and pest management costs, across a number of key commodities in the Pacific Northwest. We hope that these data can be used to inform crop-specific pest management decision-making and IPM advances, especially when collected regularly over time.
This report summarizes the data that we collected for Oregon sweet cherries. It is targeted at sweet cherry researchers, Extension workers and crop consultants, and others who have an interest in crop losses and in the development and deployment of IPM.
2016 Oregon sweet cherry production statistics
According to the National Agricultural Statistics Service, Oregon accounted for 17.7% of fresh market sweet cherry production in the United States in 2016. The 13,000 acres bearing sweet cherries in Oregon generated $68.8 million in revenue for the state’s growers in 2016. The average yield that year was 4.78 tons/acre, with a value of $1,670/ton, or $0.83/lb.
Methods
Materials
The data used in this report are based on a survey that was conducted in January 2017 with crop consultants reporting on 2016 sweet cherry production. Data for this report were generated through a web-based survey, modeled after the Arizona Cotton Insect Losses survey. Respondents completed the surveys at an in-person group session where they entered information online via a weblink. Respondents took approximately two hours to complete the survey. Survey responses were downloaded into a database, from which results were analyzed.
The survey was divided into multiple sections relating to both pests and pest management. In the first section of the survey, respondents estimated the price they received per pound of sweet cherries, their actual yields in pounds and their maximum attainable yields. This initial estimate provided a measure of overall yield loss (the difference between the reported actual yield vs. the maximum attainable yield), which respondents were then asked to attribute to various factors, both biotic and abiotic.
In subsequent parts of the survey, respondents further refined these yield loss estimates for specific pests, along with pest-by-pest information on acreage where the pest was present. Respondents chose specific pests from a predetermined list of pests and were given the option to write in pests not on the list. They also approximated costs of management. Finally, respondents estimated pesticide usage by active ingredient (acreage, number of applications and costs), as well as utilization and costs of nonchemical management methods. See Appendix 2 for a more detailed outline of survey questions.
Respondents
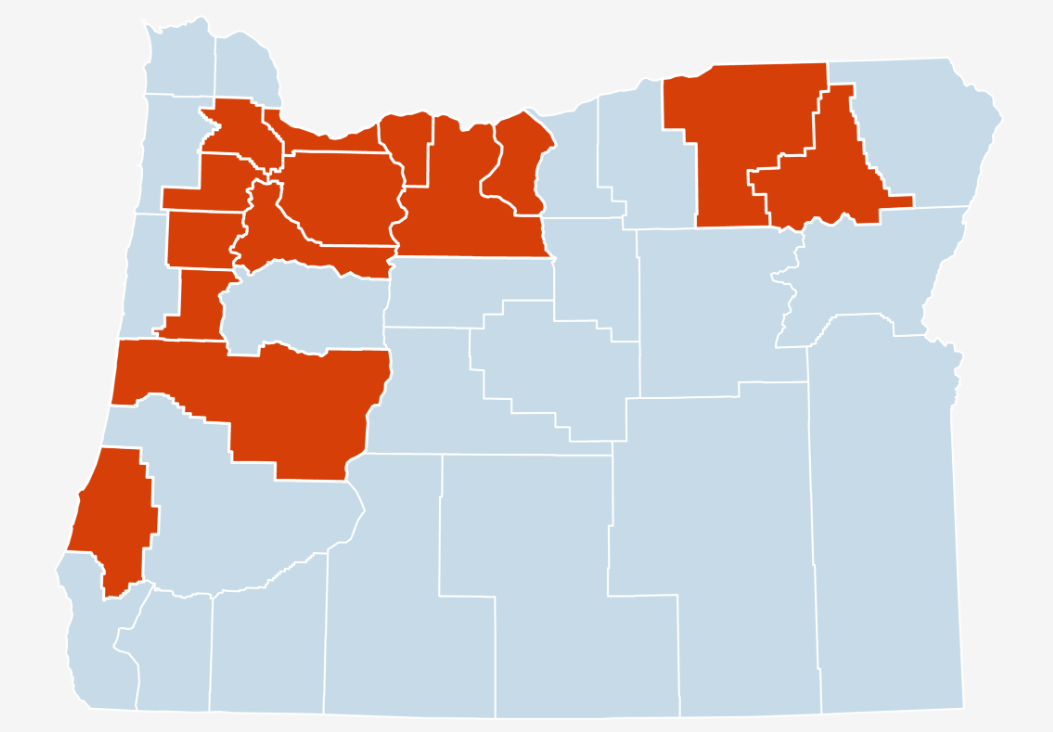
The survey was completed by six sweet cherry crop consultants in January of 2017, reporting on the 2016 season. Their roles in crop production ranged from advising on pest management to managing and gaining profit from the represented acres. All respondents were volunteers, recruited with the help of the local grower associations and Oregon State University faculty. The respondents reported on a total of 6,950 acres, which represented approximately 53% of the sweet cherry-bearing acres in Oregon at the time. The share of total survey acreage under an individual respondent’s management ranged from 5% to 35% of the 6,950 surveyed acres. The acreage covered in this report only covers conventionally grown sweet cherries. No organic production is covered in this report.
Design
This survey is descriptive research that seeks to understand and quantitatively describe the impacts of pests and their management on sweet cherry production in Oregon. It is also intended to be part of a sequence of surveys, conducted at regular intervals, that can reveal trends and responses to change over time.
Analysis
Respondent data were analyzed using specific formulae depending on the type of information collected. These formulae are detailed in Appendix 1. While many possible analyses could be performed on the data, we focused on those that help shed light on the general impacts of pests and their management: the impacts and value of yield losses and the costs of management in as much detail as possible.
Results
I. Crop yield losses
Actual yield, maximum attainable yield and price
In the first part of the survey, respondents were asked to estimate the average price received per pound of sweet cherries and the average actual yield from their managed acreage. They were also asked to estimate the “maximum attainable yield” per acre by estimating the highest possible yield. This assumes ideal growing conditions and no pest pressure within the general constraints of varieties grown, weather and local geography.
Table 1. Average price received per pound of sweet cherry per acre, mean actual yield in pounds per acre and mean maximum attainable yield in pounds per acre.
Price: $0.55/lb
Actual yield: 8,593 lb/acre
Maximum attainable yield: 12,772 lb/acre
Actual yield and maximum attainable yield are expressed as weighted averages (Equation 2, Appendix 1). Data based on estimations from six sweet cherry IPM consultants representing 6,950 acres, or 53% of Oregon acreage planted with sweet cherry in 2016.
Our respondents estimated that the maximum attainable yield per acre for Oregon sweet cherries is, on average, 12,772 pounds, or 6.3 tons (Table 1). We multiplied this estimate by the average price received per pound ($0.55), to estimate that the average surveyed acre has the potential to generate $7,025 under ideal growing conditions, perfect management and zero pest pressure. The actual yield was 8,593 pounds per acre or 4.2 tons, on average (Table 1).
The difference between respondent estimates of actual yield and maximum attainable yield represents the overall yield loss experienced. Using this estimation method, the average rate of yield loss across surveyed sweet cherry acres was approximately 33% (Table 1).
Impact categories
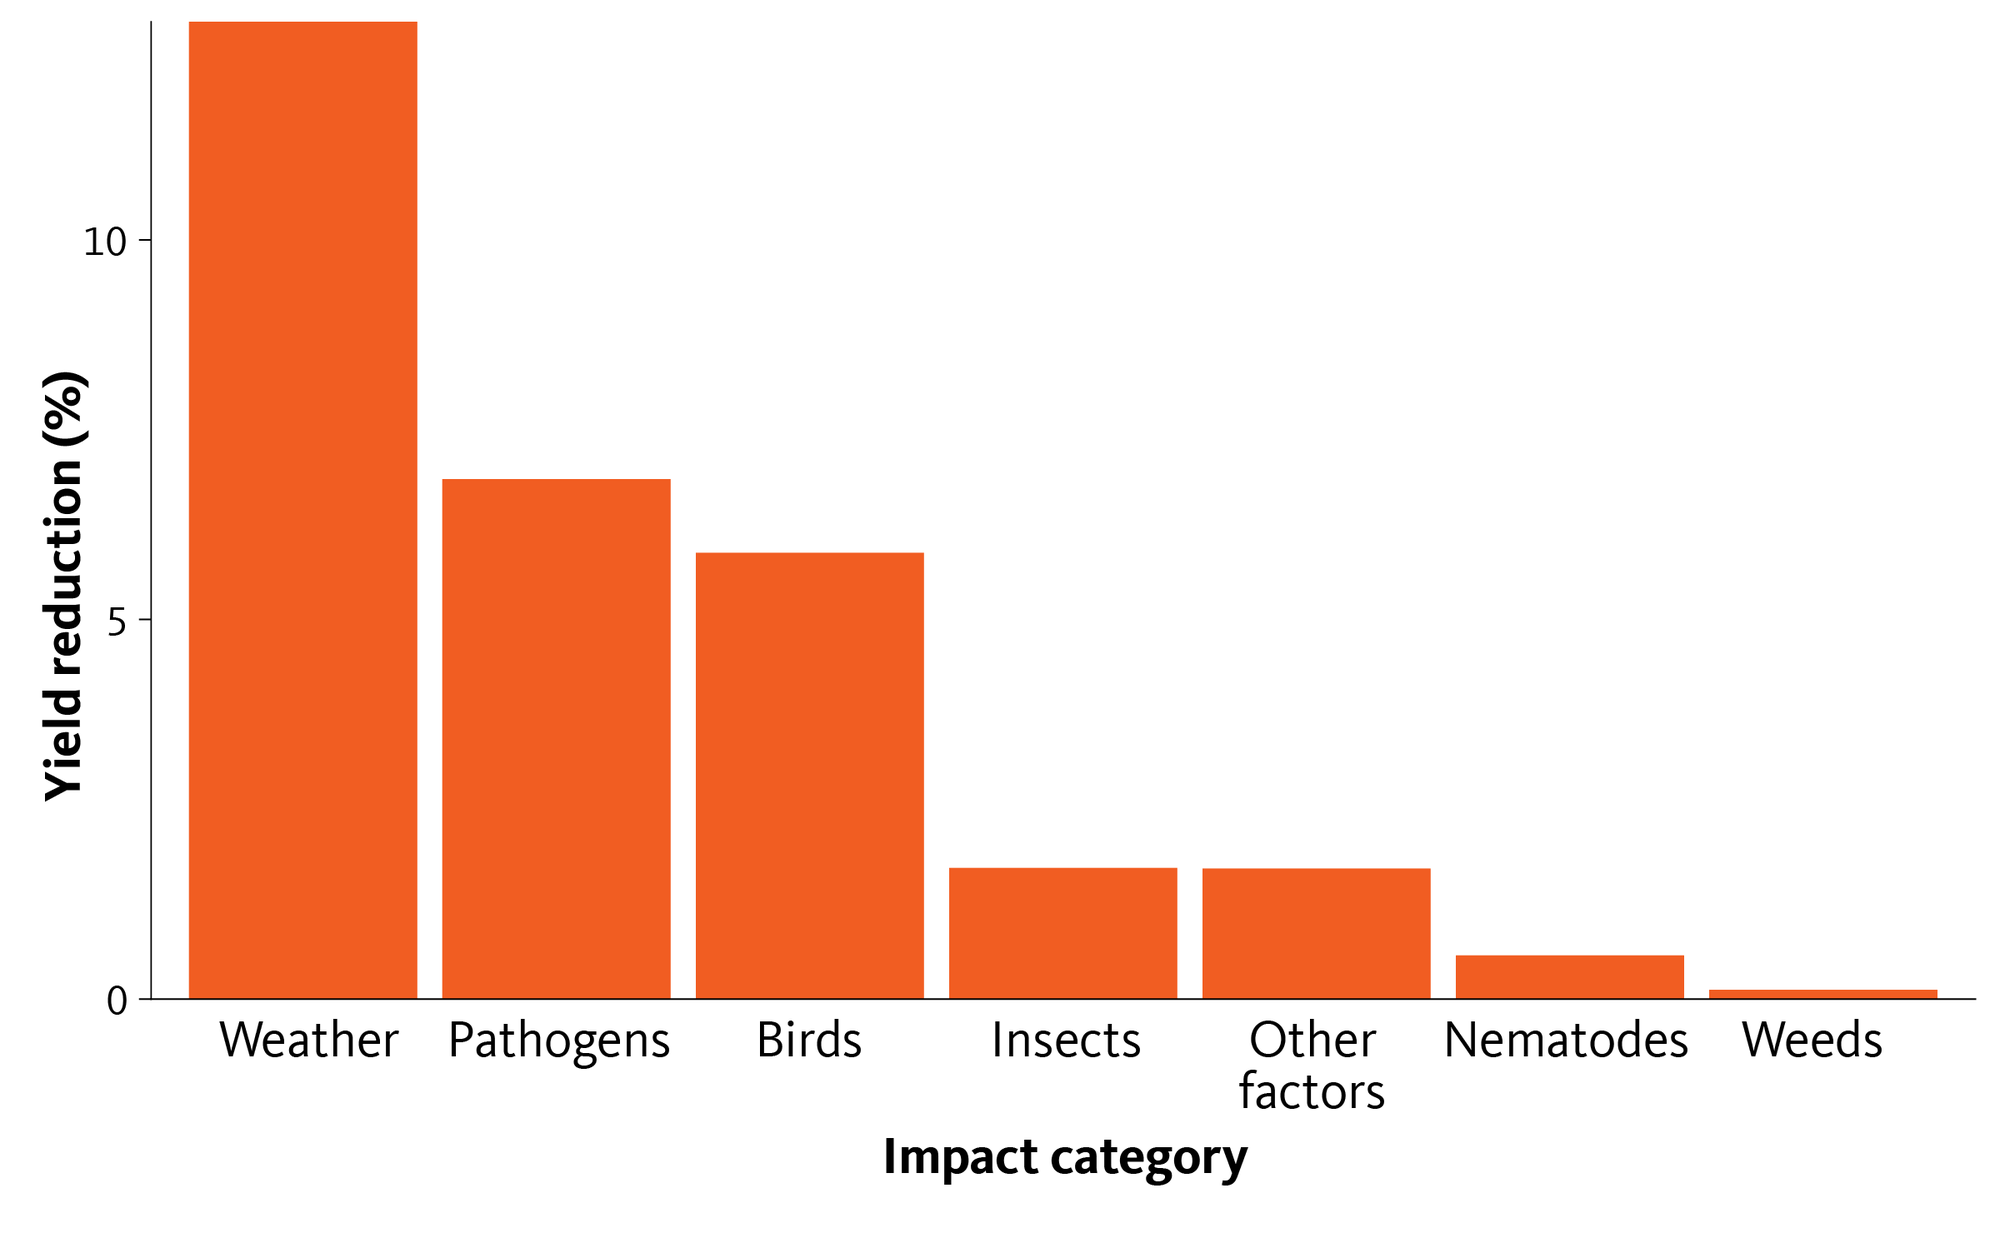
Crop yield losses can be attributed to a combination of factors, including pest pressure, management issues and environmental conditions.
In the second part of the survey, respondents were asked to attribute their estimated overall yield loss to a list of biotic and abiotic yield-loss categories, including damage from vertebrate pests, invertebrate pests, diseases and weeds, as well as impacts from weather, irrigation and other management inefficiencies. Plant diseases caused the largest biotic decline in yield at 6.8%, or 1,035 lbs. per acre, followed by birds (975 lbs., or 5.8%) (Figures 2 and 3).
2016 Oregon sweet cherry crop yield and loss estimates
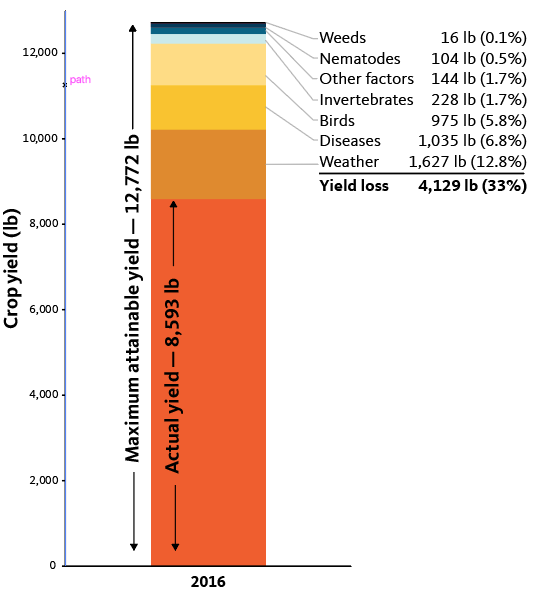
More than 14% of potential yield was reported as lost to abiotic impacts. The largest abiotic contributor to yield loss was attributed to weather, leading to an estimated 12.8% reduction in yield, followed by the “other factors” category, which included management and irrigation-related issues (Figure 2).
Note: Not all survey respondents experience all possible pests, which leads to variation in “n” throughout some of the figures in this report. For example, averages on acreage where the pest was present include only the data for those respondents who reported specific pests, pesticides or management actions. Our averages across all survey acreage include all responses, including those with nothing to report for certain pests or management, whose response is assumed to be zero (in terms of yield losses and management costs).
Yield loss and economic value by pest species
Within the biotic yield-loss categories of invertebrate pests, pathogens and weeds, respondents were asked to break down their estimates even further by reporting average percent yield losses on acreage where the pest was present.
Of course, these yield losses are experienced by growers as economic losses. Using the average estimated price per pound reported by our survey respondents, we can assign a dollar value to the reported losses.
The figures below reveal the most economically damaging sweet cherry pests, overall and within each pest category (invertebrates, pathogens and weeds). Within an agricultural system, these types of data can highlight priority pest issues for targeted research and education. These data can also inform the regulatory system when decisions are made about the tools available for management.
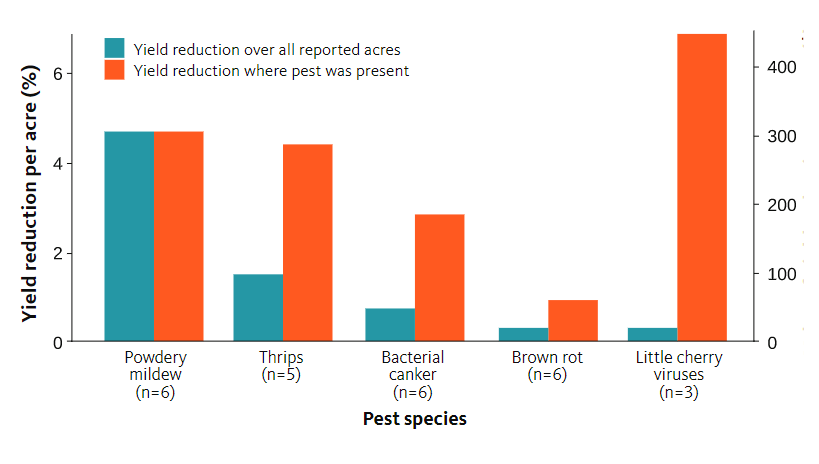
Powdery mildew caused the highest levels of yield losses across all surveyed acreage of sweet cherries (Figure 3). The overall economic impact of any given pest or disease may be lessened if it is not widespread. For instance, little cherry virus is reported to have caused almost 6.4% yield loss on acreage where it was present, but because it was not widespread, it was responsible for only ~1% yield loss surveywide.
Pests that caused the largest yield reduction per acre
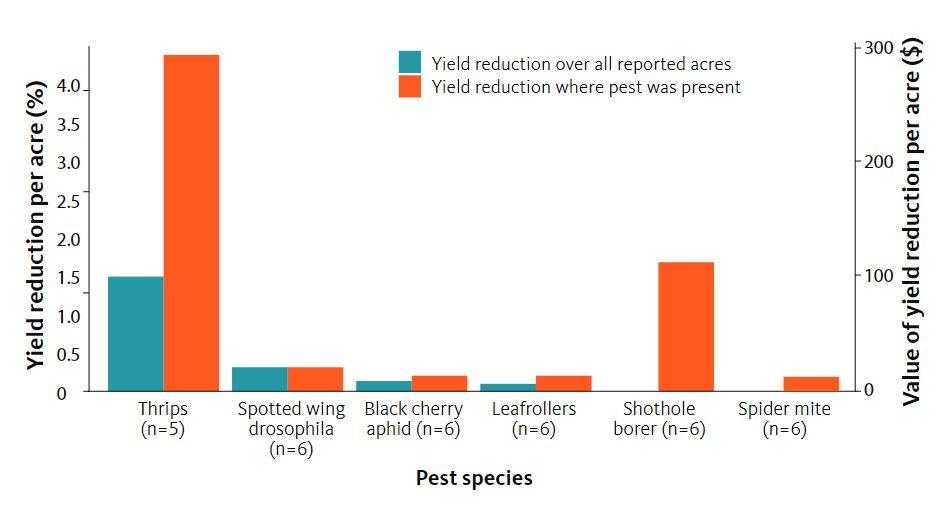
Single species assessments of yield reduction
We analyzed reported impacts to yield pest by pest, both on acreage where the pest was present and across all reported acreage. As with the top pests above, these two scenarios differ based on the extent of infestation. Thrips were the most damaging invertebrate pests on acreage where they were reported, as well as overall (Figure 5).
Yield losses from invertebrate pests
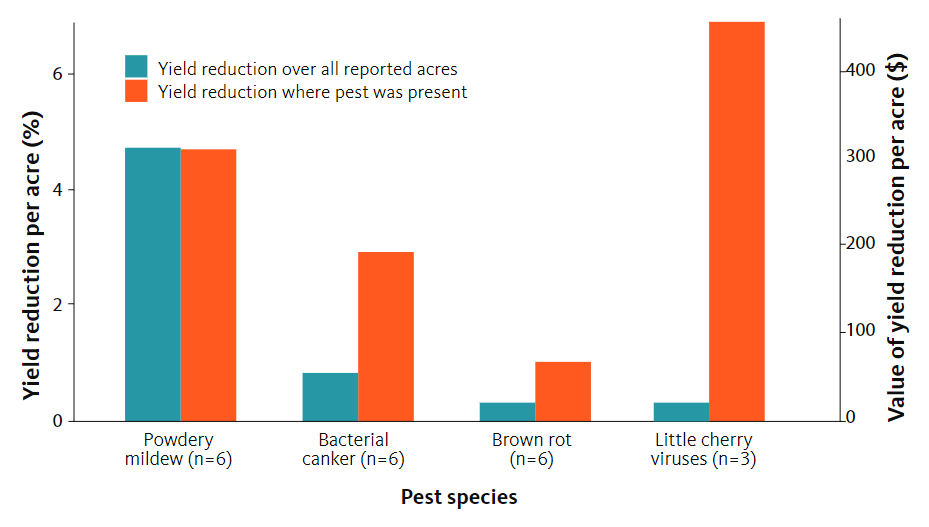
We see similar differences between the list of most damaging diseases on acreage where the disease was present versus all reported acres when analyzing losses to pathogens and weeds. But it is clear that where a grower has powdery mildew they can expect to incur significant yield losses on the impacted acres.
Yield losses from diseases
Yield losses from weeds
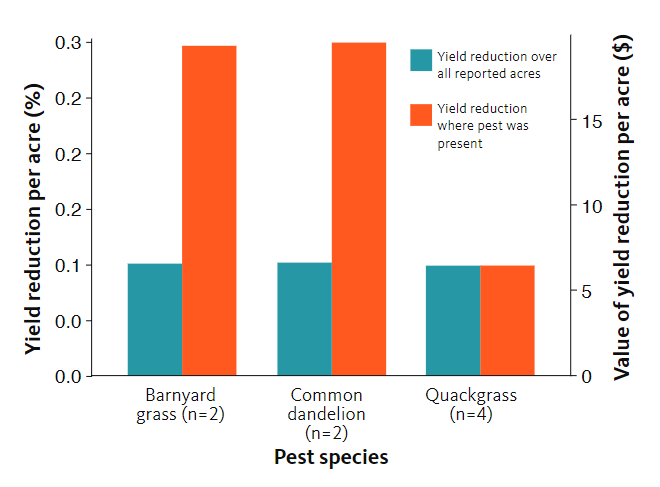
Specific yield losses caused by different weed species are more difficult to estimate. However, annual grasses appear to be a key pest for the Oregon sweet cherry industry.
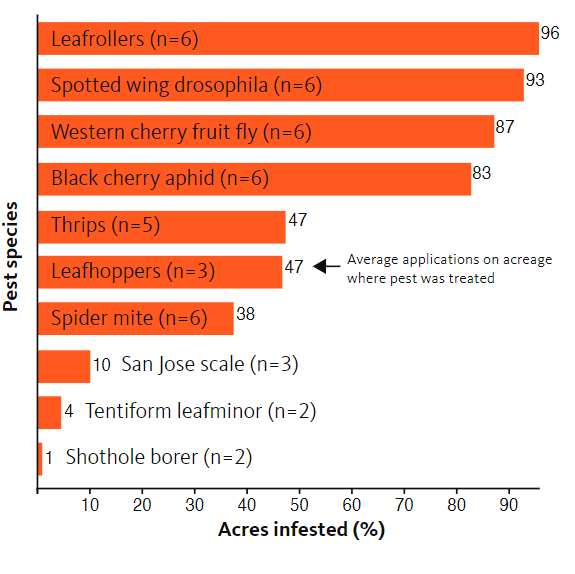
II. Percent acreage infested and treated, by pest
Percent acres infested, by pest species
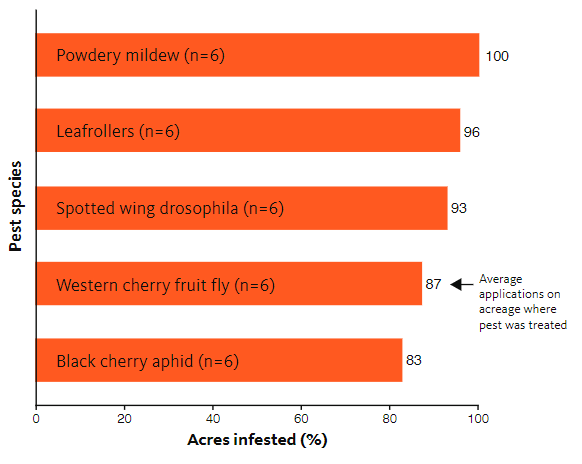
As noted previously, the potential for any given pest to have a significant impact across the industry depends on a combination of the yield loss it causes where it is present and the level of infestation across the industry as a whole. The figures below present pests infesting (present on) over 80% of the sweet cherry acreage we surveyed, followed by figures showing infestation levels by all invertebrates, pathogens and weeds, respectively. We did not ask respondents to estimate infestation by vertebrate pests for this section.
At least five pests are infesting more than 80% of the sweet cherry acres we surveyed, many of which are causing significant losses in yield (Figure 8).
Pests infesting more than 80% of sweet cherry acreage surveyed
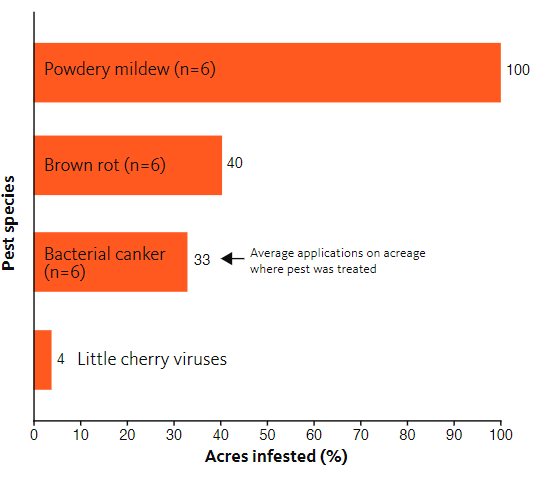
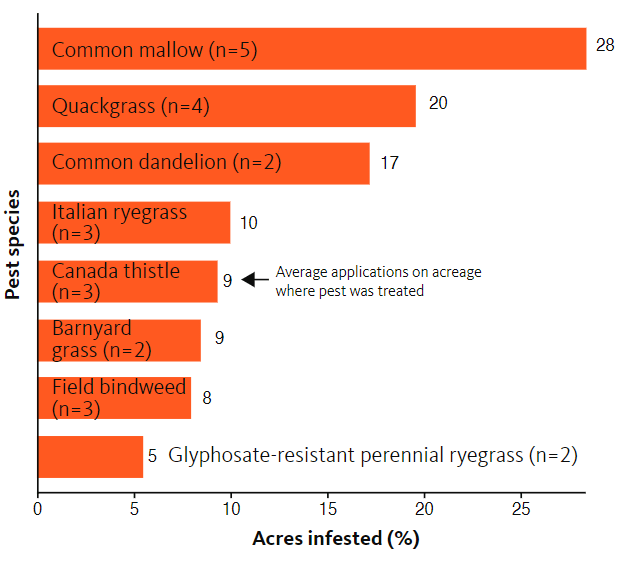
Figures 9, 10 and 11 respectively show the extent of infestation for invertebrates, pathogens and weeds, and reveal a large number of pests with high rates of infestation.
Infestation by invertebrate pests
Infestation by pathogens
Infestation by weeds
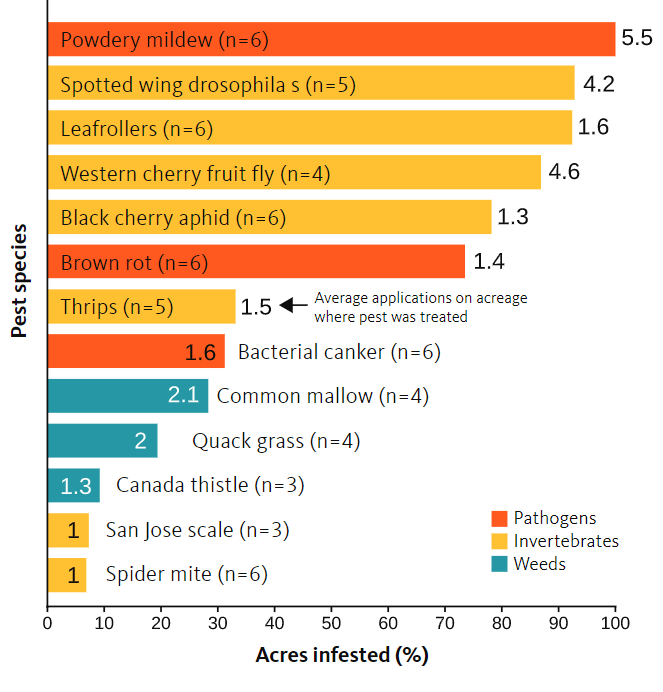
Acres treated and average number of pesticide applications on treated acres
The yield losses our respondents reported for the 2016 field season were experienced in spite of the management applied to help mitigate losses and manage pests. For each pest species, respondents indicated the average number of pesticide treatments used to manage the pest as well as the average number of acres on which treatments were applied.
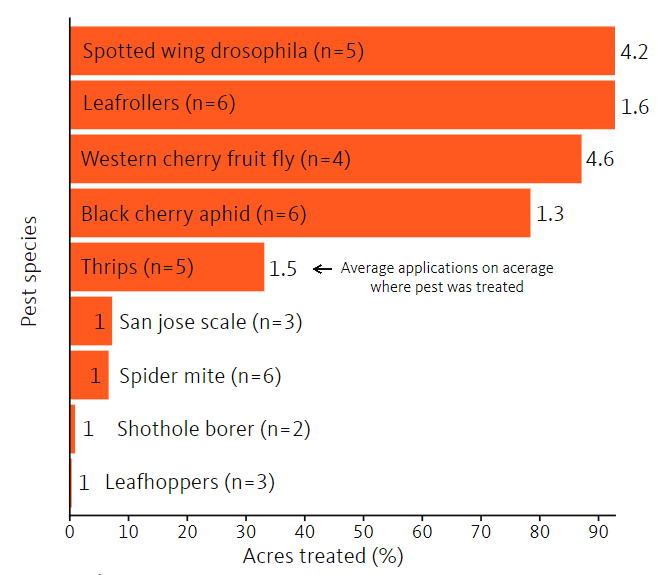
Figure 12 below depicts the pests requiring pesticide treatment on more than 25% of survey acreage. We also include the average number of pesticide applications applied on these acres. These two numbers taken together reveal the extent of management required for a given pest, which can be calculated as “acre-treatments” (see Figures 16–19).
These data highlight the pests requiring higher levels of input and that drive management programs. Producers need more targeted research and Extension support to improve management efforts to control these pests, protect crops and advance IPM.
Pests treated on over 5% of survey acreage, with average numbers of pesticide applications
Figures 13–15 show, respectively, these same data for invertebrates, pathogens and weeds. They show again a pattern of relatively few but important pests requiring widespread treatments.
Acres treated and average number of pesticide applications targeting invertebrate pests
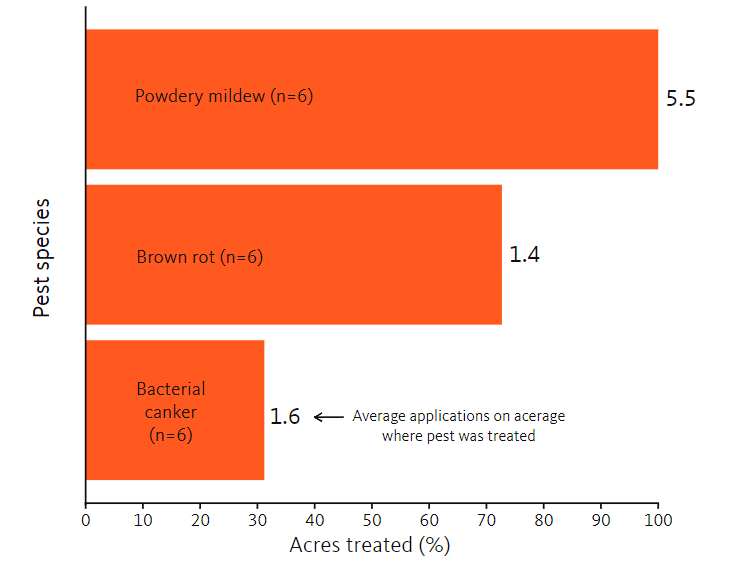
Acres treated and average number of pesticide applications targeting pathogens
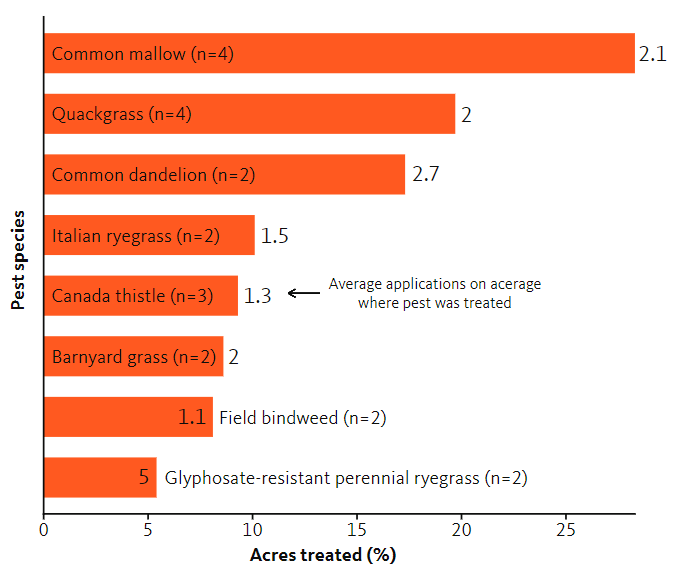
Acres treated and average number of pesticide applications targeting weeds
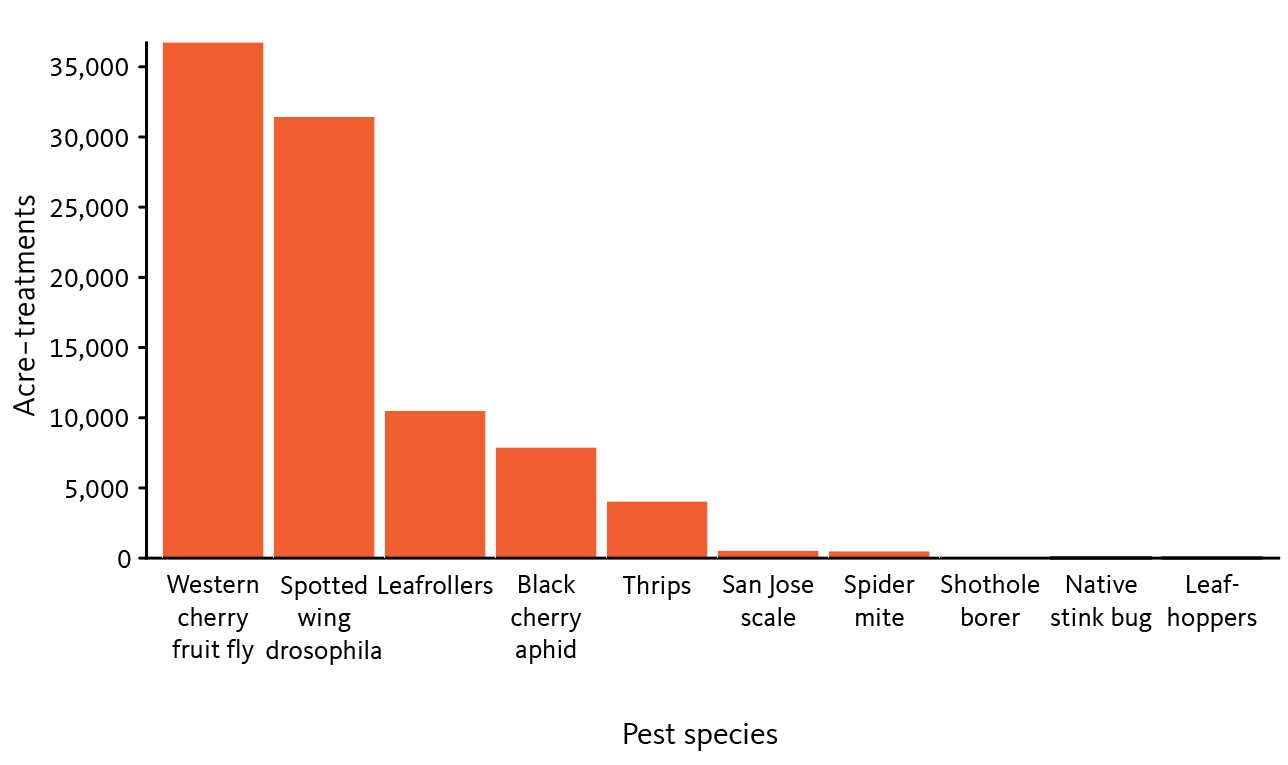
Acre-treatments per pest species
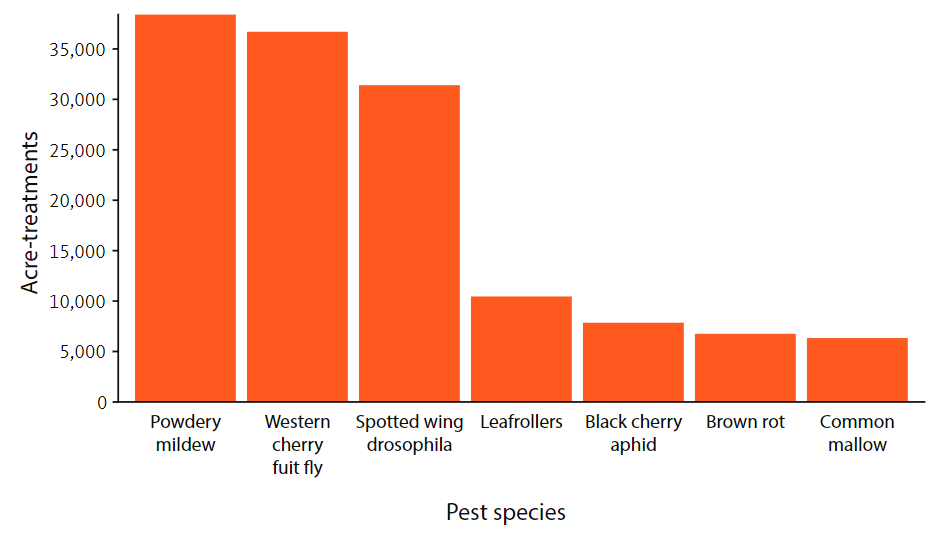
By multiplying the number of acres treated for a given pest by the average number of applications used to manage it, we obtain the “acre-treatments” metric. This number gives a relative metric of the amount of management each of these pests require. The number of acre-treatments can exceed the number of acres surveyed when acres receive multiple applications (in this case either multiple products, tank mixes of two products for the treatment of a single pest and/or multiple applications of the same product).
This is another way to demonstrate the level of management required for various pests. The figures below reveal the sweet cherry pests requiring the greatest amounts of pesticide application in terms of “acre-treatments,” along with the average per acre cost of treatment and the average number of applications across all surveyed acres. Acre-treatment estimates can include any form of pesticide application, including but limited to: seed treatments, fumigation, chemigation, ground applications, and aerial applications. Pesticide application methods vary by crop and by regionally appropriate practices.
Pests with highest acre-treatments
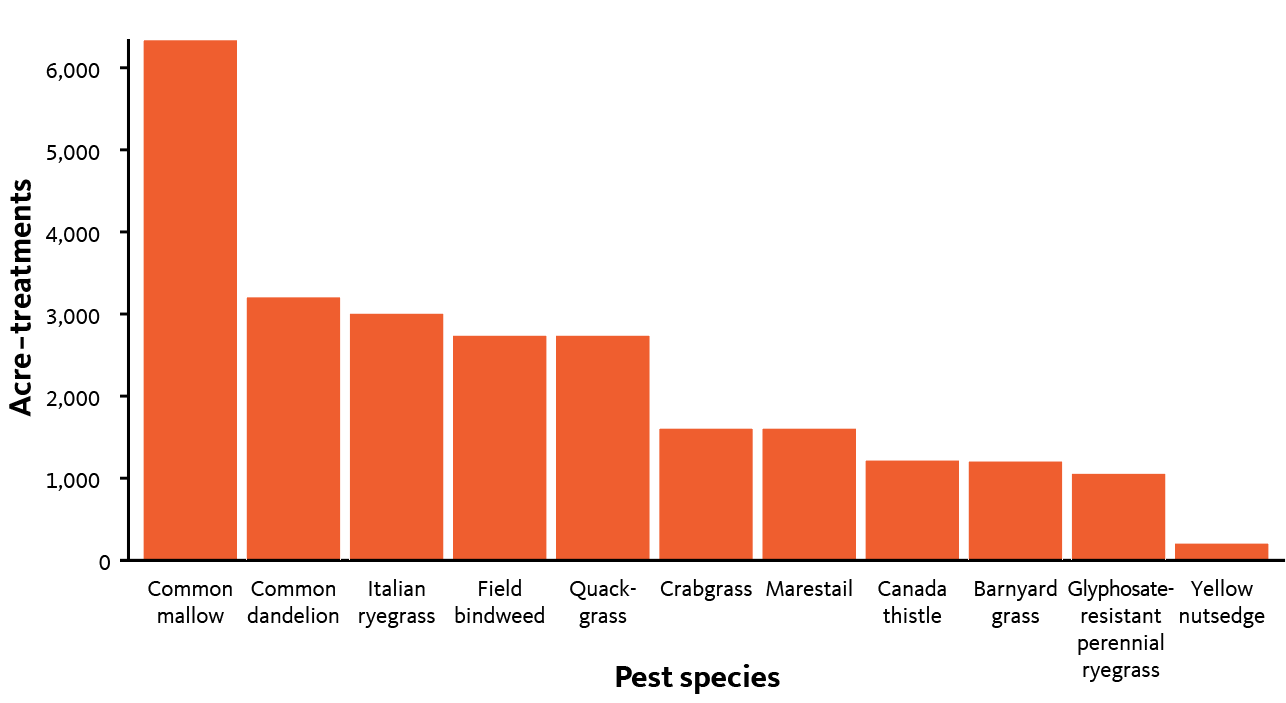
Figures 17–19 again break out these data into pest categories — invertebrates, pathogens and weeds.
Acre-treatments for invertebrates
Acre-treatments for pathogens
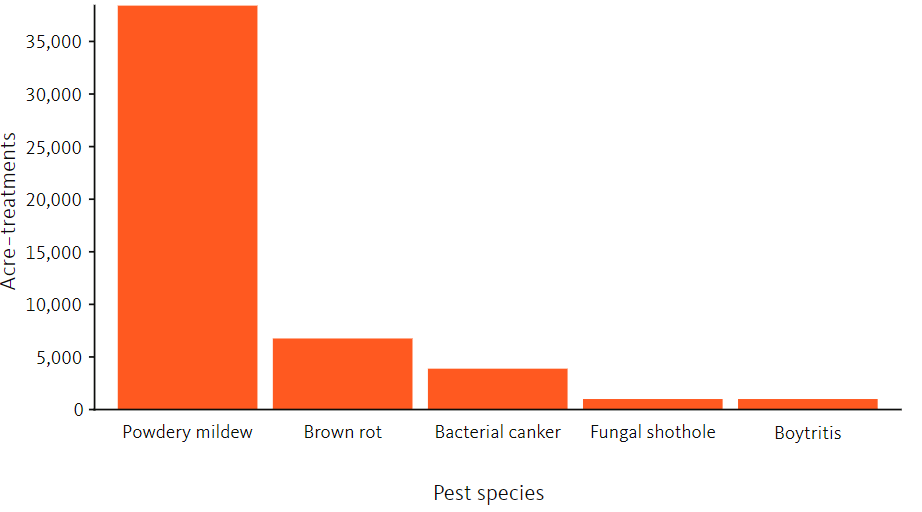
Acre-treatments for weeds
III. Costs of pesticide application by pest species
For each pest species reported as present or managed on the acres that respondents oversaw, we determined the average number of pesticide applications made along with the estimated average cost for one application (this includes the cost of the product plus the cost to apply the product). The following figures depict the reported costs associated with management, and represent the total cost over the growing season, by pest. Note that some pests might have been reported as present on some acreage, but with no chemical applications. These data were also included in the following analyses, at zero cost, in order to gain a more accurate measure of the costs associated with the presence of a given pest.
Costs of pesticide application
Species whose pesticide application costs were over $25 per acre on acreage where the pest was present
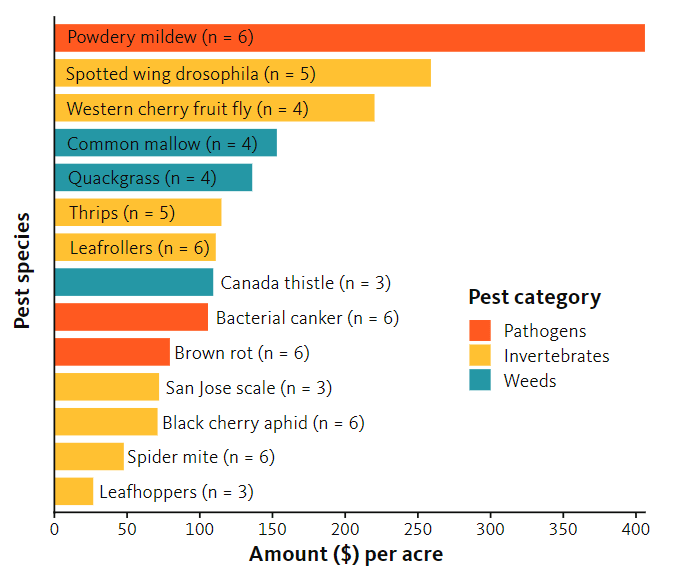
Figures 21–23 break out these data for invertebrates, pathogens and weeds. Powdery mildew is the pest with the highest overall cost of treatment, followed by spotted wing drosophila and Western cherry fruit fly.
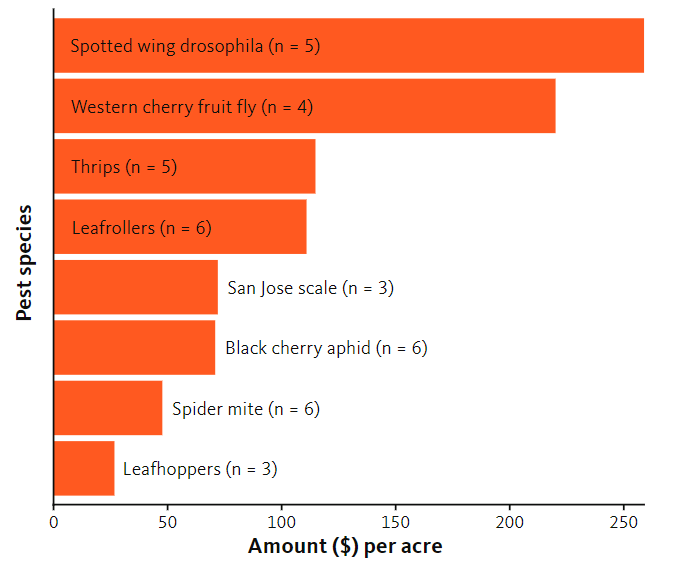
Costs of pesticide application for invertebrate pest species
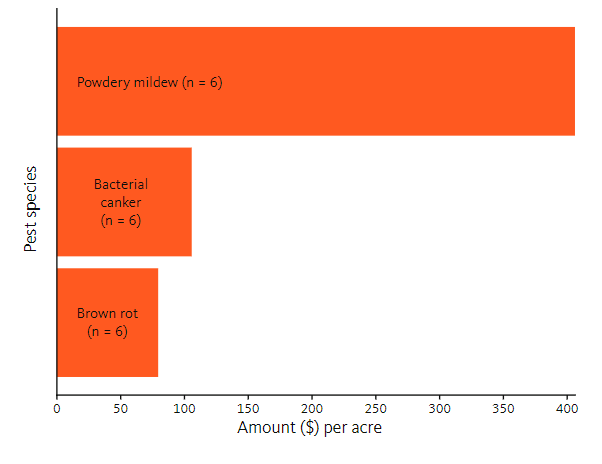
Costs of pesticide application for plant pathogens
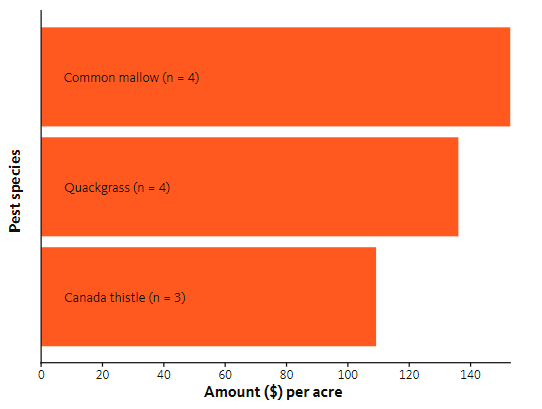
Costs of pesticide application for weeds
IV. Costs of other pest management activities
Respondents were also asked to estimate the cost of any additional pest management activities beyond the use of pesticides. They were asked to report the average cost per acre, as well as the average number of acres, to which each practice was applied. The cost per treated acre reflects respondents’ reported cost on acreage where the treatment was applied. The cost per acre across all surveyed acreage metric averages the treated-acre costs across all surveyed acreage. For example, monitoring with traps may have taken place on only half the survey’s 6,950 acres, with an average “treated-acre” cost of $5 per acre. When averaged across the whole 6,950 acres, this represents a $2.50 per acre cost. If a practice was applied across all of a respondent’s acreage, the two numbers (cost per treated acre and cost per acre across all survey acreage) will be the same.
Field scouting, forecasting, sanitation and other nonchemical IPM practices all have associated costs. Respondents struggled with estimating costs for these activities, which may have resulted in underreporting of the costs of additional management. If we are to calculate the total cost of IPM, including nonchemical tactics and practices, we need to identify and factor in the additional costs of pest management. We are seeking to improve our understanding of these additional costs over time as the survey methodology advances.
| Management action | Acres treated (%) | Cost per acre across all survey acreage ($) | Cost per acre on treated acreage ($) | N |
|---|---|---|---|---|
| Insect forecasting | 100 | 15 | 15 | 6 |
| Monitoring with traps | 82 | 15 | 18 | 5 |
| Scouting | 91 | 22 | 22 | 6 |
| Management action | Acres treated (%) | Cost per acre across all survey acreage ($) | Cost per acre on treated acreage ($) | N |
|---|---|---|---|---|
| Scouting | 63 | 23 | 27 | 5 |
| Disease forecasting | 59 | 17 | 26 | 4 |
| Management action | Acres treated (%) | Cost per acre across all survey acreage ($) | Cost per acre on treated acreage ($) | N |
|---|---|---|---|---|
| Cover cropping | 42 | 3 | 8 | 2 |
| Mow and blow | 2 | 0 | 0 | 1 |
V. Pesticide use
In addition to collecting data by pest species, we asked respondents to provide details of each specific pesticide active ingredient utilized. The figures in this section summarize the reported use of pesticides in terms of percent acres treated and average number of applications for each active ingredient.
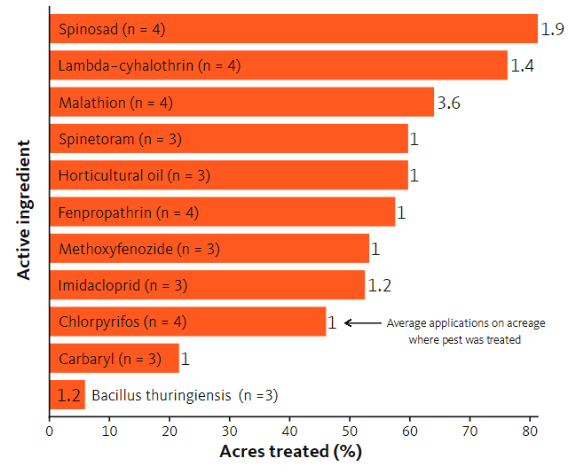
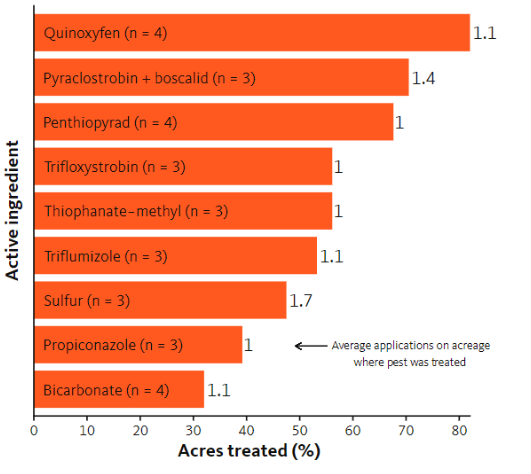
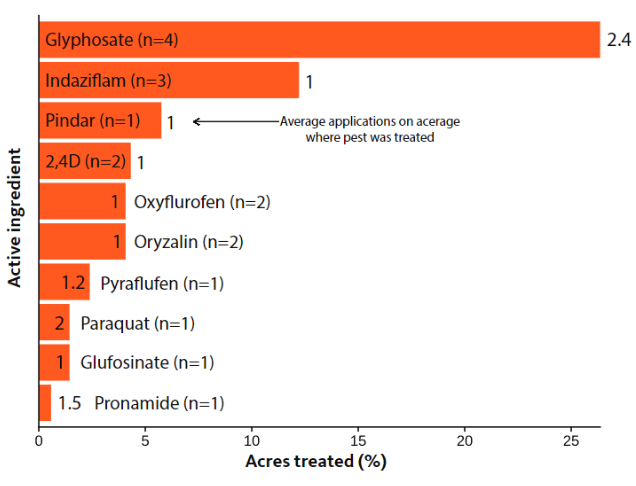
The first figure reports the pesticides used on over 25% of surveyed acreage, along with the average number of times each active ingredient was applied. The figures that follow report this data for insecticides, fungicides and herbicides, respectively. Note: Average number of applications can be fractional because some single treatments were apportioned across multiple target pests.
Pesticides applied on over 25% of survey acreage, with average number of applications
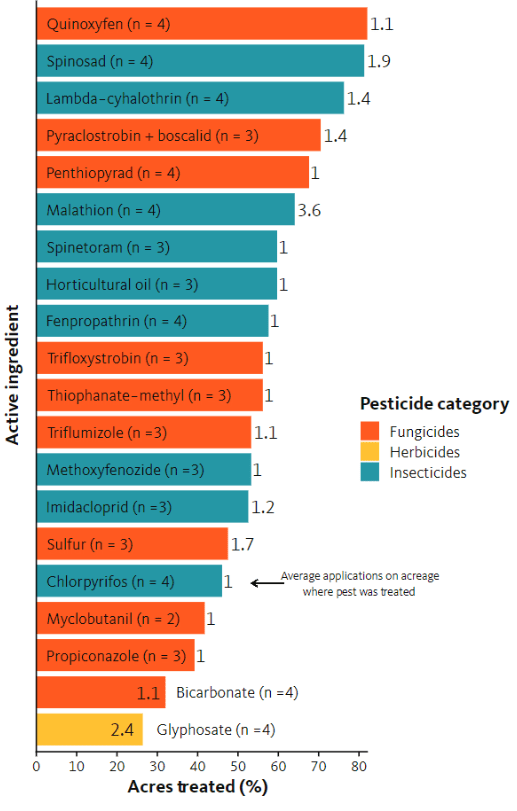
Figures 28–31 follow the same pattern as above, with the most significant pesticides used, in terms of area of use, across all pest classes, shown in figure 28, and then a more detailed portrayal of these data for three main pest classes in the remaining figures.
One way to view these analyses is to identify where overreliance on one material or a single pesticide mode of action could be promoting resistance to that pesticide or pesticide class, which ultimately would limit efficacy and potentially increase economic losses caused by pests.
Percent acreage treated with insecticide active ingredient
Percent acreage treated with fungicide active ingredient
Percent acreage treated with herbicide active ingredient
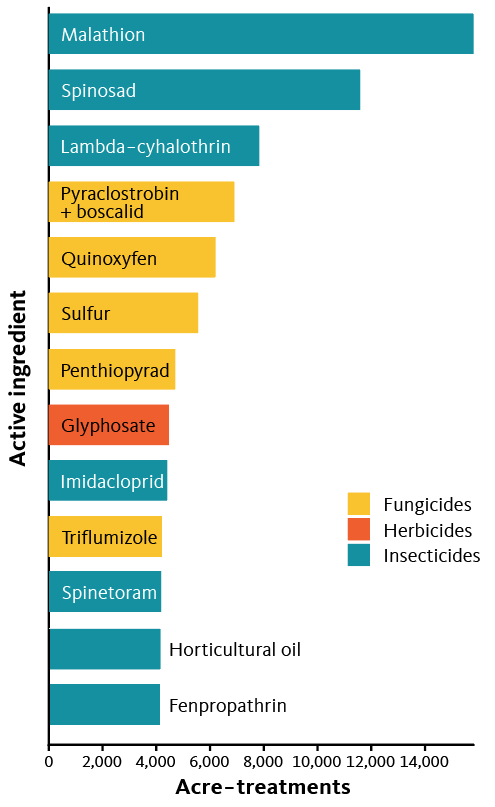
Pesticide acre-treatments
The number of acres treated with a given active ingredient, multiplied by the average number of applications again reveals “acre-treatment” estimates (see “acre-treatments per pest species,” for a reminder of this metric). This reveals the extent of pesticide use required and provides critical information for researchers and educators, particularly those tracking issues such as pest resistance, natural enemy protection and pesticide efficacy. This also serves as a baseline for tracking the way practices change over time. As a reminder, the acre-treatment metric is based only on our surveyed acreage (6,950 acres) and only those acres reported to have been treated with any given pesticide. (See previous section for the percent of acres treated and average number of applications, which are the metrics used for the following calculations.)
Figures 28–31 follow the same pattern as above, with the most significant pesticides used, in terms of area of use, across all pest classes, shown in figure 28, and then a more detailed portrayal of these data for three main pest classes in the remaining figures.
One way to view these analyses is to identify where overreliance on one material or a single pesticide mode of action could be promoting resistance to that pesticide or pesticide class, which ultimately would limit efficacy and potentially increase economic losses caused by pests.
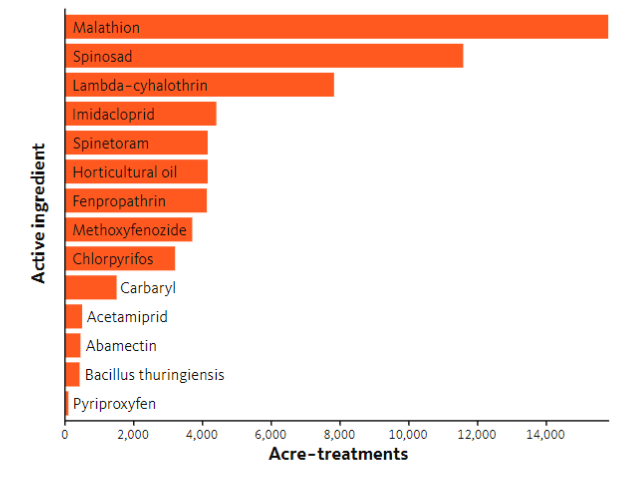
Acre-treatments for commonly used insecticides
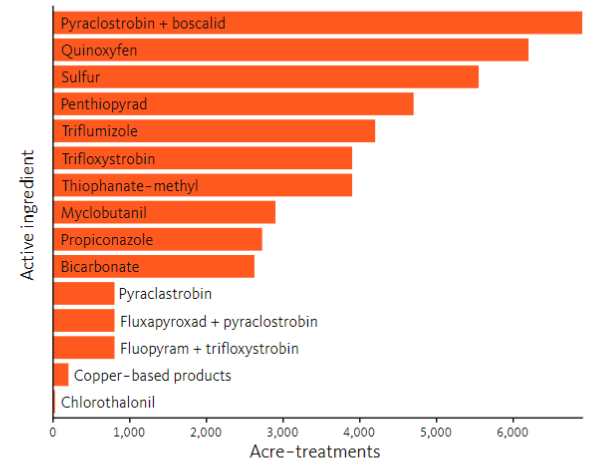
Acre-treatments for commonly used fungicides
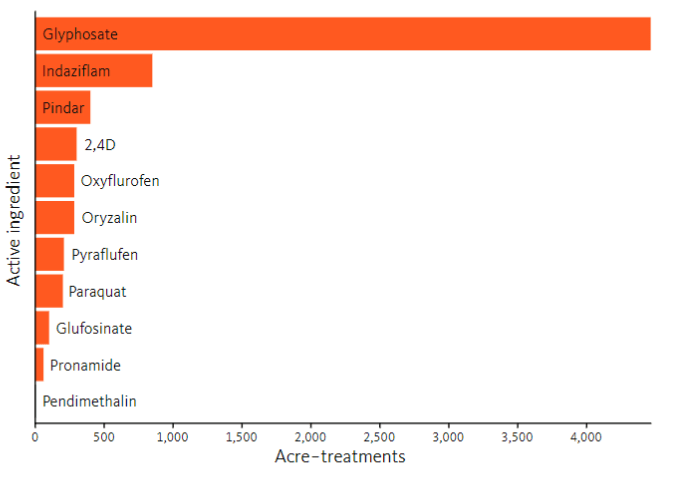
Acre-treatments for commonly used herbicides
VI. Overall economic impacts
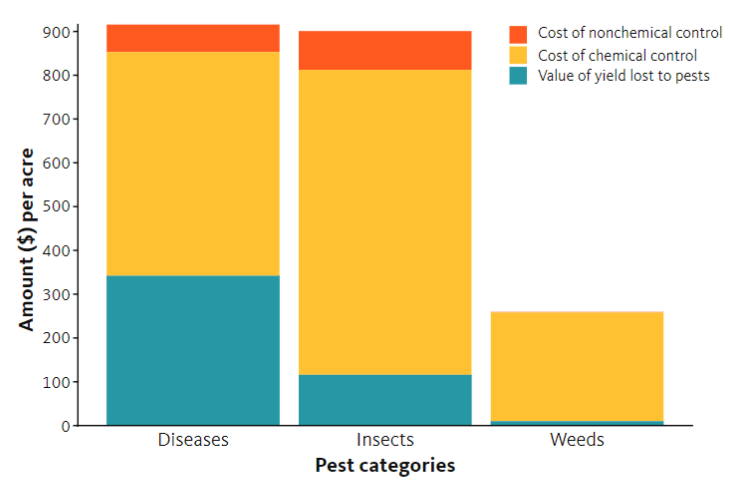
To get an idea of the overall economic impacts of yield loss and pest management across the entire survey area, we calculated a per-acre average of all pest management costs (chemical as well as additional or “nonchemical” costs), as well as the value of the total yield losses reported, which occurred despite the management methods employed. As previously mentioned, the nonchemical costs are an area for improvement in our survey process. Across all surveyed acreage, plant disease is the primary driver of crop pest loss, while insect pests are the primary driver of chemical input costs. When taken in sum, the cost to growers is around $2,100/acre for the insect pest and plant disease impact categories when crop pest losses and management costs are factored together.
Summary of economic impacts per acre, across all survey acreage
Economic return
In section 1, we used respondent’s average actual yield estimates (in lb.) and average price estimates to determine that growers earned, on average, about $4,726/acre of Oregon sweet cherry. If grown under ideal conditions with perfect management and no pest pressure, our respondents estimated that growers could earn $7,024/acre. The $2,298/acre difference between these two estimates represents lost revenue that results from environmental factors, management costs and losses from pests.
One of the goals of this survey was to explore the sources of revenue loss for Oregon’s cherry growers pertaining to both pest losses and pest management costs. On average, our respondents estimated that pest impacts reduce overall yield by $467/acre. Using cost and application estimates, we also determined the cost of chemical and nonchemical pest management to be $1,608/acre. This represents pest-related impacts over $2,000 per acre to a grower’s bottom line, and does not include a number of additional farming and business costs that are not covered by this analysis.
Further, the estimation of nonchemical pest management benefits and costs are a particularly challenging undertaking and the estimates presented in this report are probably lower than the true costs. One key goal for the future is to be able to accurately estimate and document the true costs of nonchemical pest management practices.
Discussion
Detailed information regarding the economic impacts of pests and their management is critical to understanding ways to improve pest management and advance IPM. Our respondents reported a 33% difference between the maximum attainable yield and the actual yield, with almost half of this difference attributed to pest damage, indicating there is much scope for increasing pest management efficiency.
Our respondents estimated an overall yield loss of 18.5% from pests, despite an average of $1,608/acre spent on pest management. Respondents reported pathogens as having the largest overall negative impact on cherry yield, at around 6.8% of yield lost per acre. Birds closely followed with an estimated 5.8% yield loss per acre, and invertebrate species at 1.7%. This significant yield loss reveals a clear and urgent need for identifying effective, economical and sustainable pest management strategies for the cherry industry.
Powdery mildew was a key pest for the cherry industry, with respondents reporting it as present and treated on 100% of surveyed acreage. Losses from powdery mildew averaged 4.7%, the highest single pest impact in the survey. Powdery mildew necessitated an average of 5.5 fungicide applications. This led to a reported management expense of over $400/acre for powdery mildew alone.
Spotted wing drosophila and western cherry fruit fly were key insect pests in our survey, infesting 93% and 87% of surveyed acreage, respectively. These two species were also the main drivers of insecticide sprays, each necessitating more than four applications at a combined cost of over $450/acre per growing season. However, our respondents reported minimal yield losses from these two insect species, suggesting that insecticide application in combination with other IPM tactics is successfully preventing impacts.
Other important insect pests were thrips and leafrollers. Thrips were reported present on 47% of surveyed acreage and were the primary driver of yield loss among insect pests, causing 4.4% yield loss on acreage where present and a 1.5% yield loss surveywide. Despite infesting 96% of surveyed acreage, leafrollers caused minimal yield loss, suggesting that the estimated 1.6 pesticide applications over 90% of surveyed acreage is effectively controlling this pest.
Some pests are not widely distributed but can be devastating on infested acreage. In our survey, little cherry viruses were the most devastating, reducing yield by over 6% per acre where present. However, because this species was reported present on only 4% of surveyed acreage, its overall effect on yield loss was minimal. Similarly, botrytis caused yield losses in excess of 3% on acreage where it was reported present but occurred on less than 0.1% of surveyed acreage.
Understanding patterns in pest distribution and damage is critical if we are to respond effectively with research and education to assist growers in fine tuning their IPM approaches.
Our low level of confidence in the reported costs associated with nonchemical IPM practices is a result of the challenge of effectively estimating these costs. This is an important area for future improvement. IPM includes a full suite of nonchemical activities, and better accounting for the costs of these as well as the value of different approaches will further improve this economic analysis and help to refine more comprehensive IPM programs.
The data on pest losses and management we have presented here provides detailed, valuable and previously missing information regarding IPM in sweet cherry production. From these data, if gathered regularly, we can track changes in pest pressure and management over time, prepare for emerging problem pests and identify the specific areas where pest management resources are best targeted. Collected over time, these data provide economic metrics for IPM that should be of direct value to growers and decision-makers, and also to research and Extension efforts.
References
Cerda, R., J. Avelino, C. Gary, P. Tixier, E. Lechevallier, C. Allinne. 2016. Primary and Secondary Yield Losses Caused by Pests and Diseases: Assessment and Modeling in Coffee. PLoS ONE 12(1): e0169133.
Ellsworth, P.C., A. Fournier and W. Dixon. 2007 (rev. 1/2020). Arizona Cotton Insect Losses. Publ. No. AZ1183. University of Arizona, College of Agriculture and Life Sciences, Cooperative Extension, Tucson, Arizona. Updated data available upon request.
Ellsworth, P.C., A.J. Fournier, J.C. Palumbo, S.E. Naranjo and G.B. Frisvold. 2016. Chronicling Successful Integration of Technology and Knowledge Over 25 Years of IPM in Arizona. Economics of IPM in the 21st Century: Multiple Perspectives from Around the World. International Congress Entomology ICE 2016, Orlando, FL. September 26, 2016.
Lobell, D.B., K.G. Cassman and C.B. Field. 2009. Crop Yield Gaps: Their Importance, Magnitudes, and Causes. Annual Review of Environment and Resources 2009 34:1, 179-204.
USDA National Agricultural Statistics Service (2016). NASS — Quick Stats (2020). Accessed 12-10-2020
Oregon Department of Agriculture. Oregon Agricultural Statistics & Directory 2020.
Palumbo, J.C. (2019). Insect Losses and Management on Desert Lettuce: A 15-Year Summary. University of Arizona Vegetable IPM Update, Vol. 10, No. 13, June 2019.
Popp, J., and K. Hantos. 2011. The impact of crop protection on agricultural production. Studies in Agricultural Economics, No. 113 p. 47–66.
Appendix 2. Survey question outline
General yield and losses information
Respondent crop yield and pricing general information
Acres managed
Actual yield per acre
Maximum attainable yield per acre
Price received per pound
General factors impacting crop yield
Overall percent loss due to weather damage
Overall percent loss due to chemical injury due to pesticide application
Overall percent loss due to insect species
Overall percent loss due to pathogens
Overall percent loss due to weeds
Overall percent loss due to nematodes
Overall percent loss due to “other pests” [indicate]
Overall percent loss due to “other factors” [indicate]
Type of production
Percent acres managed that are certified organic
Percent acres managed that are transitional
Percent acres managed that are conventional
Pesticide application data
Air
Percent acres treated by air
Average applications by air
Average cost ($) per acre for a single aerial application (excluding application cost)
Ground
Percent acres treated by ground
Average applications by ground
Average cost ($) per acre for a single ground application (excluding application cost)
Chemigation
Percent acres treated by chemigation
Average applications by chemigation
Average cost ($) per acre for a single chemigation application (excluding application cost)
Pest losses due to specific insect pests
Number of acres where pest was present
Number of acres treated for pest
Average percent yield loss due to pest on infested acres
Number of applications used for pest
Average cost of single application (including application cost)
Pest losses due to specific pathogens
Number of acres where pest was present
Number of acres treated for pest
Average percent yield loss due to pest on infested acres
Number of applications used for pest
Average cost of single application (including application cost)
Pest losses due to specific weeds
Number of acres where pest was present
Number of acres treated for pest
Average percent yield loss due to pest on infested acres
Number of applications used for pest
Average cost of single application (including application cost)
Insecticide application data
Product use data
Number of acres treated per insecticide
Average number of applications per insecticide
Cost of product per acre
Insecticide selection
Target pest
Average rate of application (low, medium, max)
Timing of application (early, midseason, late or a combination)
Application method (ground, air, chemigation)
Historic use of product
Fungicide application data
Product use data
Number of acres treated per fungicide
Average number of applications per fungicide
Cost of product per acre
Fungicide selection
Target pest
Average rate of application (low, medium, max)
Timing of application (early, midseason, late or a combination)
Application method (ground, air, chemigation)
Historic use of product
Herbicide application data
Herbicide selection
Number of acres treated per herbicide
Average number of applications per herbicide
Cost of product per acre
Product use data
Target pest
Average rate of application (low, medium, max)
Timing of application (early, midseason, late or a combination)
Application method (ground, air, chemigation)
Historic use of product
Nonchemical insect control practices
Number of acres where practice was utilized
Estimated cost per acre
Target insect
Nonchemical pathogen control practices
Number of acres where practice was utilized
Estimated cost per acre
Target insect
Nonchemical weed control practices
Number of acres where practice was utilized
Estimated cost per acre
Target insect
¡Use los pesticidas con seguridad!
- Póngase ropa de protección y equipo de seguridad según las recomendaciones de la etiqueta. Báñese después de cada uso.
- Lea la etiqueta del pesticida—aunque lo haya usado antes. Siga al pie de la letra las indicaciones de la etiqueta (y cualquiera otra indicación que Ud. tenga).
- Tenga precaución al aplicar los pesticidas. Conozca su responsabilidad legal como aplicador de pesticidas. Usted puede ser responsable de heridas o daños resultantes del uso de un pesticida.