This report presents data from the Oregon State University’s Crop Pest Losses Impact Assessment program, a collaboration between Oregon State University’s Oregon IPM Center, the University of Arizona’s Arizona Pest Management Center, the Western IPM Center and industry partners. The program facilitates the collection of real-world data on the impacts of insects, diseases, weeds and other pests on key crops in the Western region — data which are vital yet lacking in most agricultural industries.
Improving our understanding of crop yield losses and their contributing factors is critical to improving agricultural production and increasing food security. Currently, quantitative data on pest impacts are very limited, and estimating crop loss data is challenging. However, quantifiable measurements of pest pressure, pesticide use, costs, and yield and quality losses due to pests are our most objective tools for assessing IPM status and general progress in agriculture. These data are also valuable in supporting IPM evaluation and needs assessment, in setting priorities and education, and in informing federal decision-making, including the US Environmental Protection Agency’s pesticide registration and review process. In particular, assessments of crop losses that occur despite all of the crop protection strategies deployed are critical for identifying needs and for improving pest management decision-making.
We have designed and delivered a detailed survey based on multidisciplinary expertise. The survey incorporates methods developed over decades in Arizona. This instrument aims to capture information from those responsible for pest management (generally crop consultants) regarding the impacts of pests, including yield losses and pest management costs, across several key commodities in the Pacific Northwest. We hope that these data can inform crop-specific pest management decision-making and IPM advances, especially when collected regularly over time.
This report summarizes data collected for Oregon hazelnuts. It is targeted at hazelnut researchers, Extension workers, crop consultants and others who are interested in crop losses and in the development and deployment of IPM.
Oregon hazelnut production statistics
According to the Oregon Department of Agriculture, western Oregon accounts for 99% of hazelnut production in the United States. In 2017, there were approximately 70,000 acres of hazelnut orchards in western Oregon, 40,000 of which were considered “bearing acres.” According to the USDA’s National Agricultural Statistics Service, hazelnut bearing acreage generated $73.6 million in revenue, with an average yield of 1,600 lb/acre, and an average value of $2,300/ton, or $1.15/lb. The remaining 30,000 acres consisted of young and newly planted stands that produce a negligible yield.
Methods
Materials
The data used in this report are based on a survey conducted in June 2018 with crop consultants reporting on hazelnut production in 2017. Data for this report were generated through an interactive, web-based survey modeled after the Arizona Cotton Insect Losses survey. The survey was developed using specialized software that allows for multiple levels of response validation. Surveys were completed during an in-person group session where respondents entered information online via a weblink. The survey took approximately two hours to complete. Survey responses were automatically downloaded into a database, from which results were analyzed.
The survey was divided into sections relating to pests and pest management. In the first section of the survey, respondents estimated the price they received per pound of hazelnuts, their realized yield and their maximum attainable yield. This initial estimate provided a measure of overall yield loss (the difference between the reported actual yield vs. the maximum attainable yield), which respondents were then asked to attribute to various factors, both biotic and abiotic.
In subsequent parts of the survey, respondents refined these yield loss estimates for specific pests, along with pest-by-pest information on acreage where the pest was present. They also approximated costs of management. Finally, respondents estimated pesticide usage by active ingredient (acreage, number of applications and costs), as well as utilization and costs of nonchemical management methods. See Appendix 2 for a more detailed outline of survey questions.
Respondents
The survey was completed by six hazelnut crop consultants in June 2018, reporting on the 2017 season. All respondents were volunteers recruited with the help of the local grower associations and Oregon State University faculty. The respondents reported on a total of 17,250 acres, which represented approximately 39% of the hazelnut-bearing acres in Oregon at the time. The total survey acreage under an individual respondent’s management ranged from 5% to 57% of the total 17,250 surveyed acres.
Design
This survey is descriptive research that seeks to understand and quantitatively describe the impacts of pests and their management on hazelnut production in Oregon. This report is intended to inform respondents, growers, researchers, Extension personnel and industry professionals about current pest management successes and needs. It is also intended to be part of a sequence of regular surveys that can reveal trends and changes in pests and management over time.
Analysis
Respondent data were analyzed using specific formulae depending on the information. These formulae are detailed in Appendix 1. While many possible analyses could be performed on the data, we focused on those which help shed light on the general impacts of pests and their management — the impacts and value of yield losses and management costs — in as much detail as possible.
Results
Overall crop yield losses
Actual yield, maximum attainable yield and price
In the first part of the survey, respondents were asked to estimate the average price received per pound of hazelnuts and the average actual yield from their managed acreage. They were also asked to estimate the “maximum attainable yield” per acre by estimating the highest possible yield. This assumes ideal growing conditions and no pest pressure within the general constraints of varieties grown, weather and local geography.
Table 1. The average price received per pound of hazelnut per acre, mean actual yield in pounds per acre and mean maximum attainable yield in pounds per acre.
Actual yield and maximum attainable yield are expressed as weighted averages (Equation 2). Data based on estimations from six hazelnut IPM consultants representing 17,250 acres, or 39% of Oregon hazelnut acreage in 2017.
Price ($/lb): 0.96
Actual. yield (lb/acre): 1,732
Maximum attainable yield (lb/acre): 3,017
Our respondents estimated that the average acre of mature hazelnut trees in western Oregon is capable of generating 3,017 lb (Table 1). We multiplied this estimate by the average price received per lb ($0.96), to estimate that the average surveyed acre has the potential to generate $2,896 under ideal growing conditions and management and without pest pressure. The actual yield was 1,732 lb per acre, on average — a difference of 1,285 lb per acre (Table 1).
The difference between respondent estimates of actual yield and maximum attainable yield represents the overall yield loss experienced. Using this estimation method, the average rate of yield loss estimated across surveyed hazelnut acres was 43% (Table 1).
Impact categories
Crop yield losses can be attributed to a combination of factors, including pest pressure, management issues and environmental conditions.
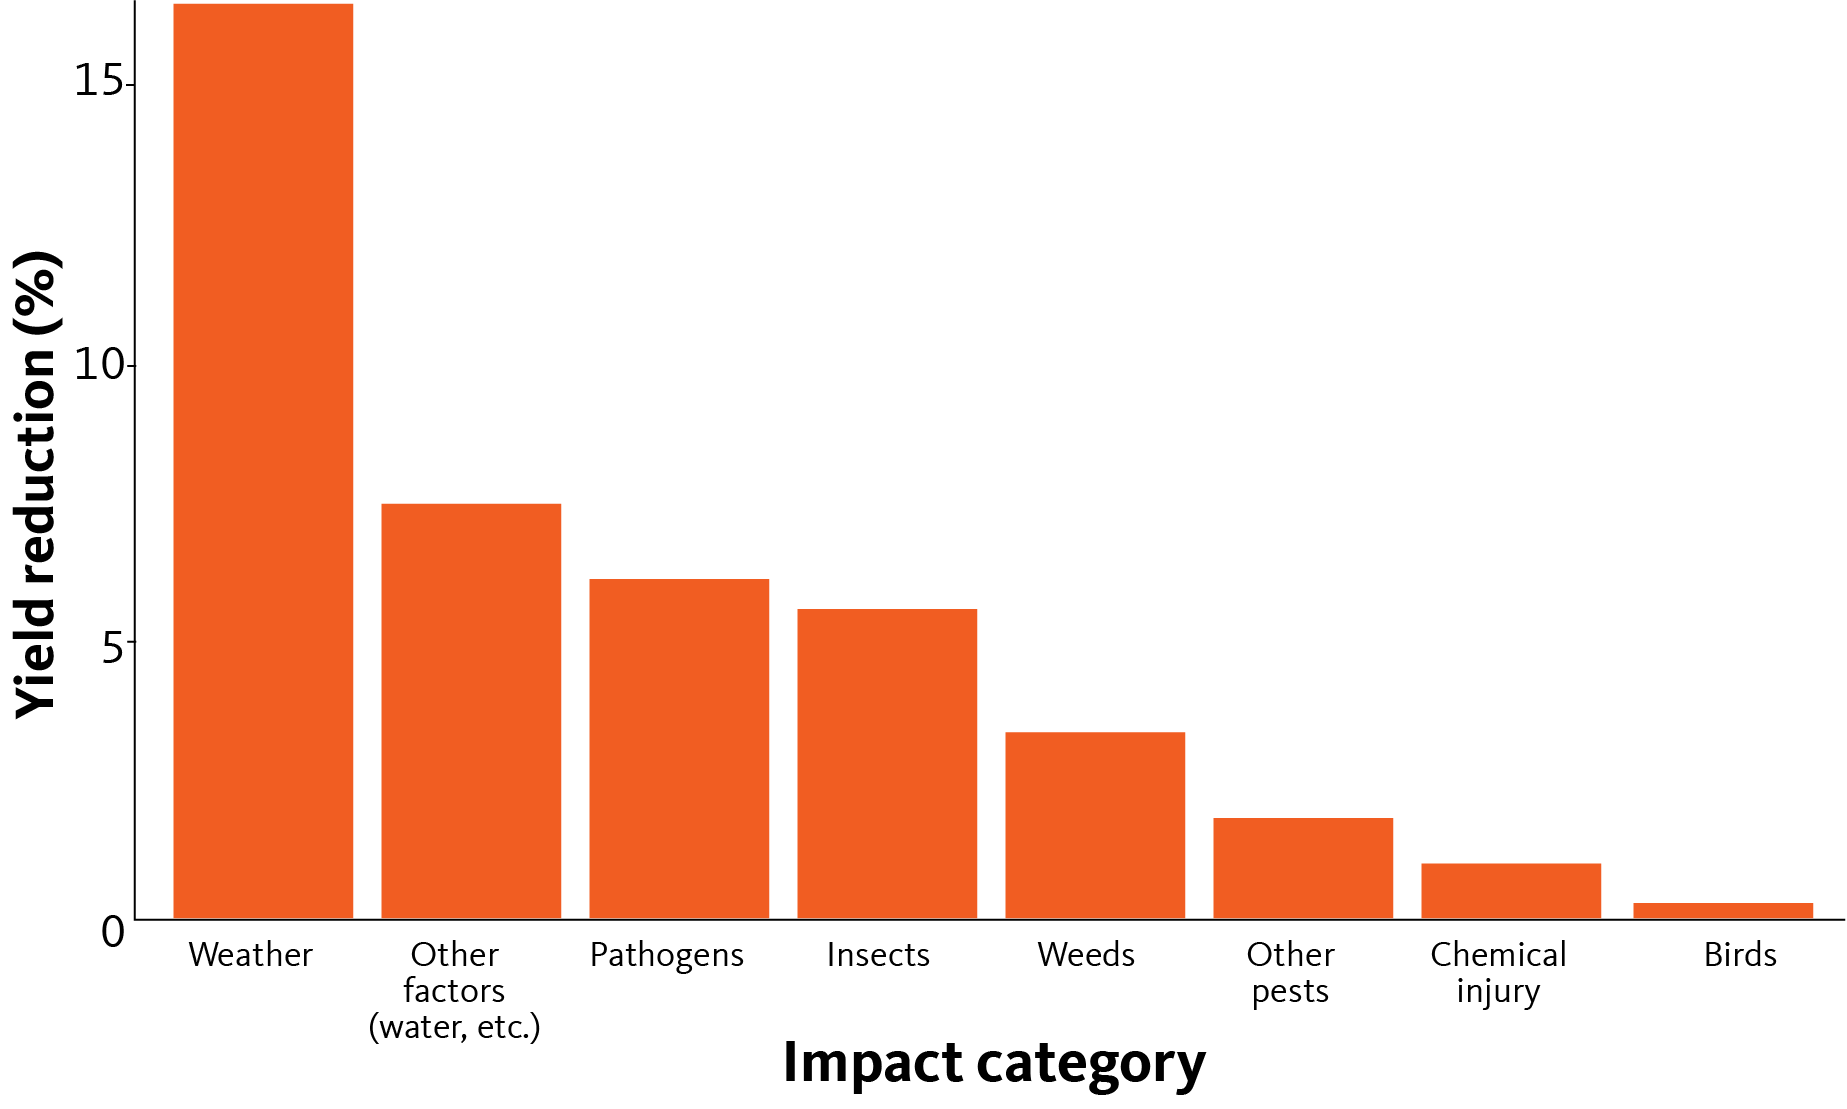
In the second part of the survey, respondents were asked to attribute their estimated overall yield loss to a list of biotic and abiotic yield loss factors, including damage from insects, diseases and weeds, as well as impacts from weather, irrigation and other management inefficiencies. Almost 15% of potential yield was reported as lost to biotic pest impacts. Diseases were reported as causing the largest biotic decline in yield at 6.1%, or 186 lb per acre, followed by invertebrates (170 lb, or 5.6%), and weeds (103 lb, or 2.2%) (Figure 2, Figure 3).
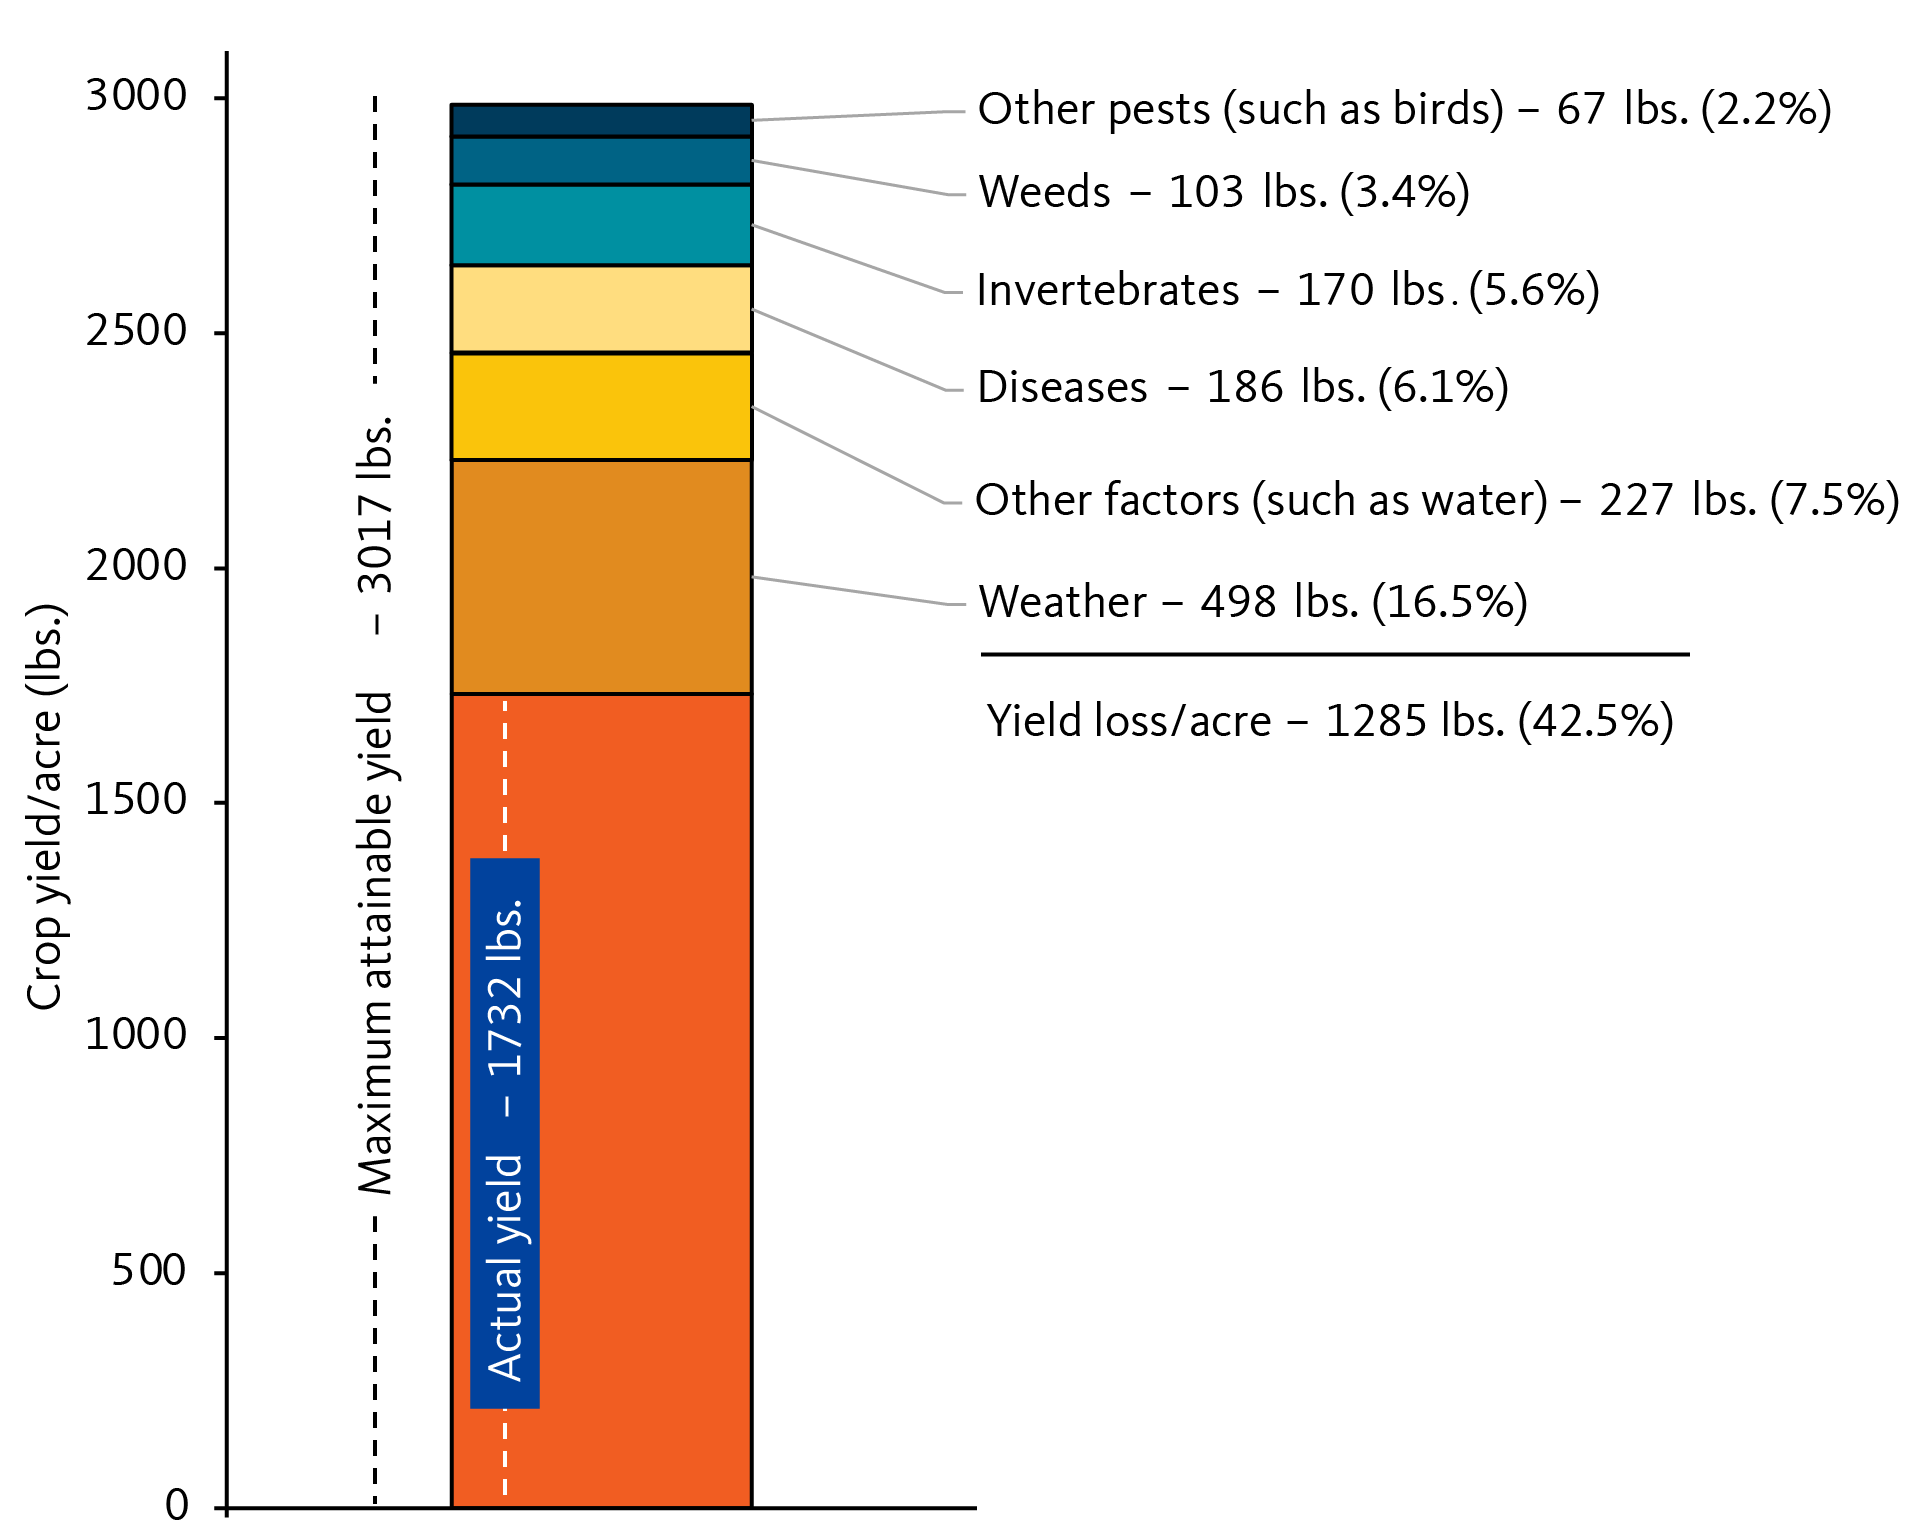
More than 24% of potential yield was reported as lost to abiotic impacts. The largest abiotic contributor to yield loss was the weather, leading to an estimated 16.2% reduction in yield, followed by the “Other factors” category, which includes management and irrigation-related issues (Figure 2).
Note: not all survey respondents experience all possible pests, which leads to variation in “n” throughout some of the figures in this report. For example, averages on acreage where the pest was present include only the data for those respondents who reported specific pests, pesticides or management actions. Our averages across all survey acreage include all responses, including those with nothing to report for certain pests or management, whose response is assumed to be zero (in terms of yield losses and management costs).
Yield loss and economic value by pest species
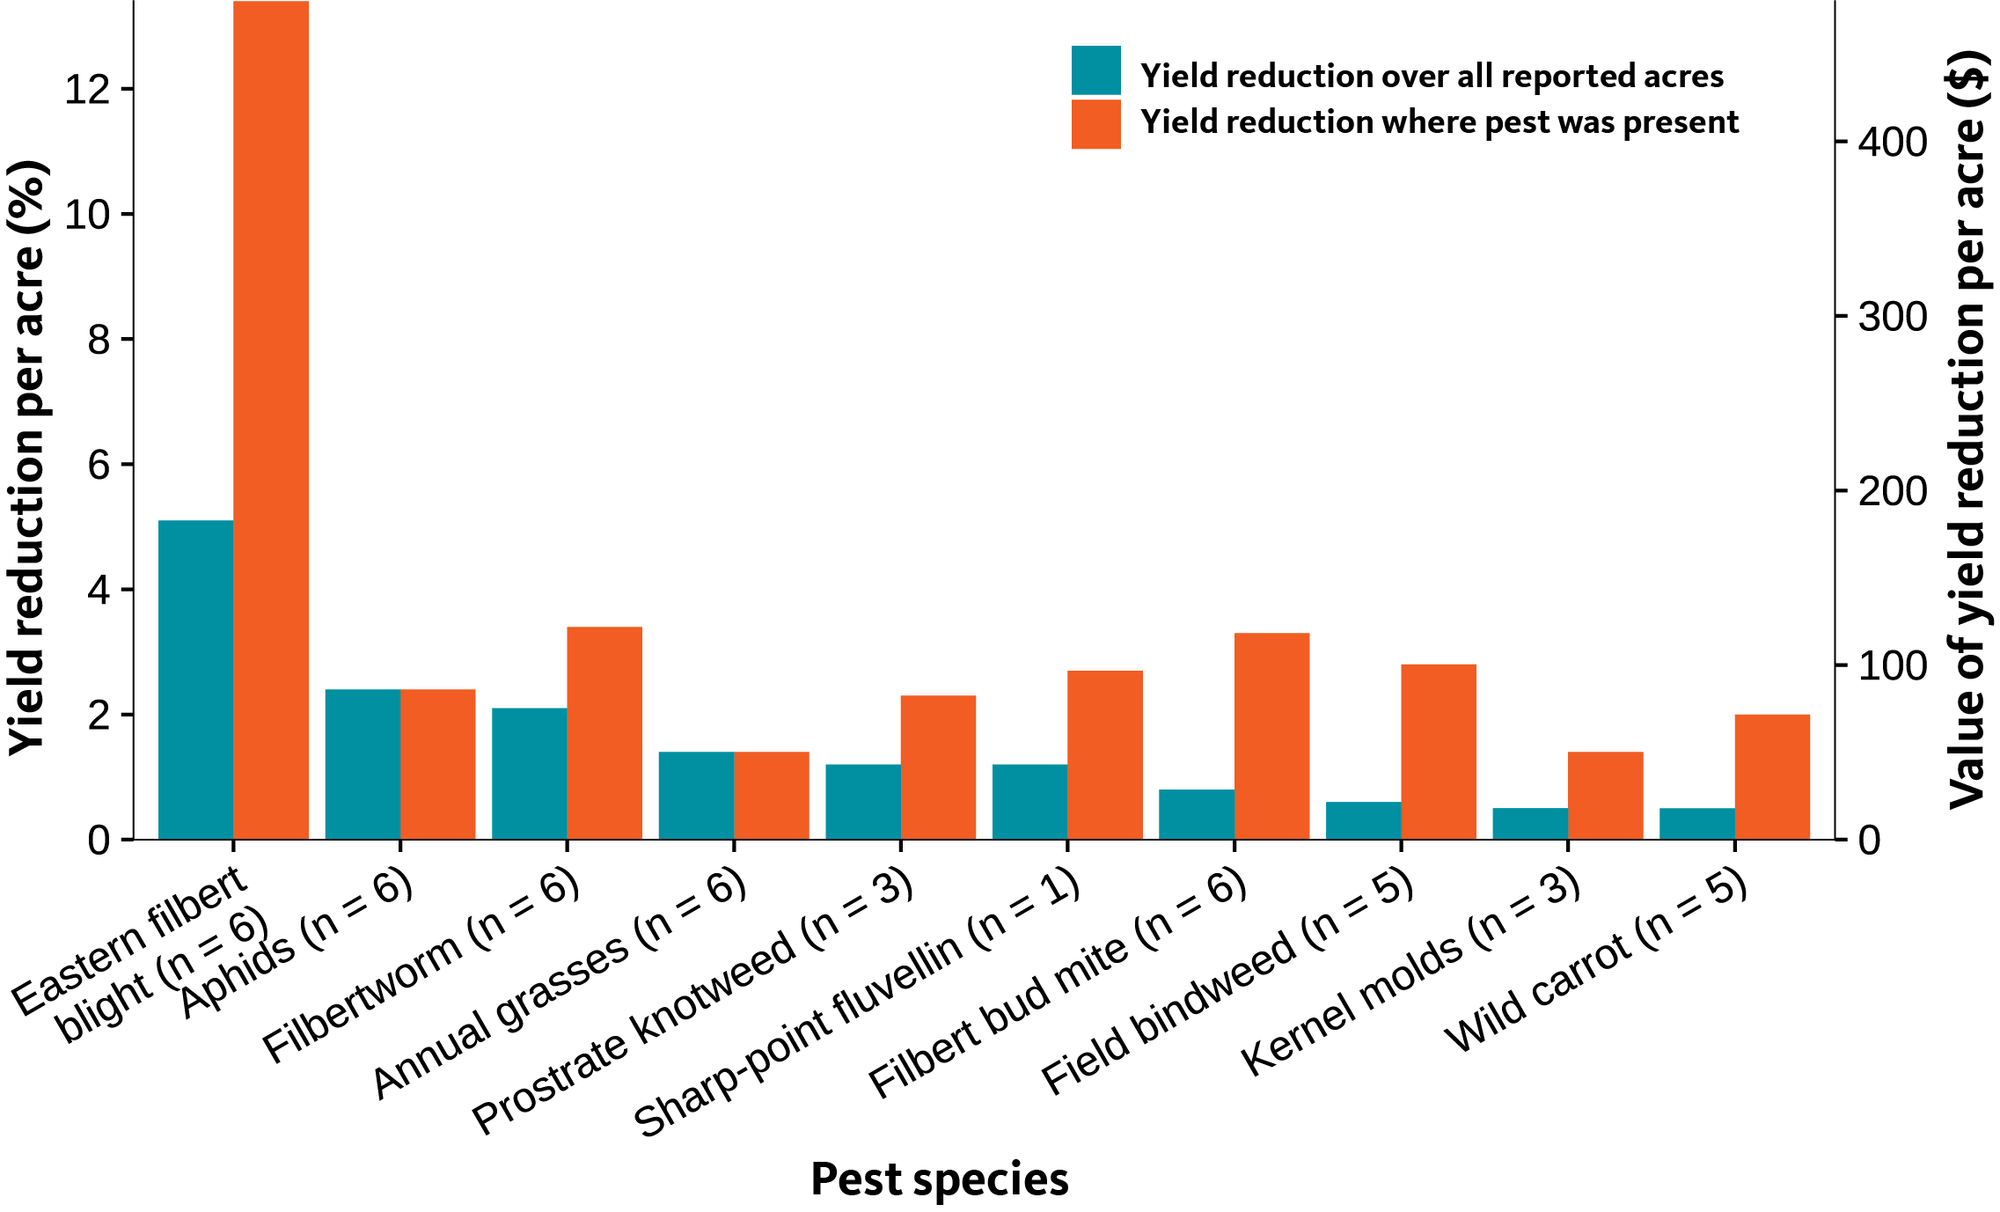
Within the biotic yield loss categories of invertebrate pests, diseases and weeds, respondents were asked to break down their estimates of losses even further. They were asked to report average percent yield losses on acreage where the pest was present. Respondents were not asked to estimate the loss in quality due to pest activity, though future surveys might ask for this subtle but important metric.
Of course, these yield losses are experienced by growers as economic losses. Using the average estimated price per pound reported by our survey respondents, we can assign a dollar value to the reported losses.
The figures below reveal the most economically damaging hazelnut pests overall and within each pest category (invertebrates, diseases and weeds). Within an agricultural system, these types of data can highlight priority pest issues for targeted research and education. These data can also inform the regulatory system when decisions are made regarding the tools available for management.
Eastern filbert blight was reported as causing the highest yield losses, both on acreage where it was present and across all surveyed acreage (Figure 3). In other words, where this particular disease occurs, it can cause significant yield loss and large economic losses, and it occurred on enough acreage to have a significant impact overall. The economic impact of any given pest or disease may be lessened if it is not widespread. For instance, filbert bud mite is reported to have caused almost 4% yield loss on acreage where it was present, but because it was not widespread, it was responsible for only about 1.5% yield loss when averaged across all acres.
Pests causing over highest yield reduction per acre
Single species assessments of yield reduction
We analyzed reported impacts to yield losses pest by pest, both on acreage where the pest was present and across all reported acreage. As with the top pests above, these two scenarios differ based on the extent of infestation.
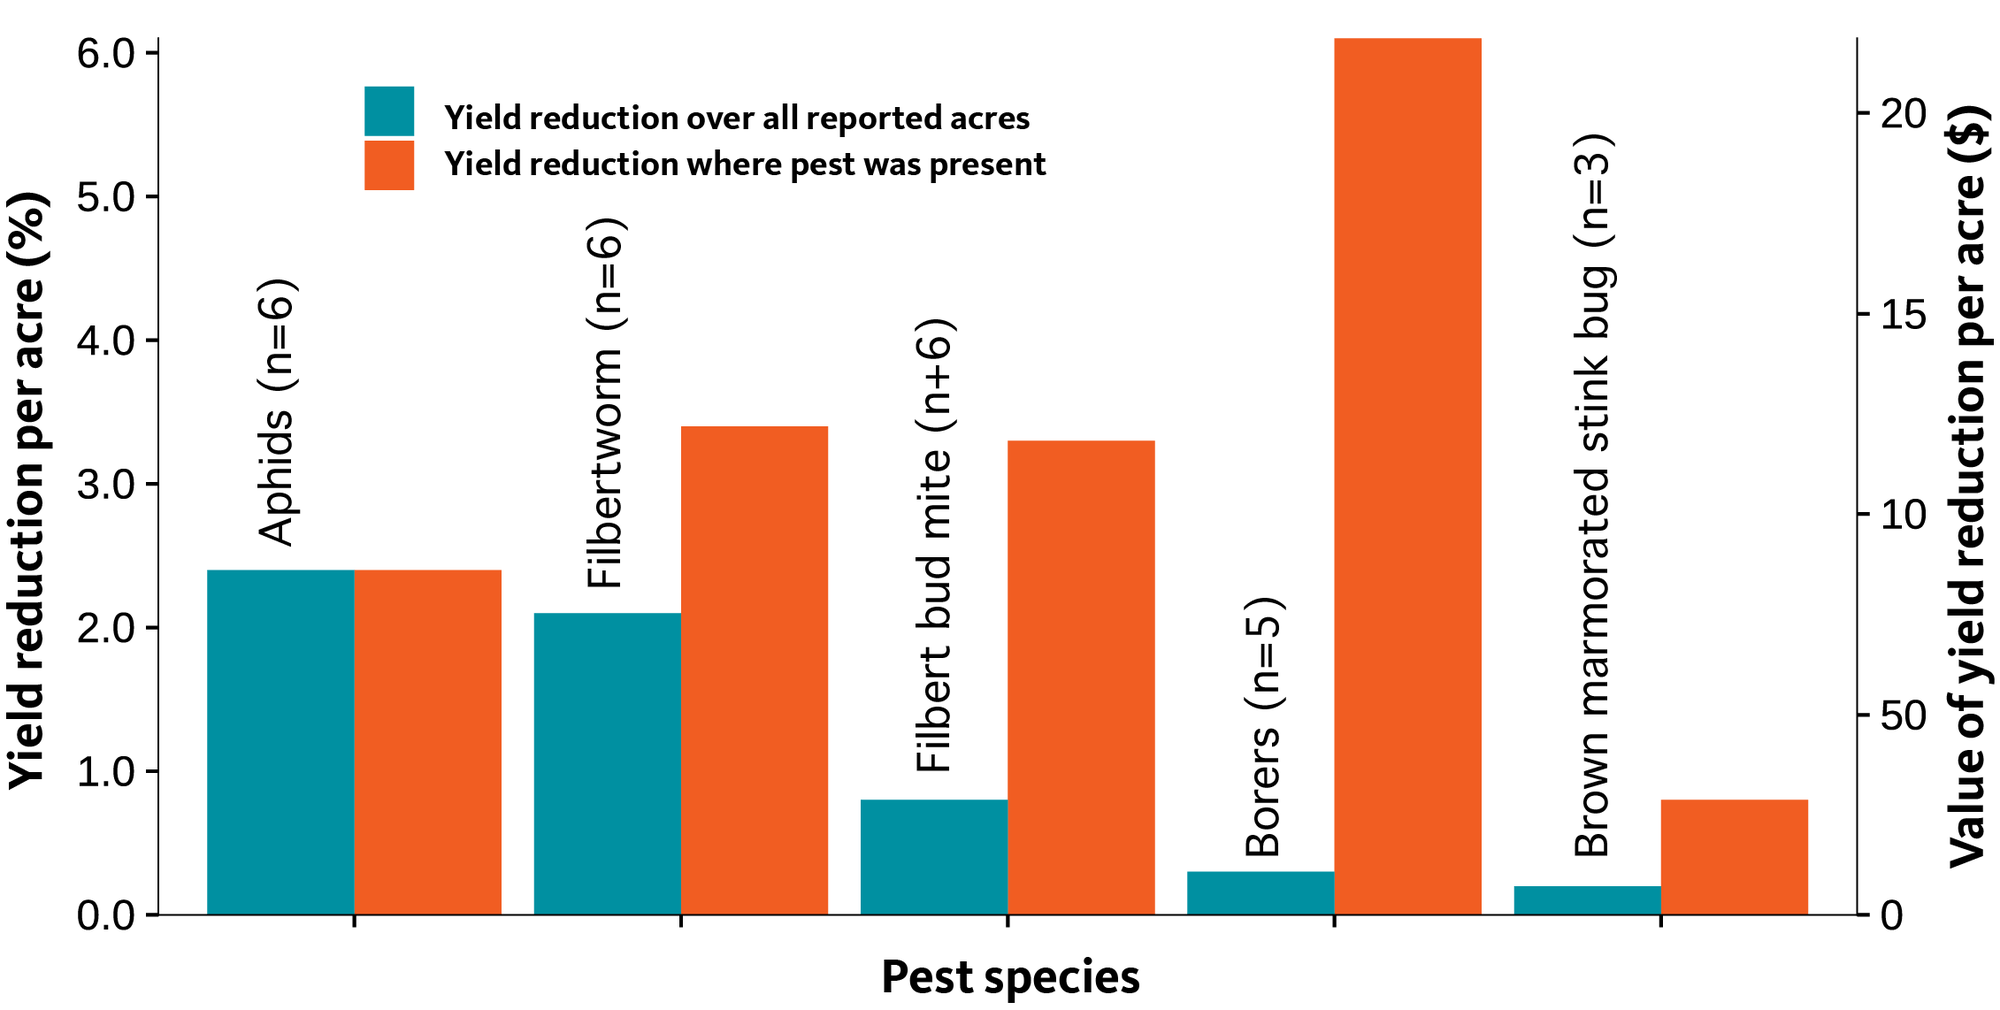
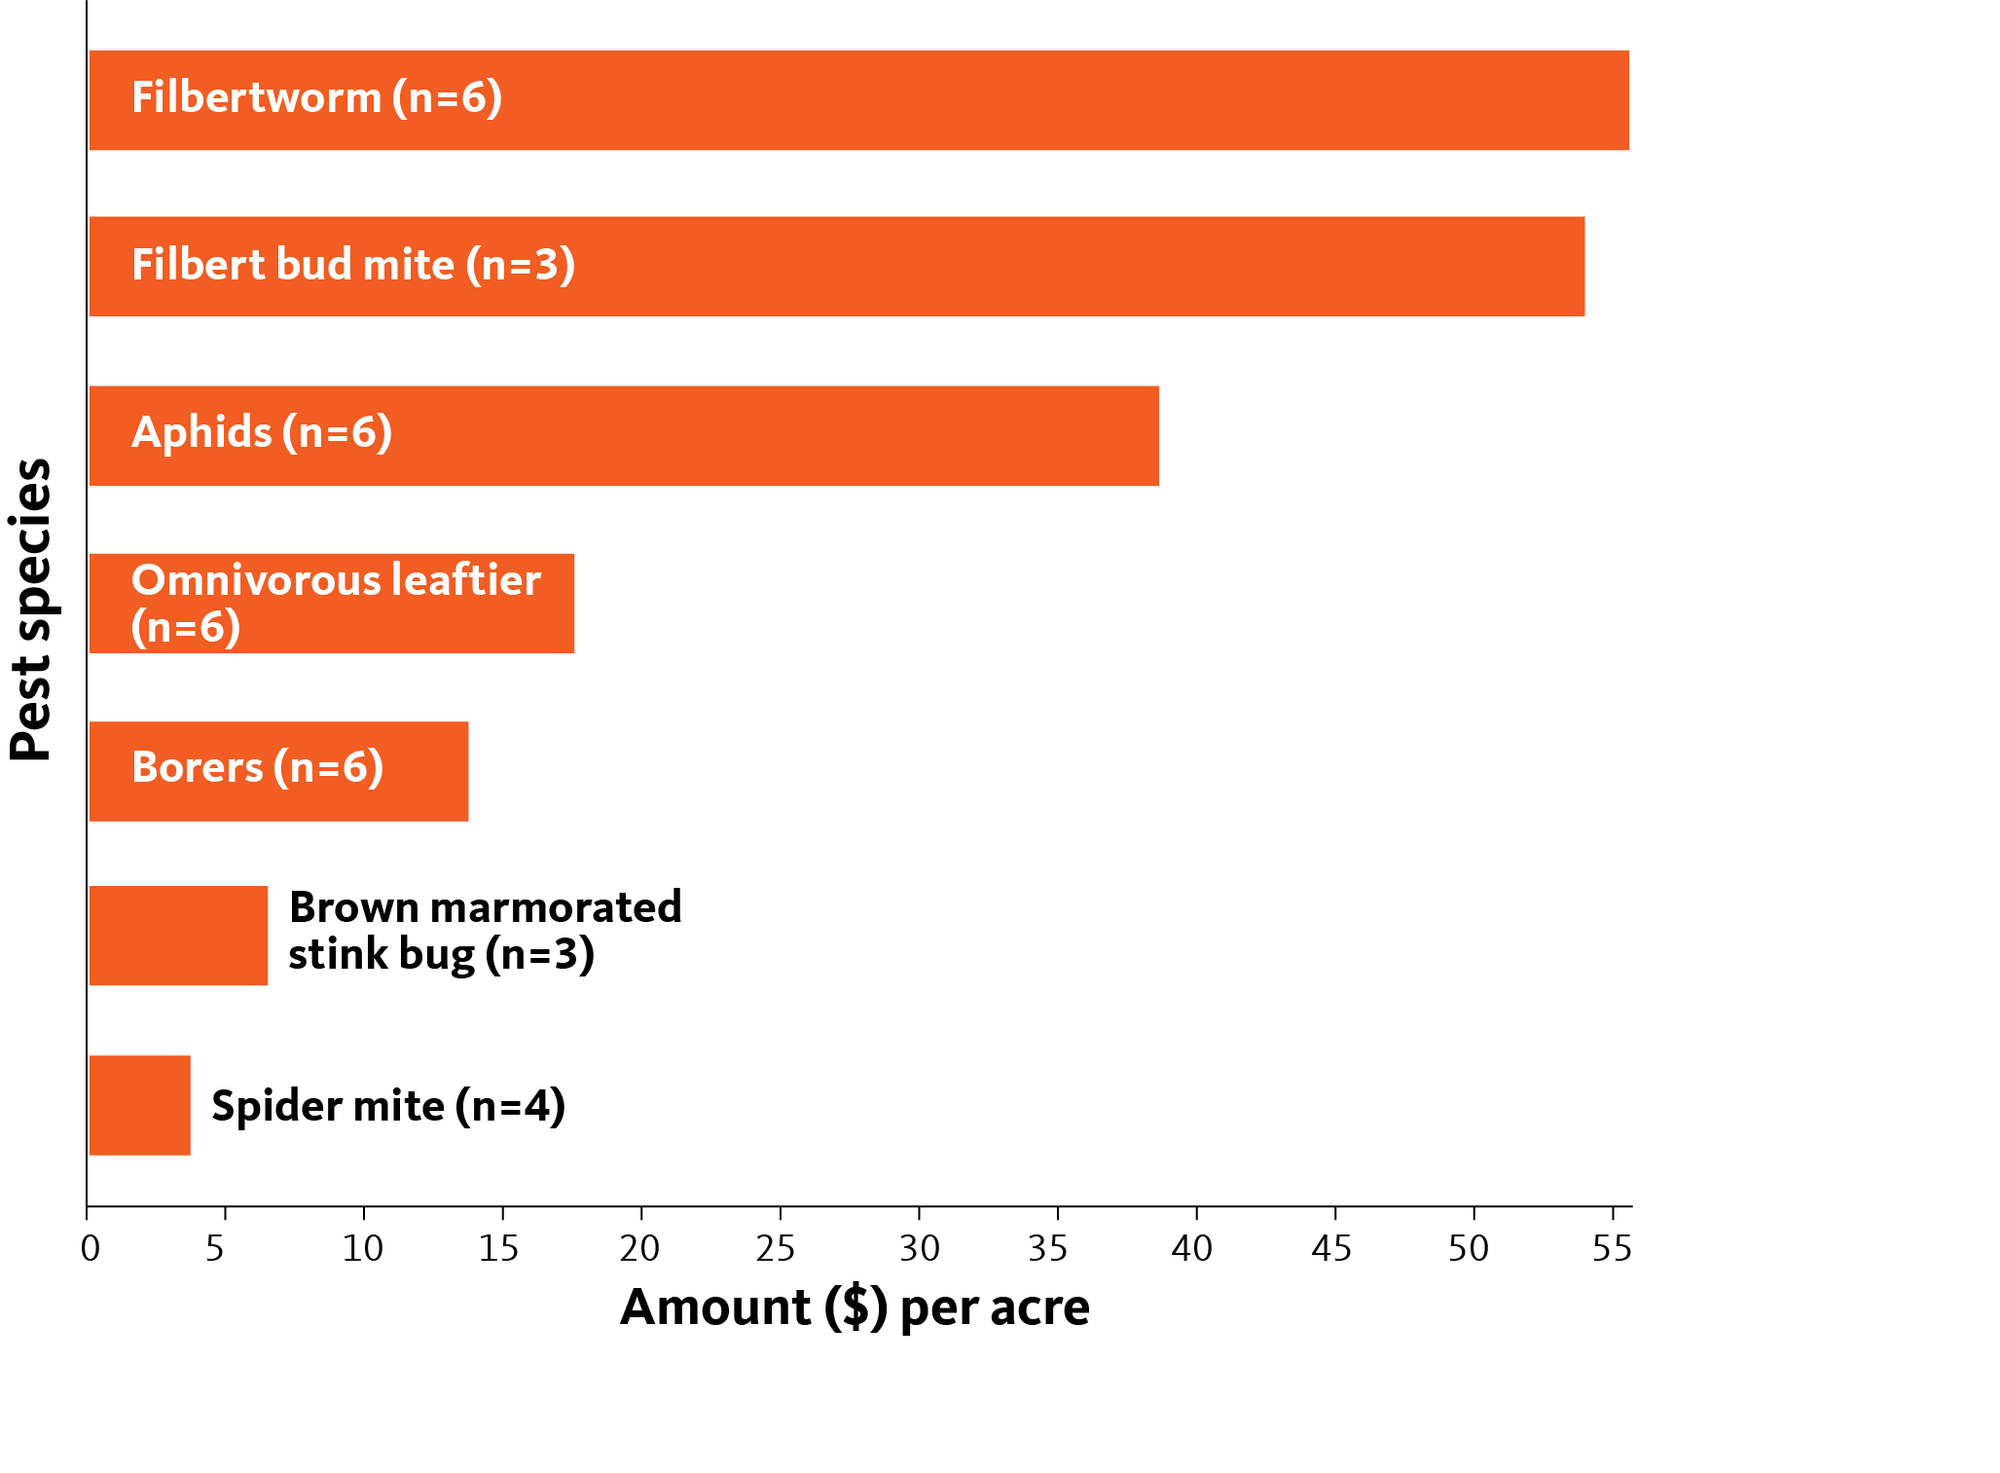
Borers, filbertworm and filbert bud mite were the most damaging invertebrate pests on acreage where they were reported (Figure 4). Factoring in the extent of infestation across all acres reveals that aphids are a key pest surveywide, while the overall impact of borers and filbert bud mites was markedly less. (Figure 4).
Yield losses from invertebrate pests
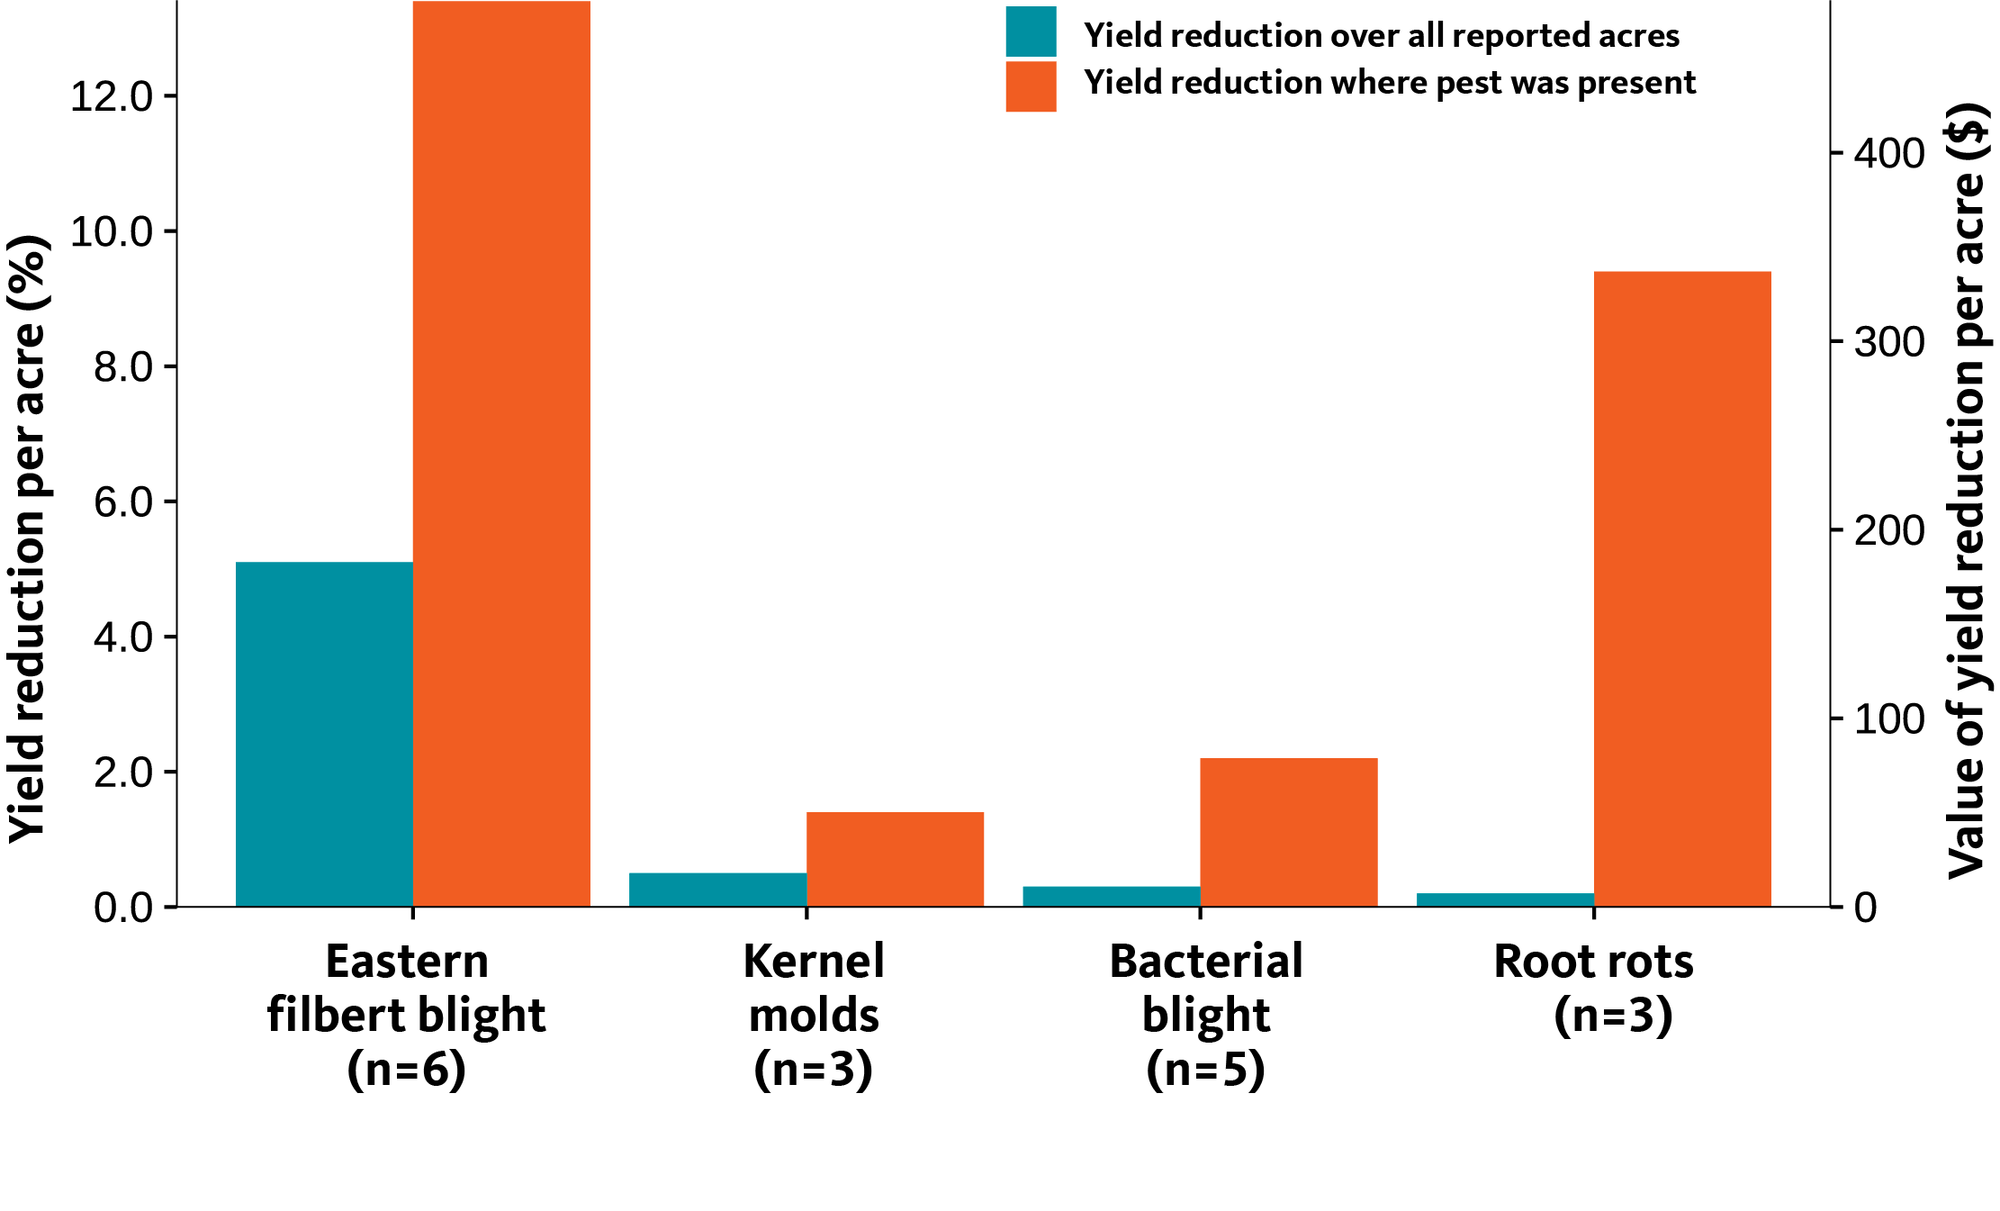
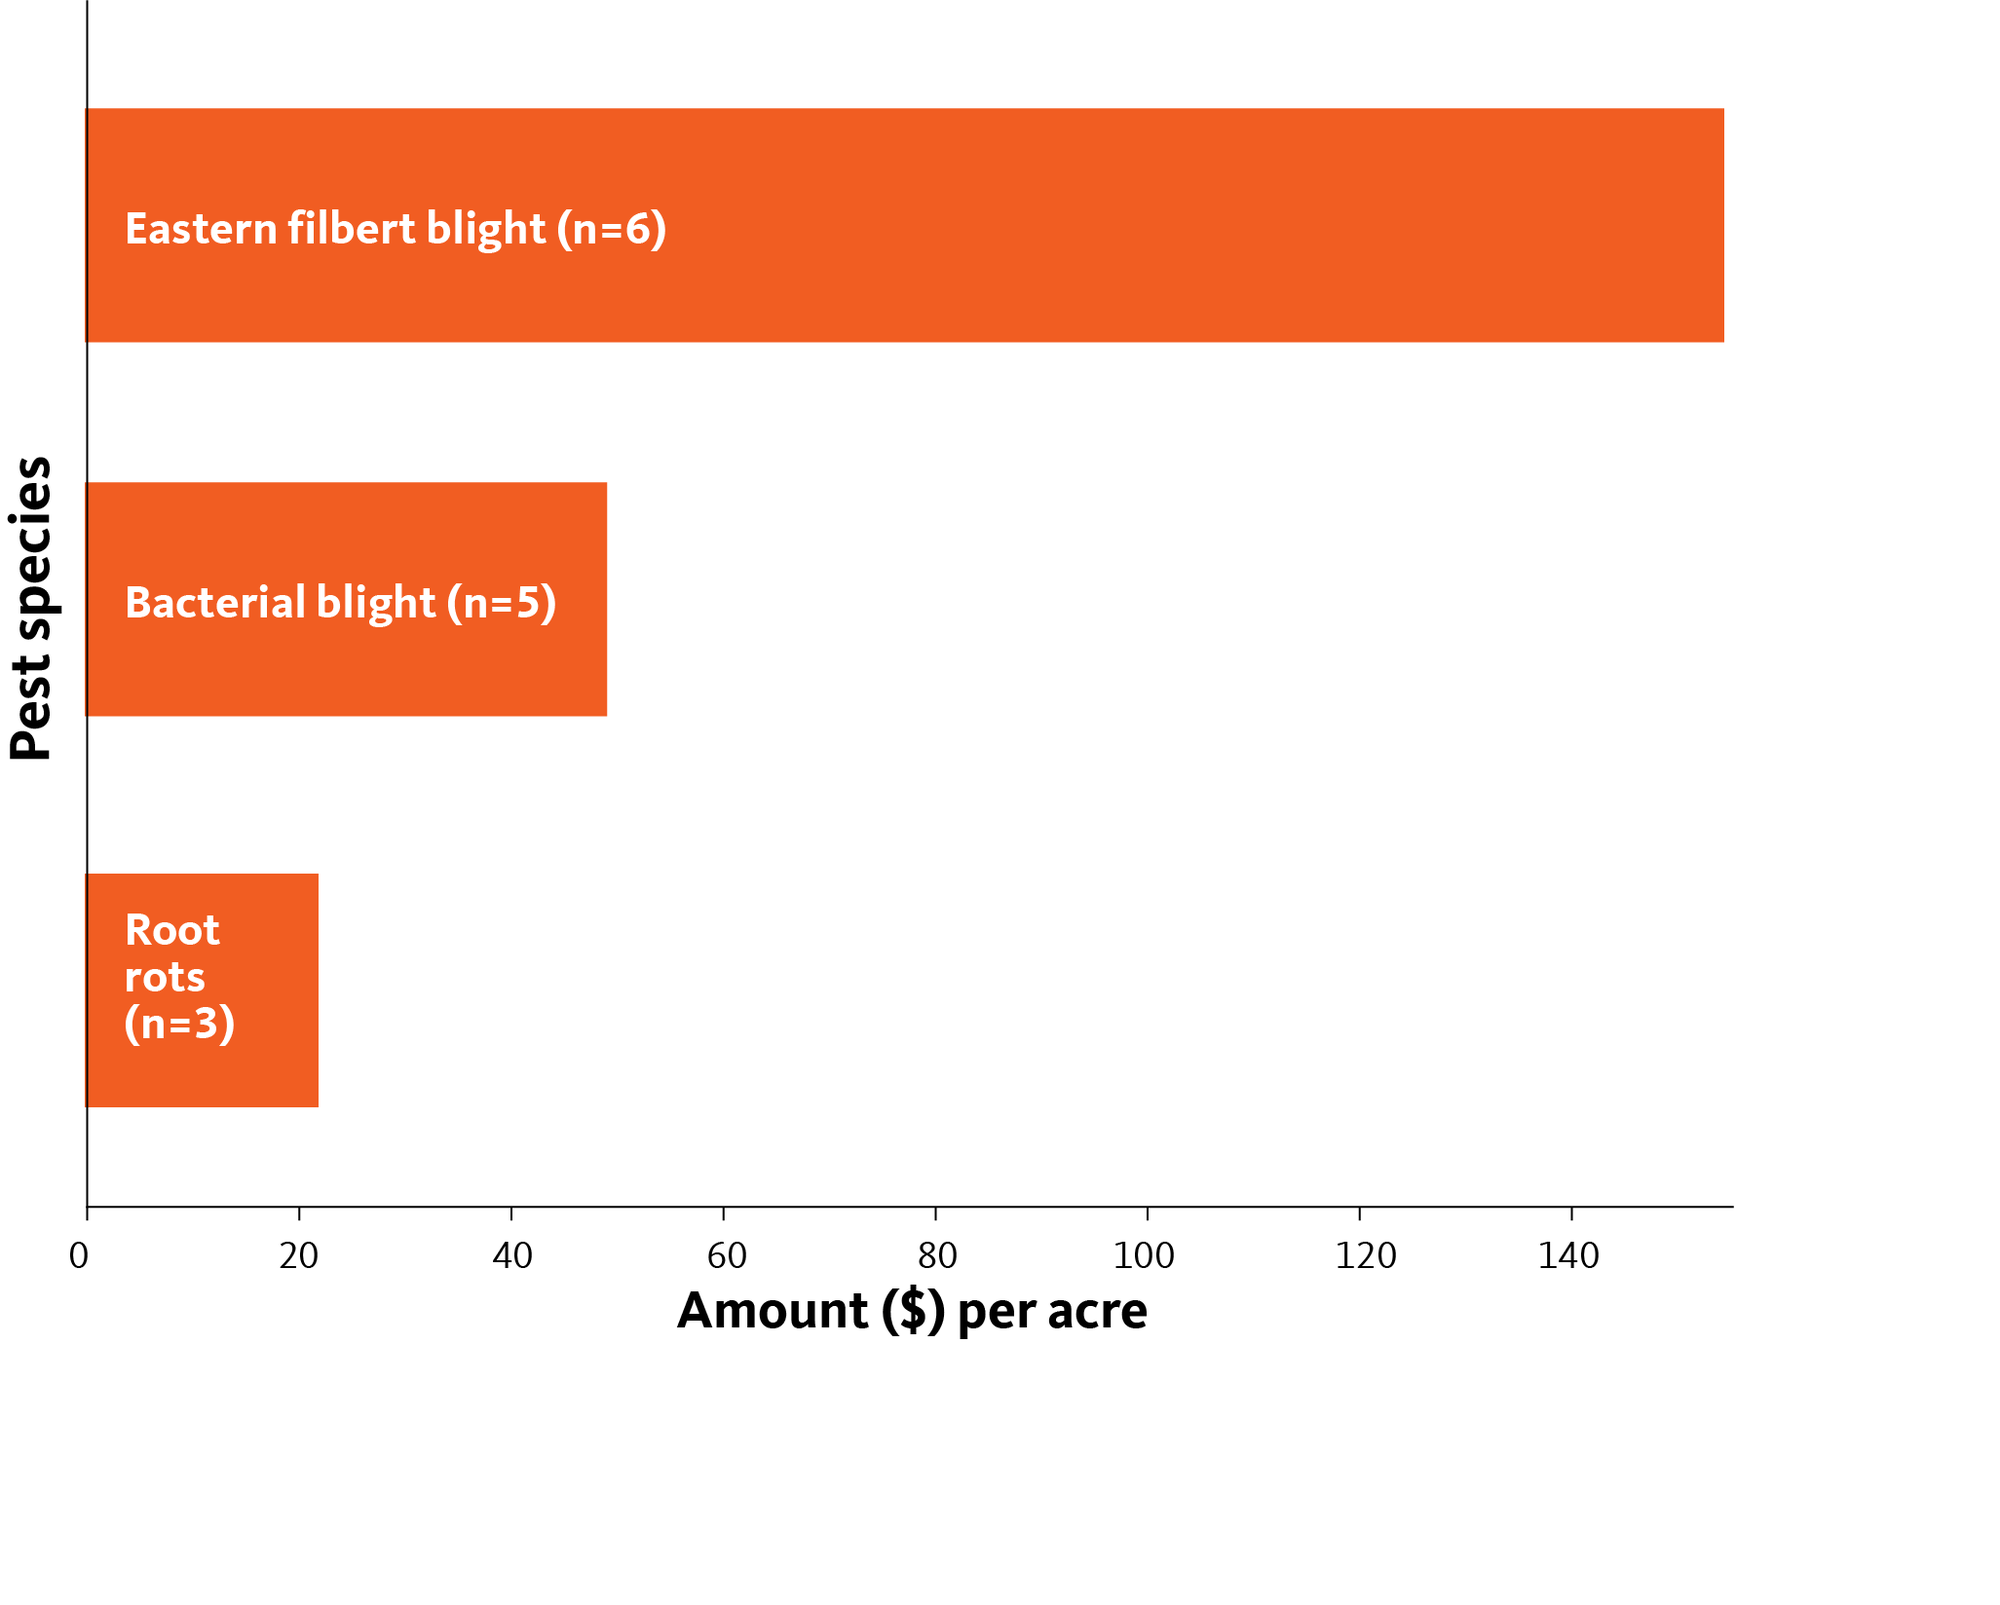
We see similar differences between the list of most damaging diseases on acreage where the disease was present versus over all reported acres when analyzing losses to diseases and weeds. But it is clear that where a grower has Eastern filbert blight or root rots, they can expect to incur significant yield losses on the impacted acres.
Yield losses from diseases
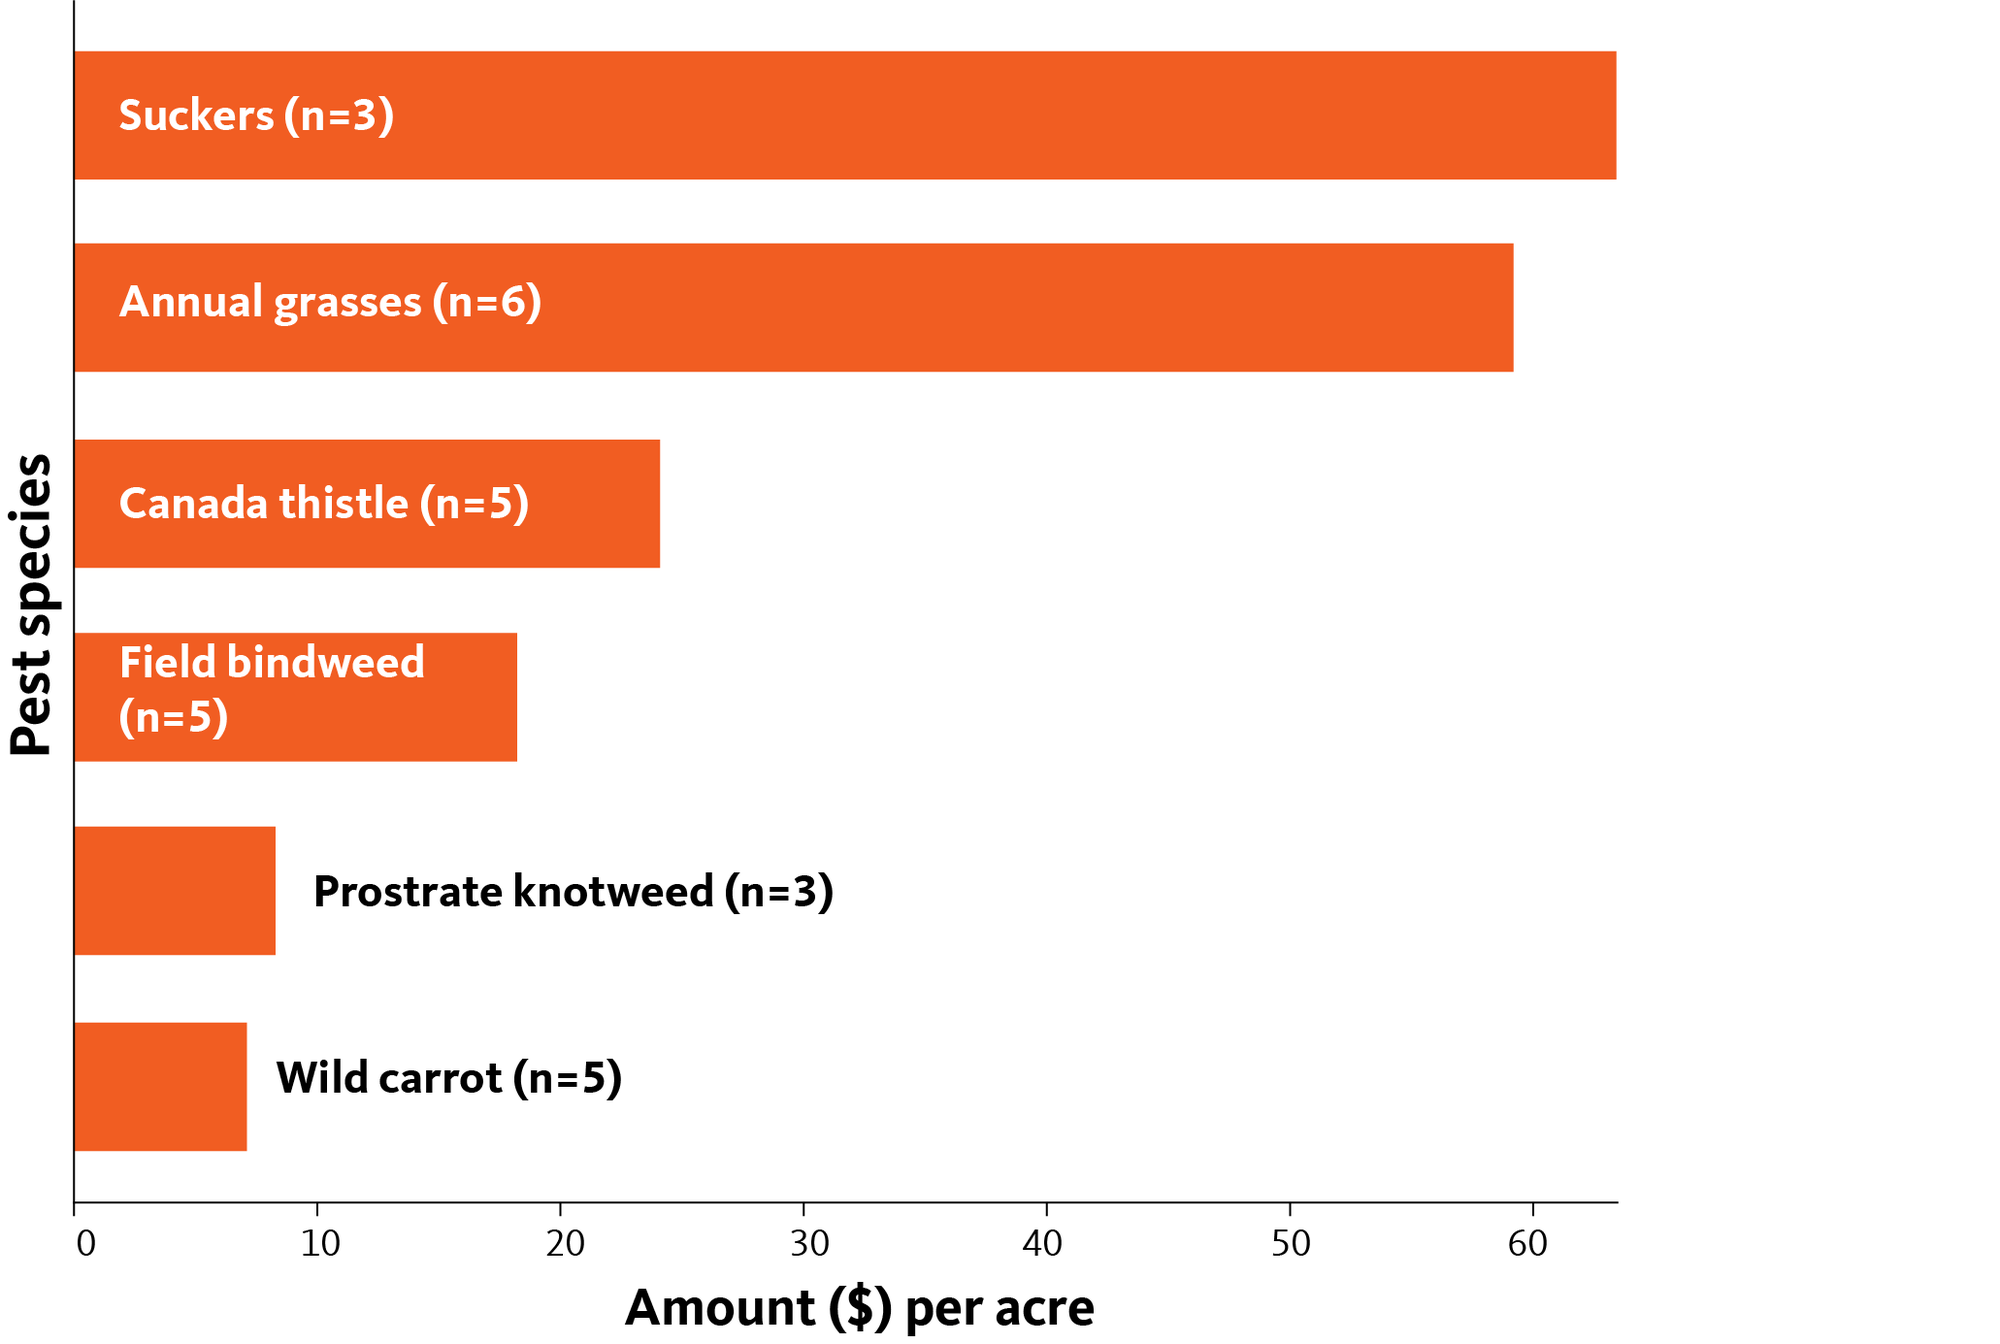
Yield losses from weeds
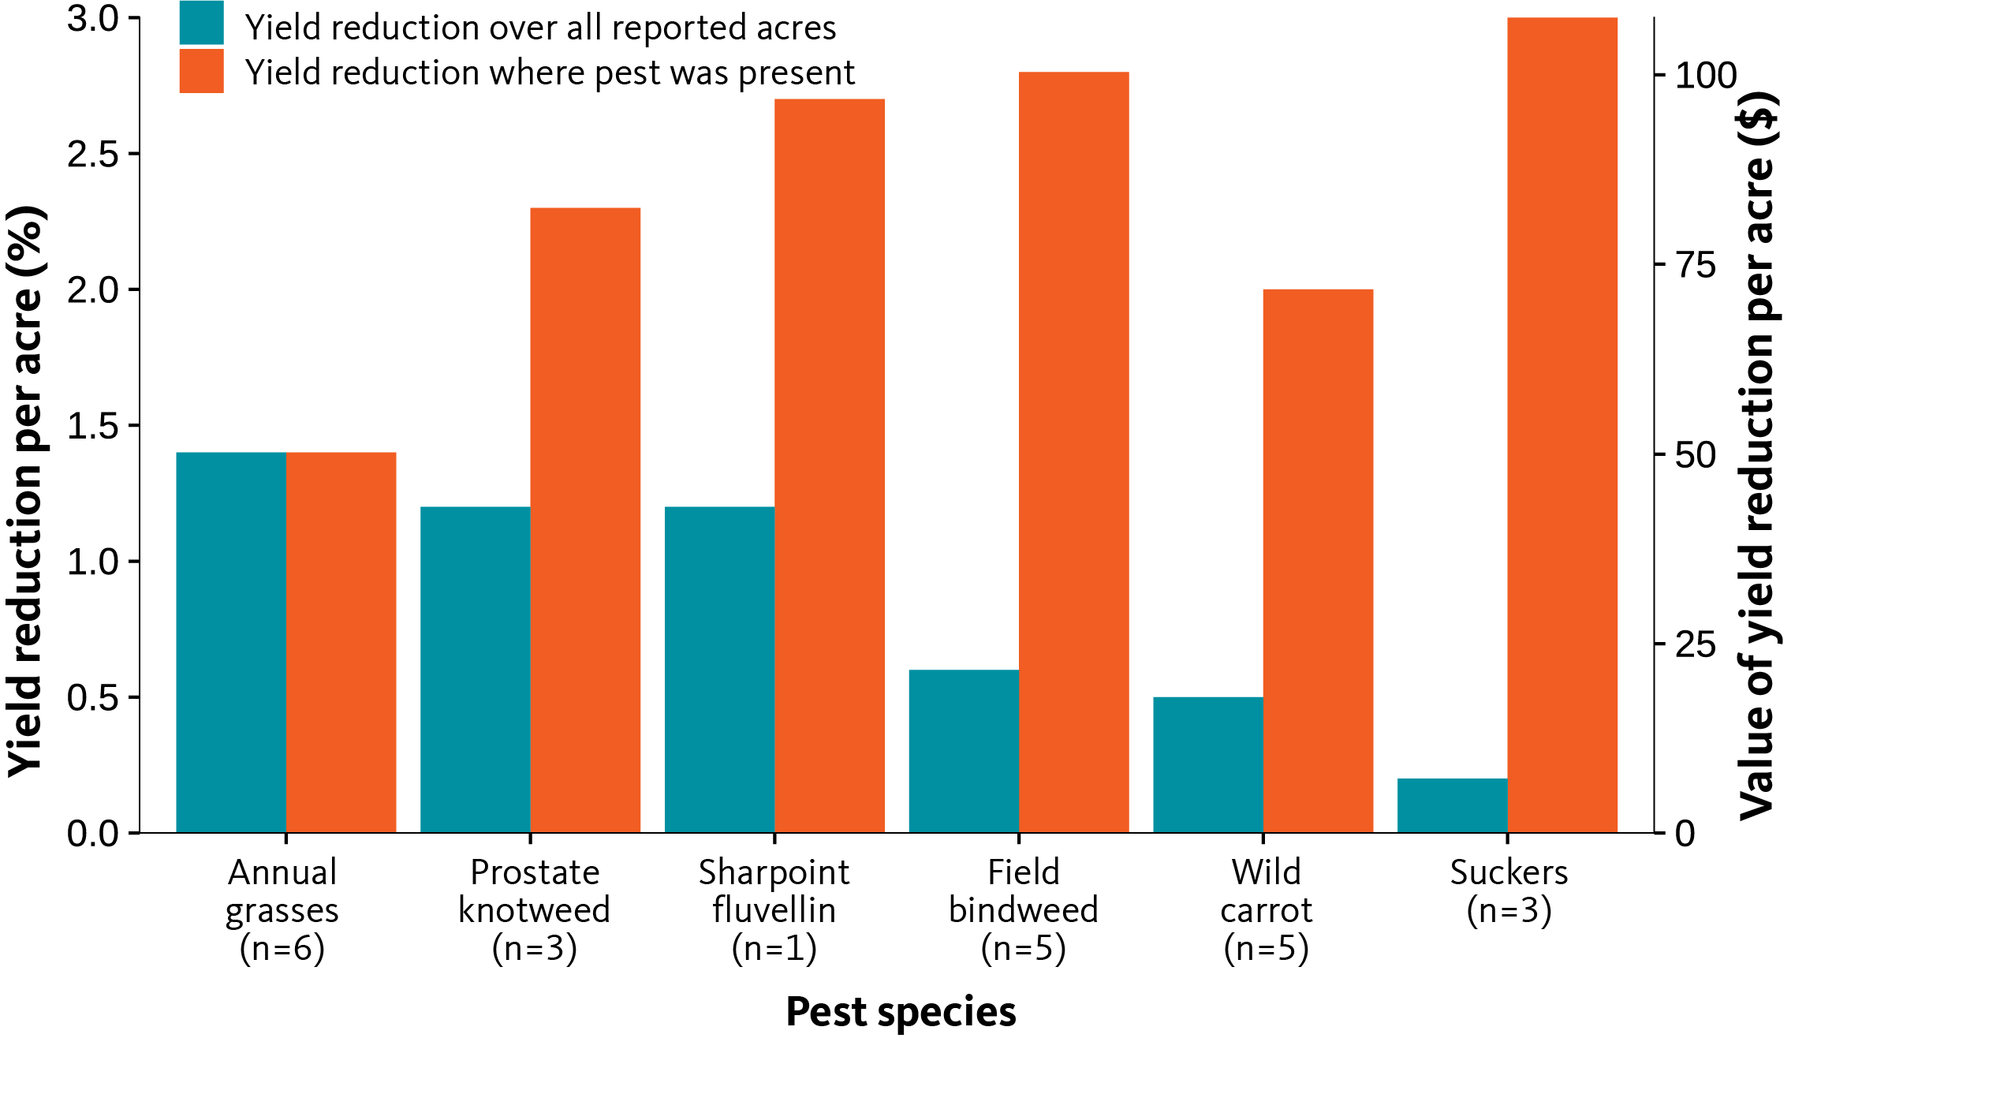
Specific yield losses caused by different weed species are more difficult to estimate. However, annual grasses appear to be a key pest for the Oregon hazelnut industry. Prostrate knotweed (Polygonum aviculare) was reported by half of respondents, and was responsible for an estimated 2.3% reduction in yield on acreage where present. Field bindweed (Convolvulus arvensis), wild carrot (Daucus carota) and suckers all impact yield where present (Figure 6).
Acreage infested and treated, by pest
Percent acres infested, by pest species
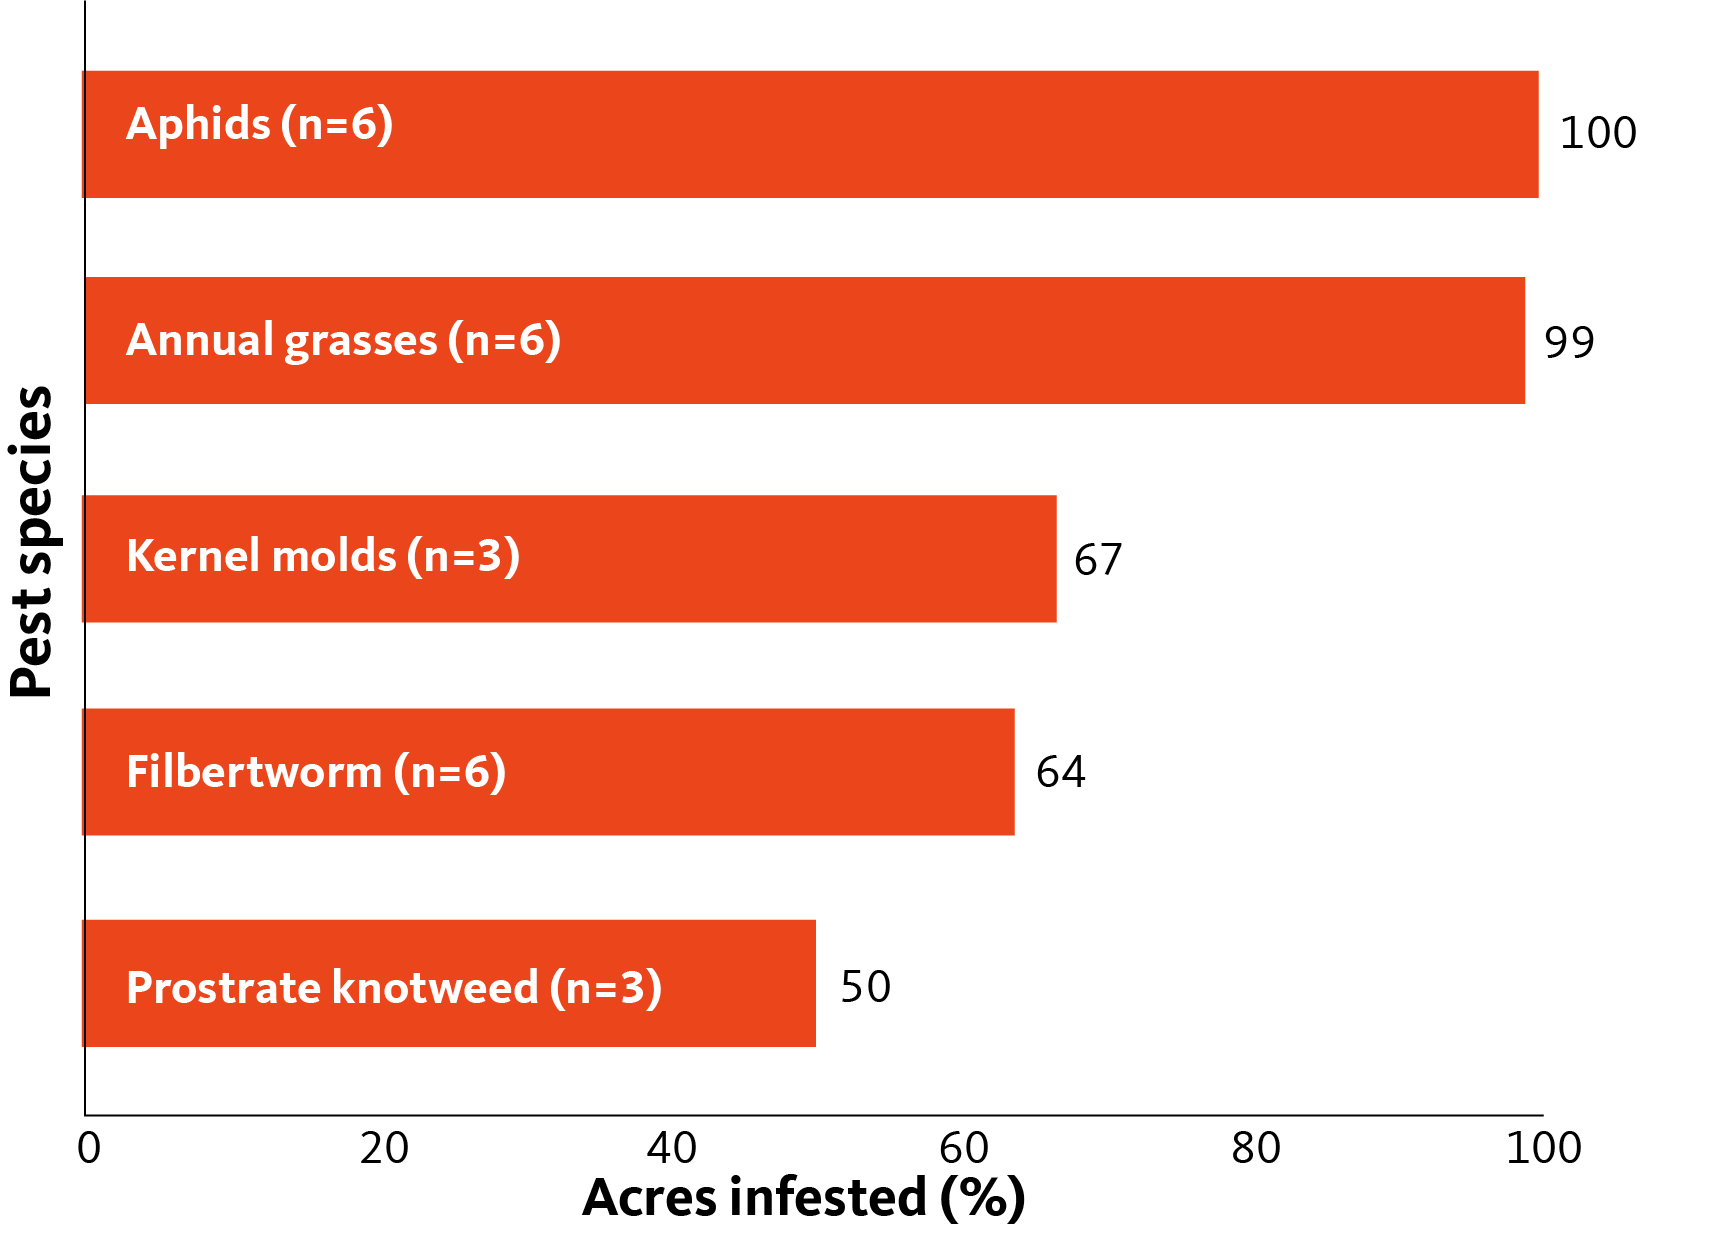
The potential for any given pest to have a significant impact across the industry depends on a combination of the yield loss it causes where it is present and the level of infestation across the industry as a whole. The figures below show pests infesting (present on) over 50% of the hazelnut acreage we surveyed, followed by figures showing infestation levels by all invertebrates, diseases and weeds, respectively.
At least five pests were reported as infesting more than half of the hazelnut acres we surveyed, many of which are causing significant losses in yield (Figure 7).
Pests infesting more than 50% of hazelnut acreage surveyed
Figures 8, 9 and 10 show the extent of infestation for invertebrates, diseases and weeds, respectively, and reveal a variety of pests with high rates of infestation among our surveyed acres.
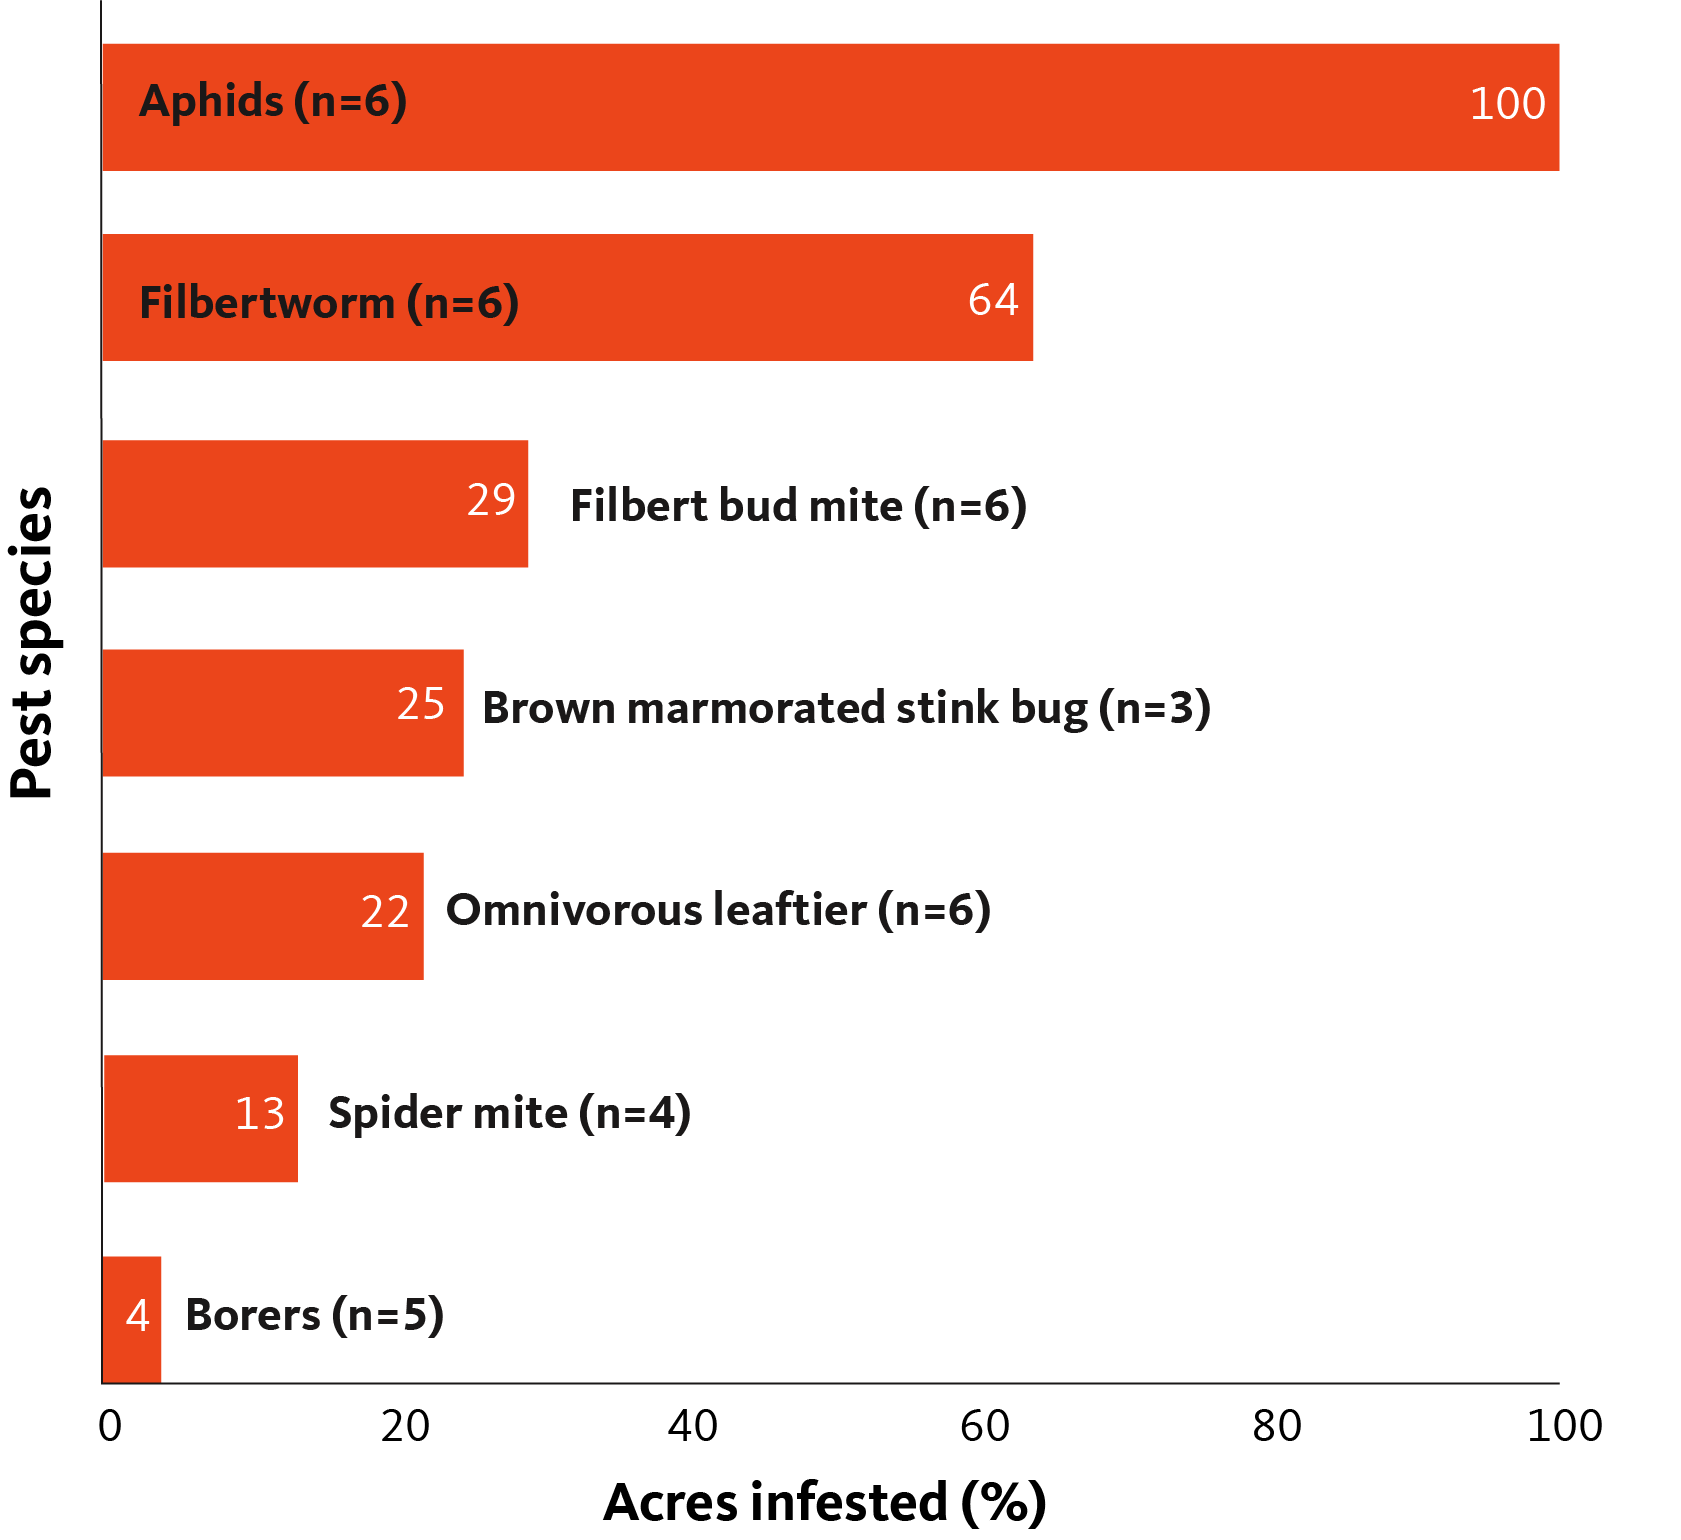
Infestation by invertebrate pests
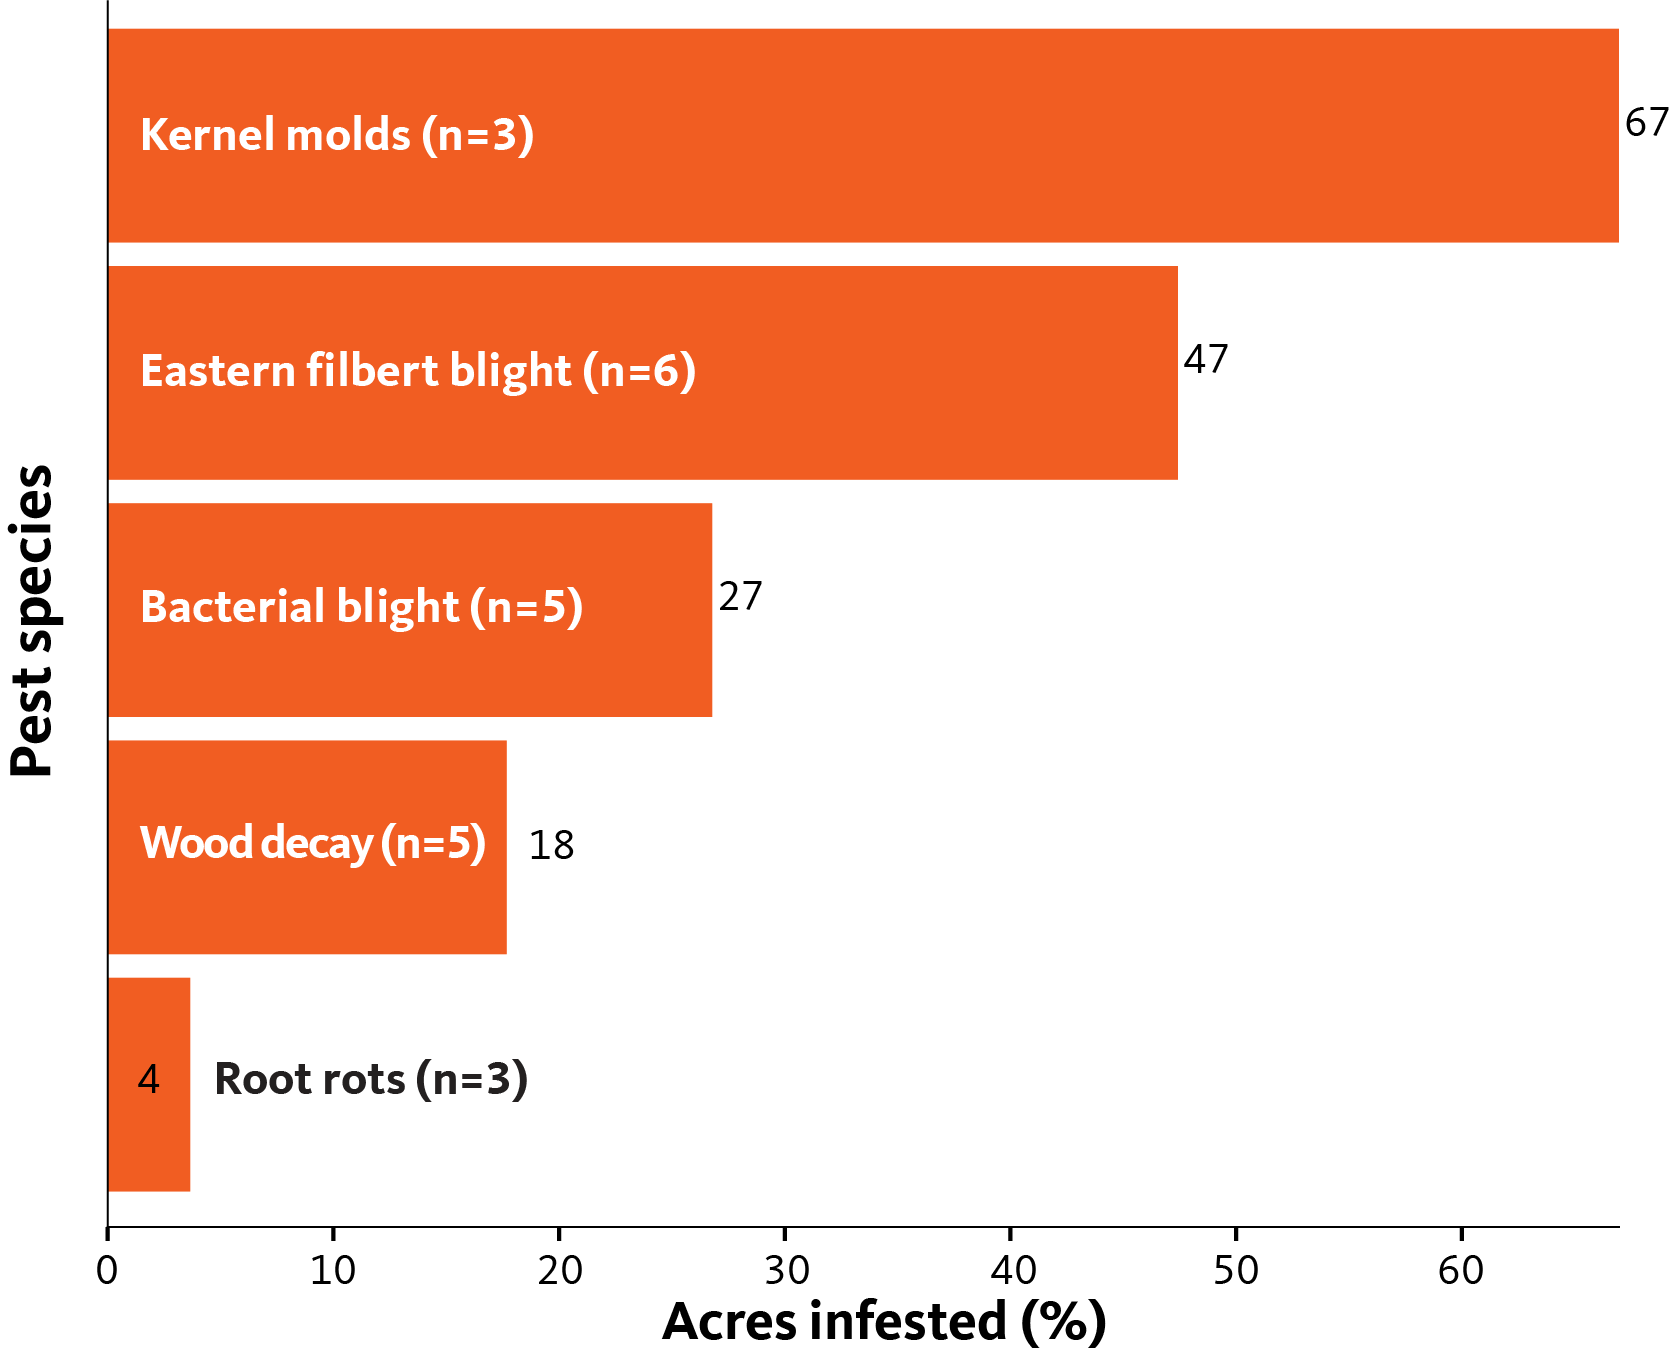
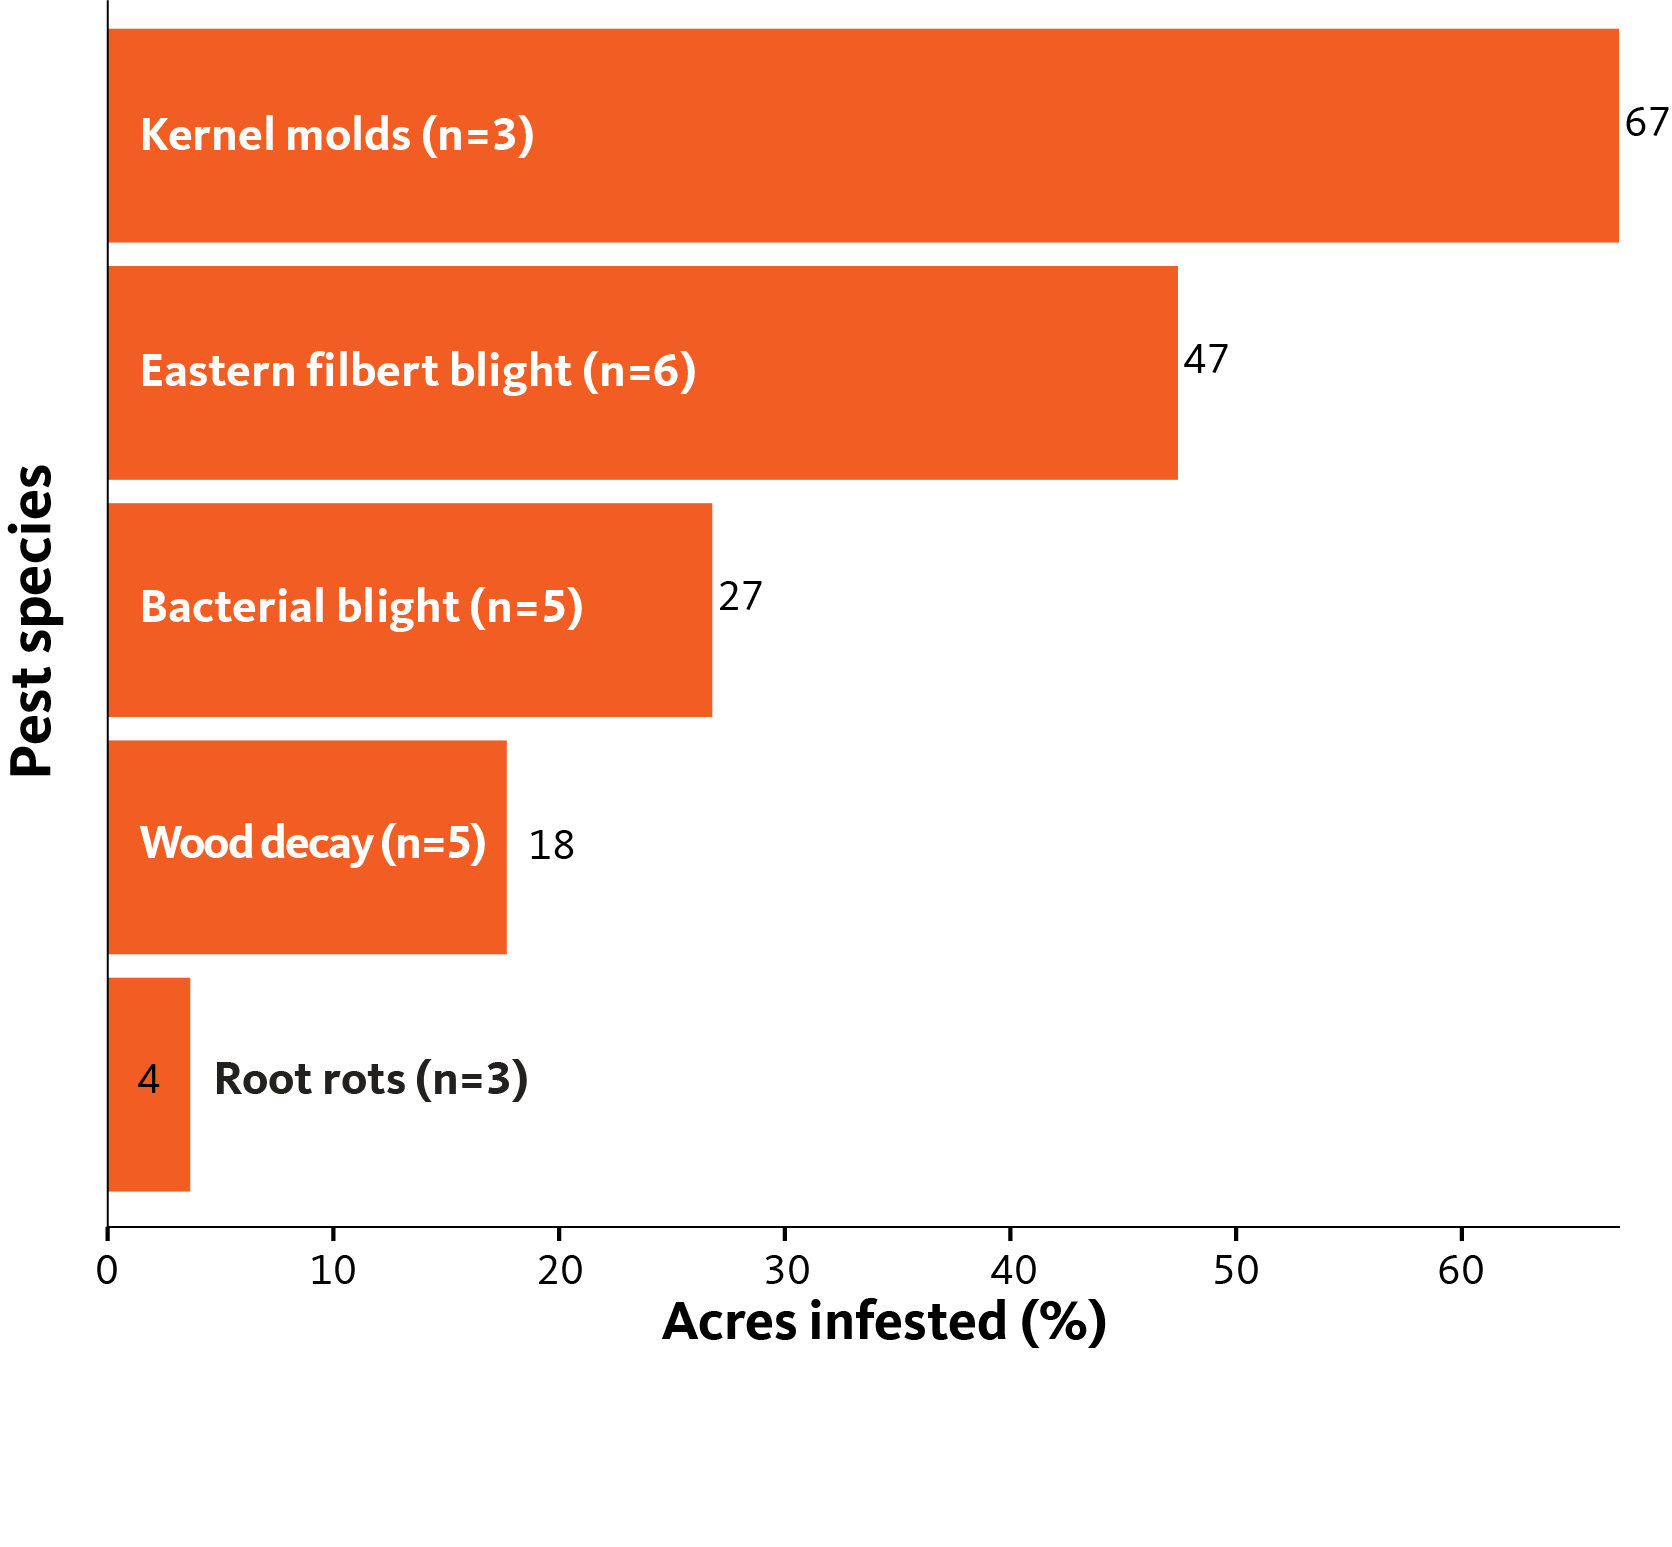
Infestation by diseases
Infestation by weeds
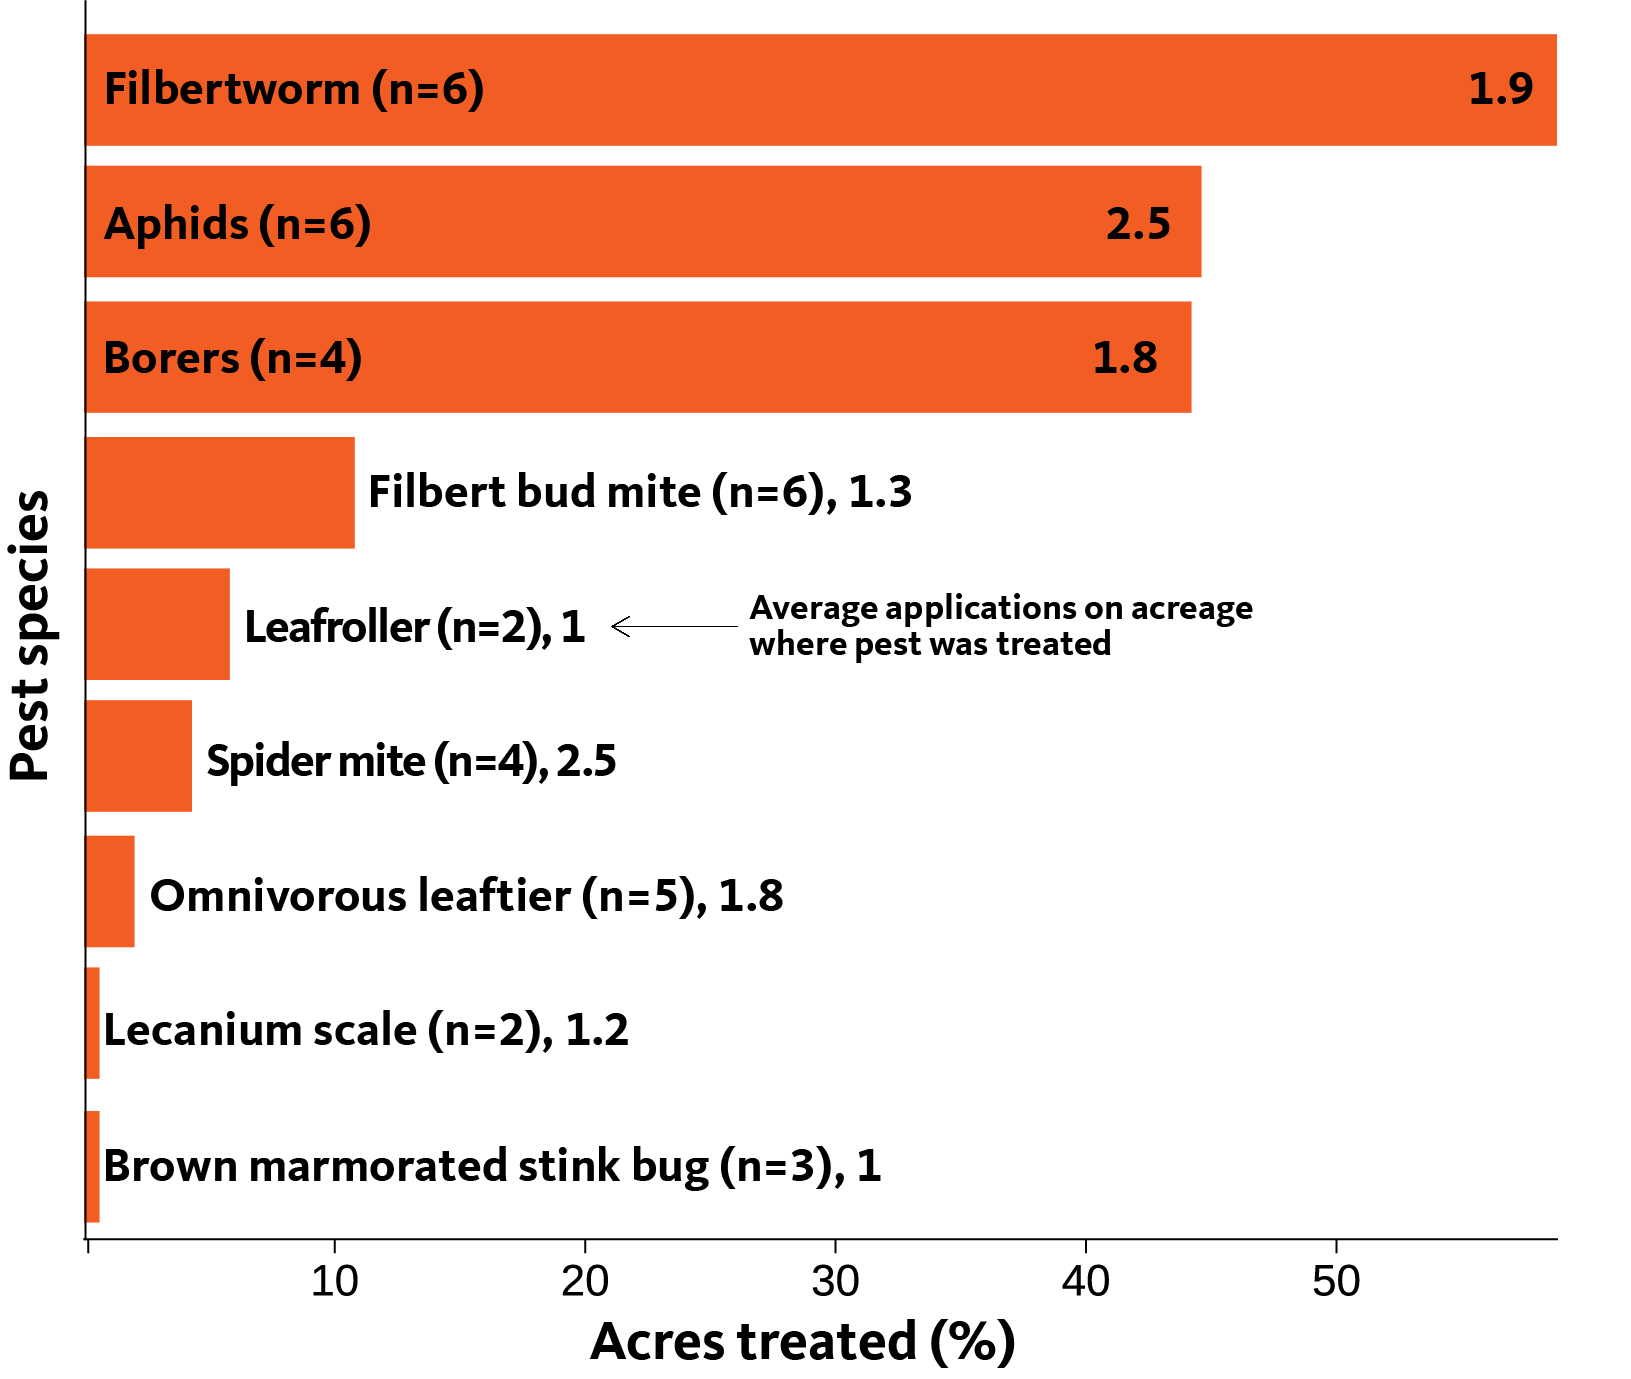
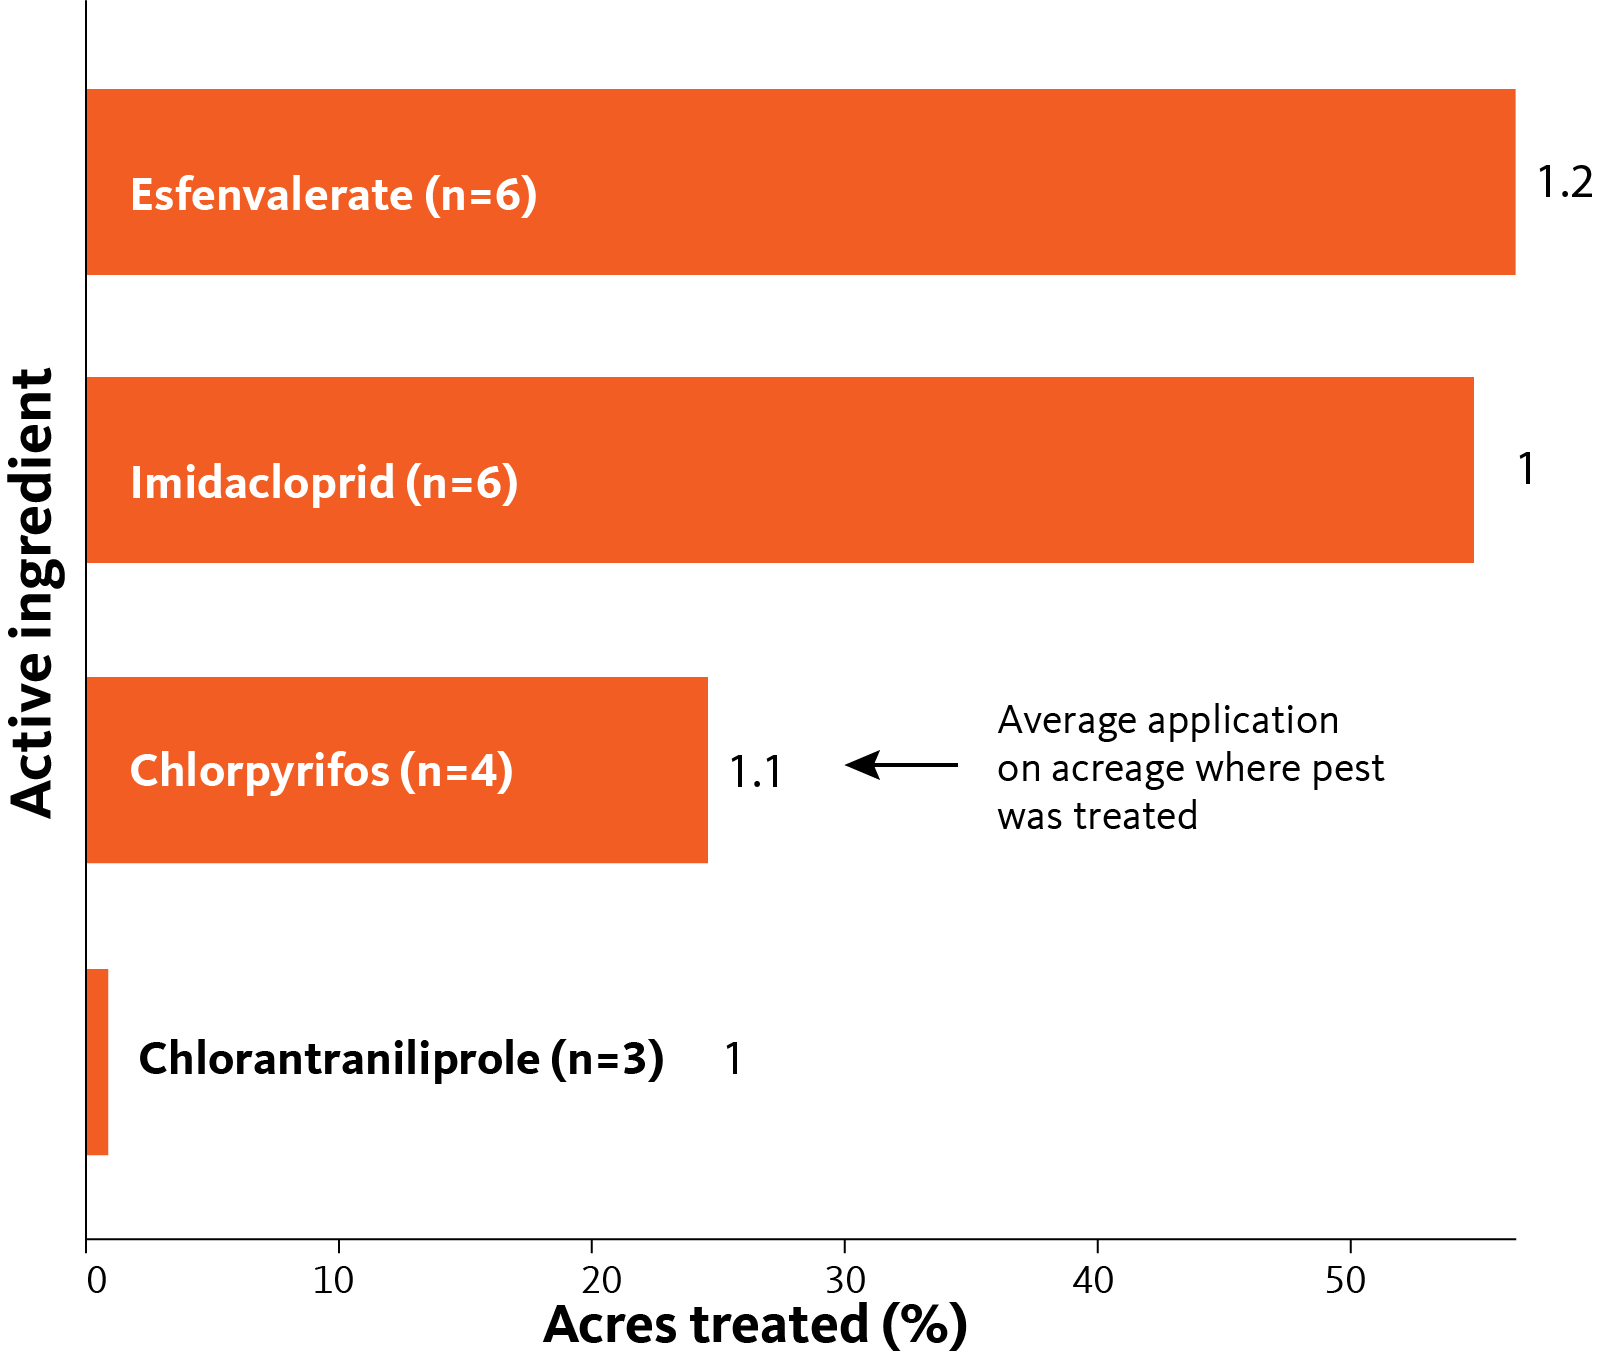
Acres treated and average number of pesticide applications on treated acres
The yield losses our respondents reported for the 2017 field season were experienced despite the management applied to help mitigate losses and manage pests. For each pest species, respondents indicated the average number of pesticide treatments used to manage the pest, as well as the average number of acres on which treatments were applied.
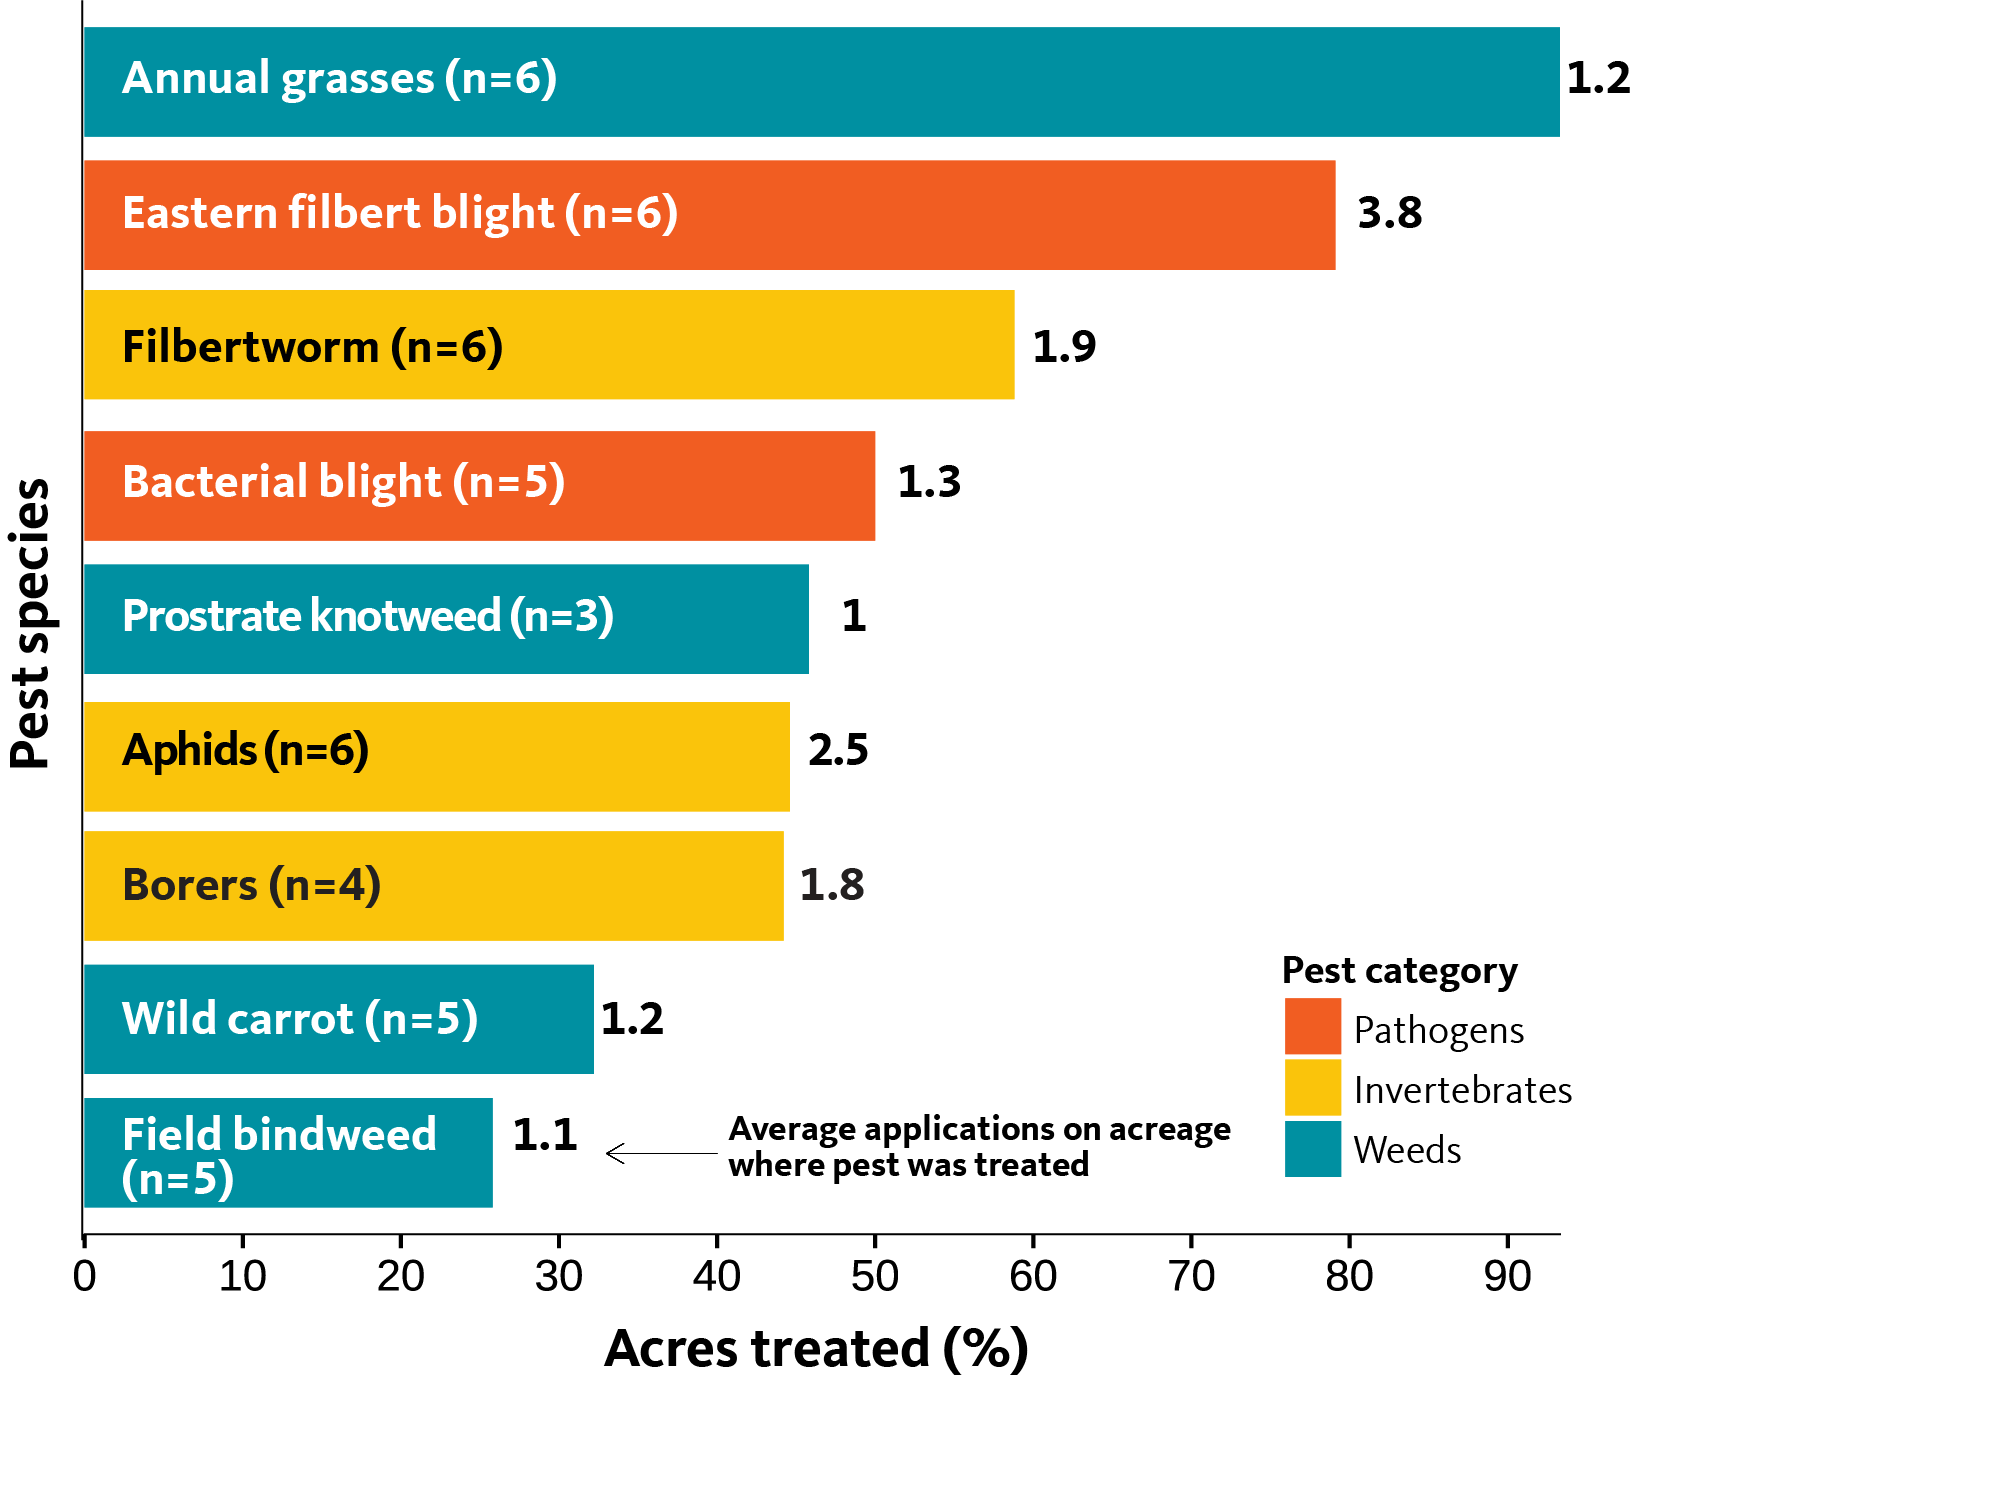
Figure 11 below depicts the pests requiring pesticide treatment on more than 25% of survey acreage. We also include the average number of pesticide applications applied on these acres. These two numbers, taken together, reveal the extent of management required for a given pest, which can be calculated as “acre-treatments” (see figures 15–18).
These data highlight the pests requiring higher levels of input, and which drive management programs. Producers need more targeted research and Extension support to improve management efforts to control these pests, protect crops and advance IPM.
Pests treated on over 25% of survey acreage, with average numbers of pesticide applications
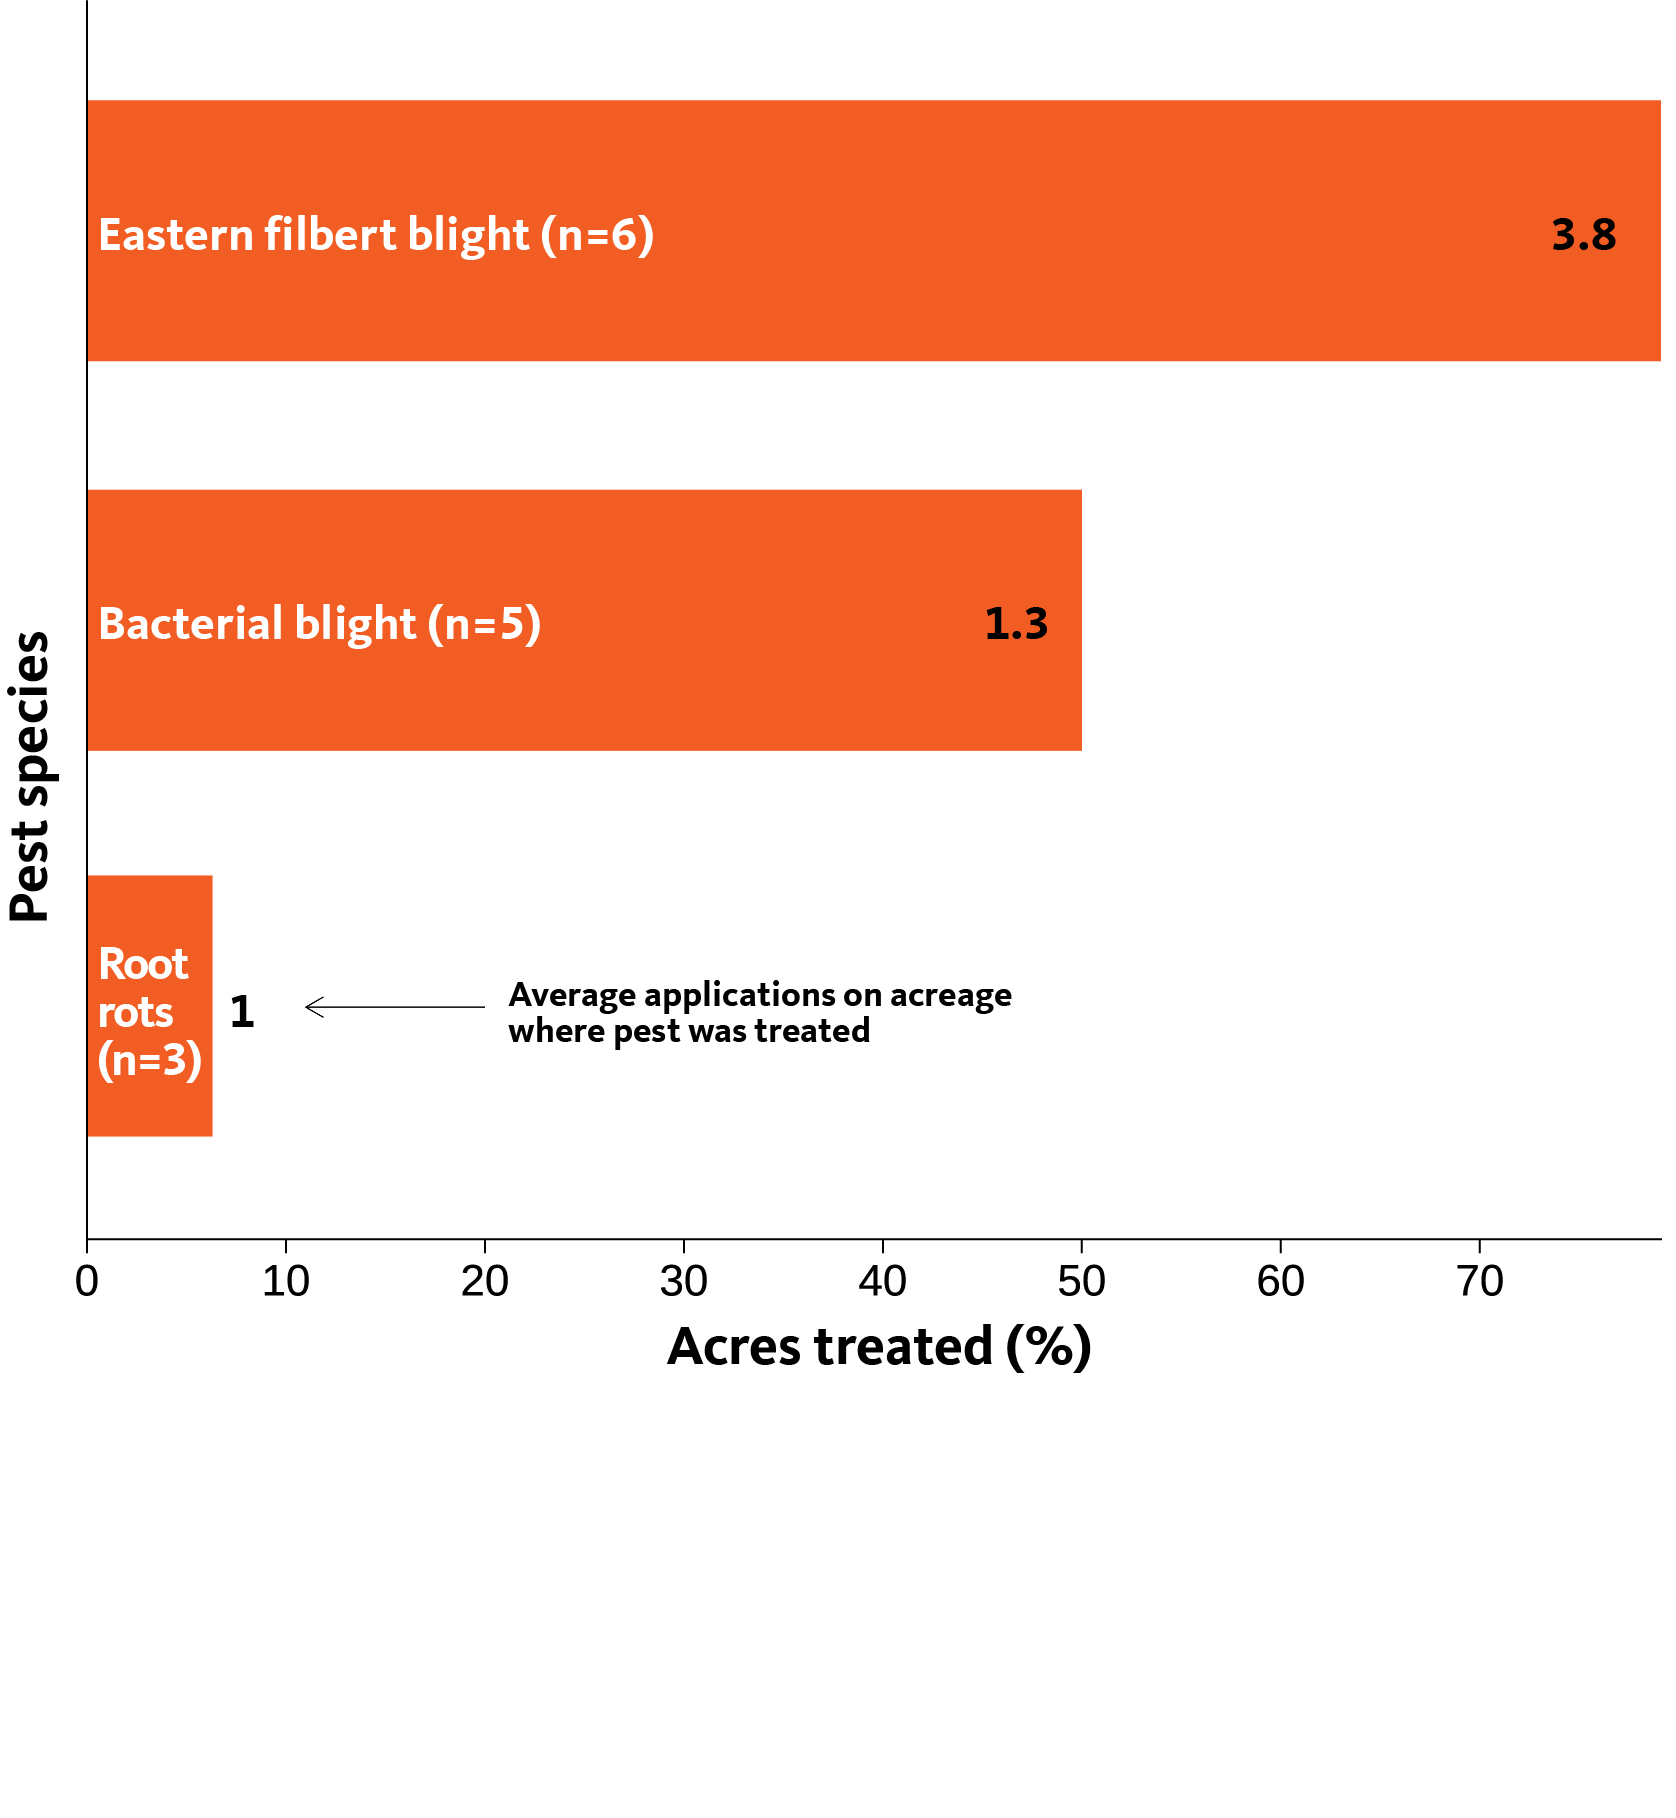
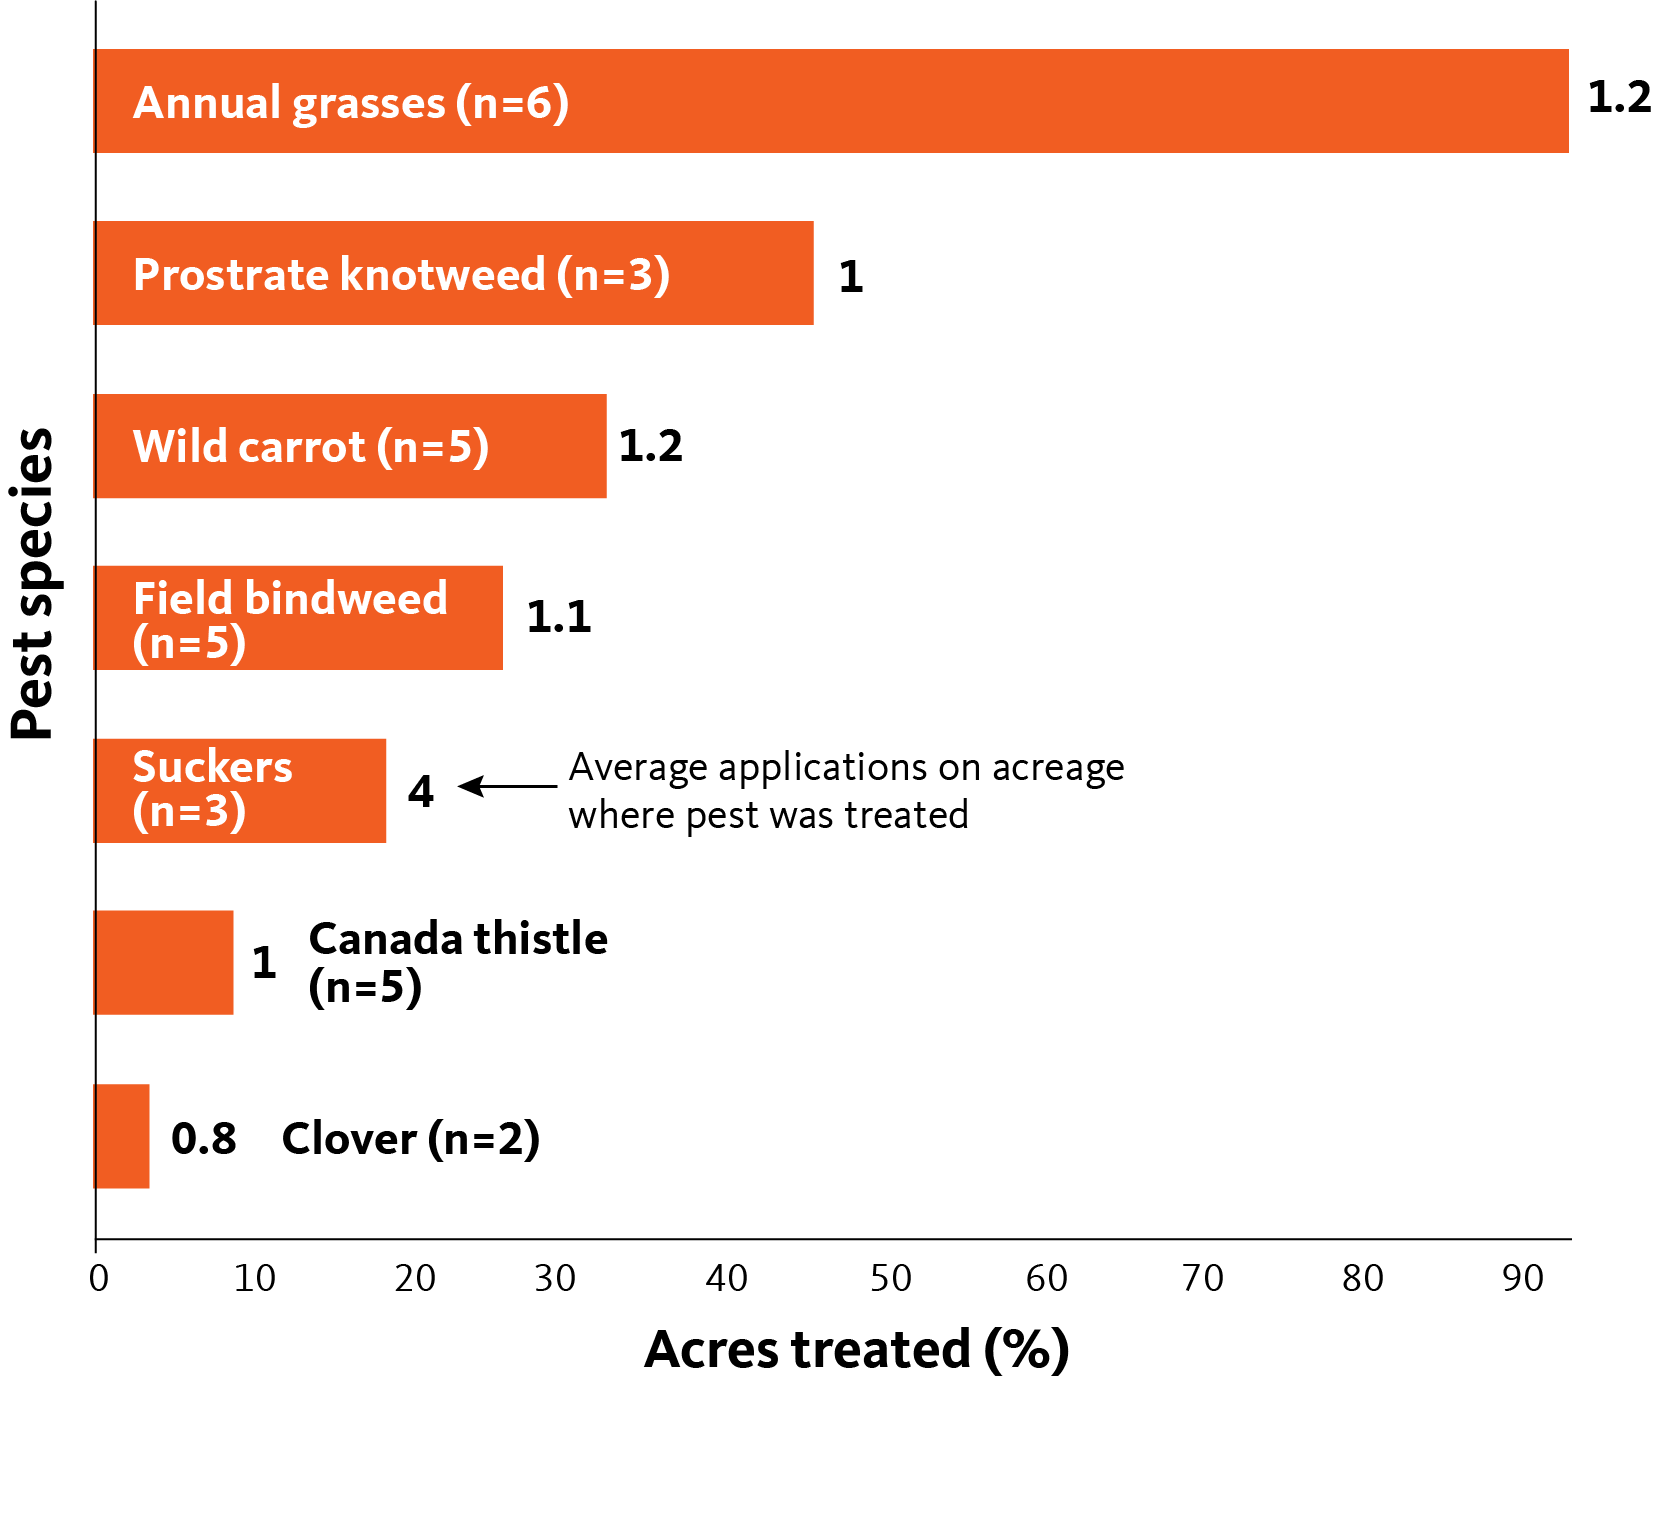
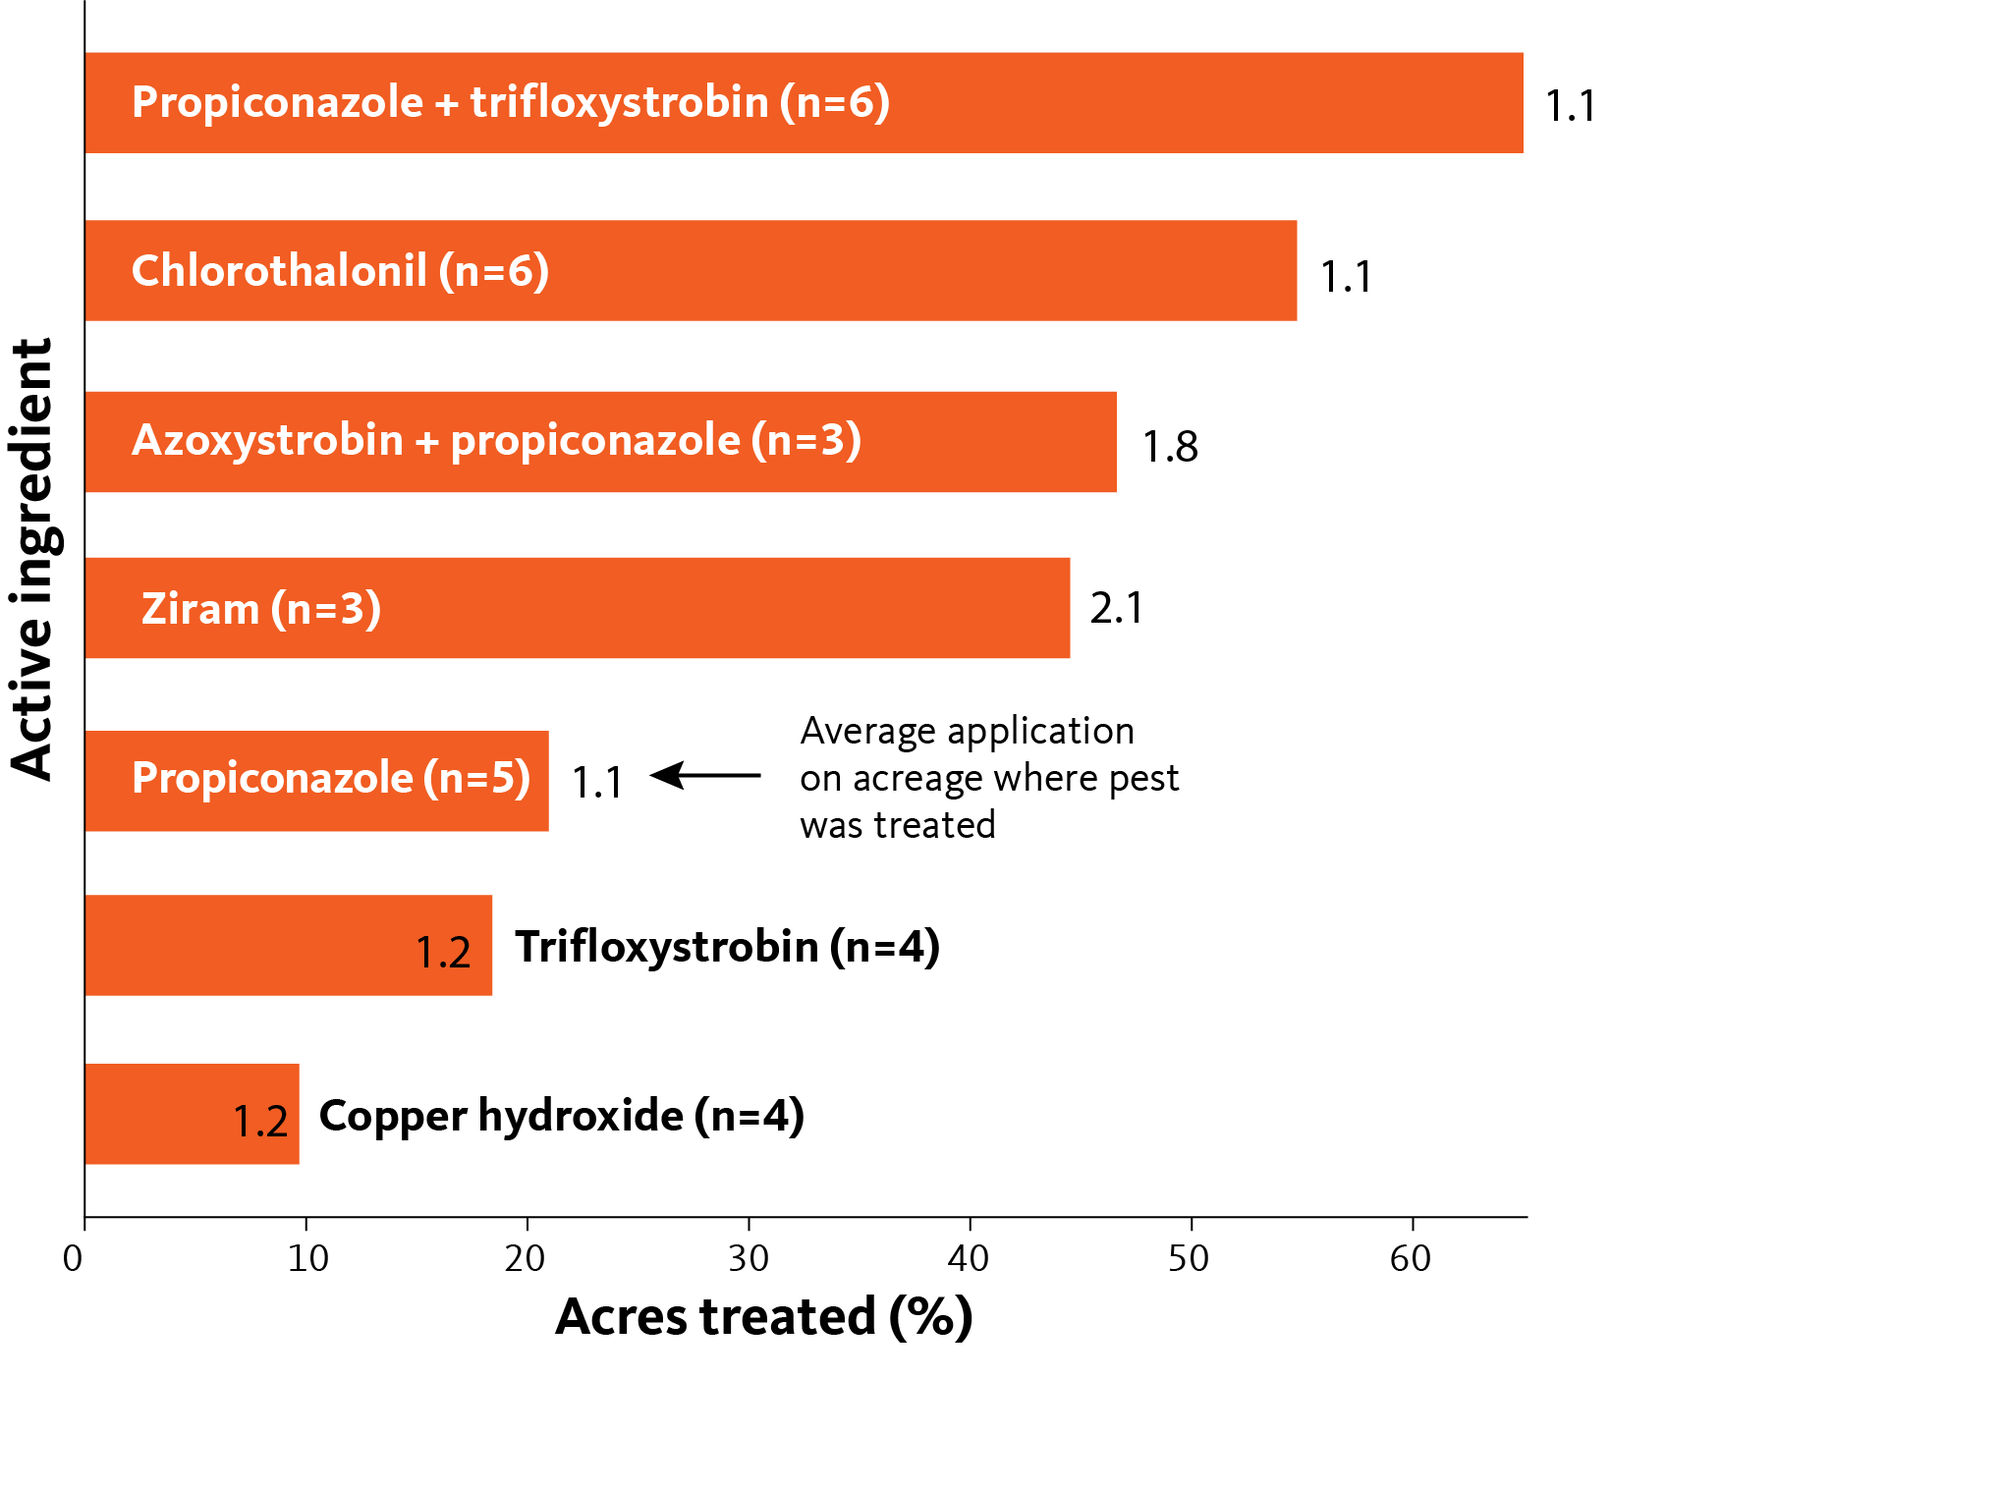
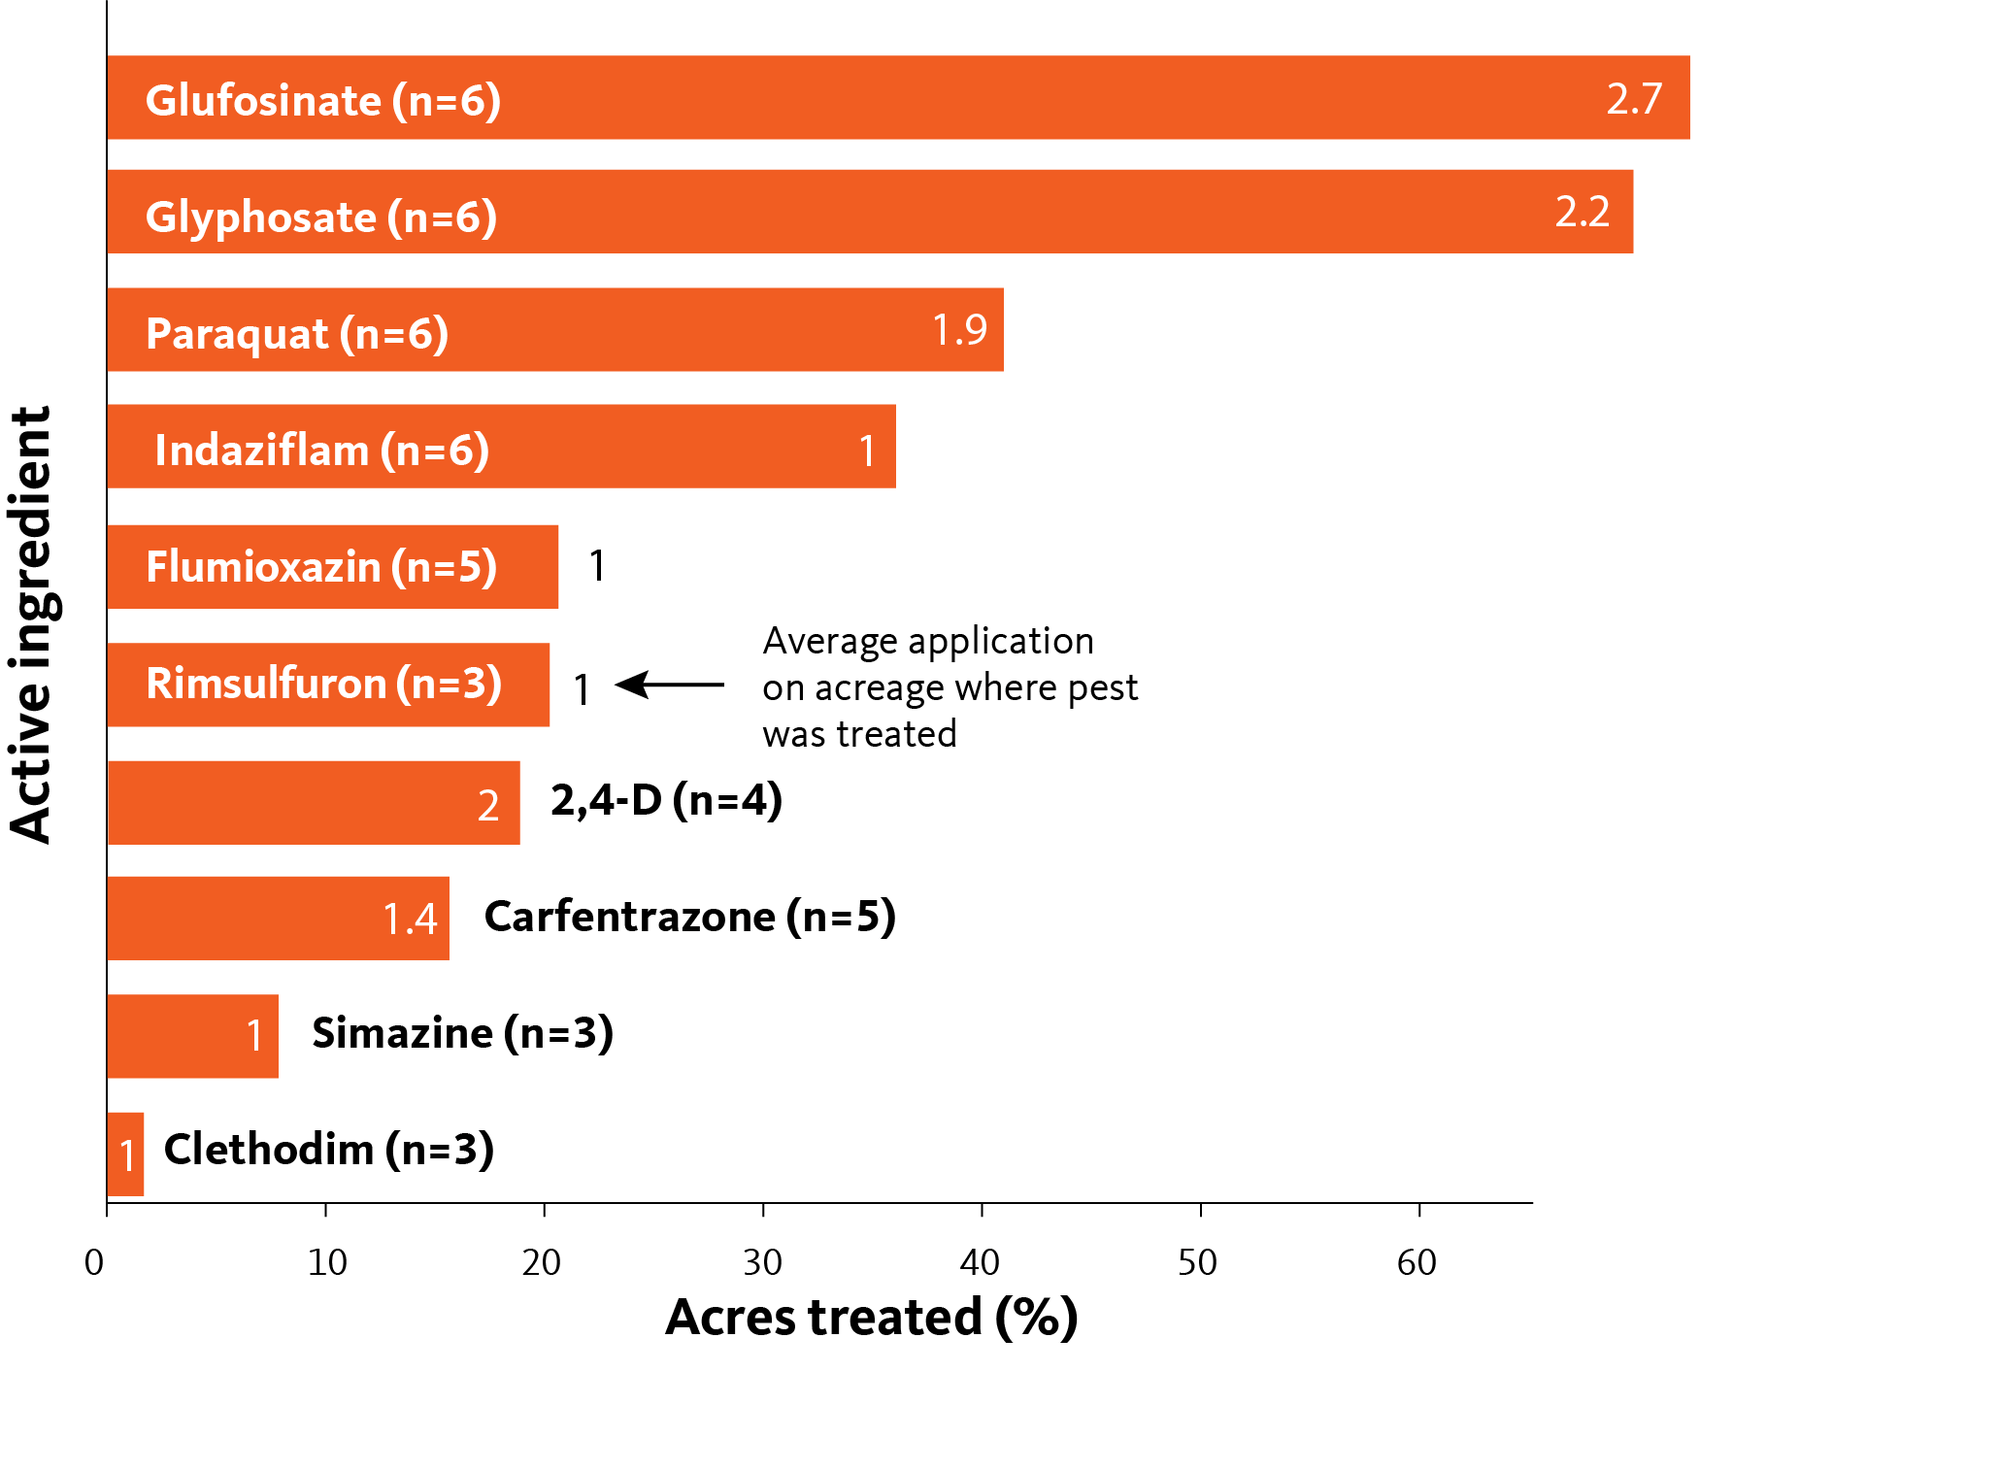
Figures 12–14 show, respectively, these same data for invertebrates, diseases and weeds. They show a variety of important pests requiring widespread and multiple treatments.
Acres treated and average number of pesticide applications targeting invertebrate pests
Acres treated and average number of pesticide applications targeting diseases
Acres treated and average number of pesticide applications targeting weeds
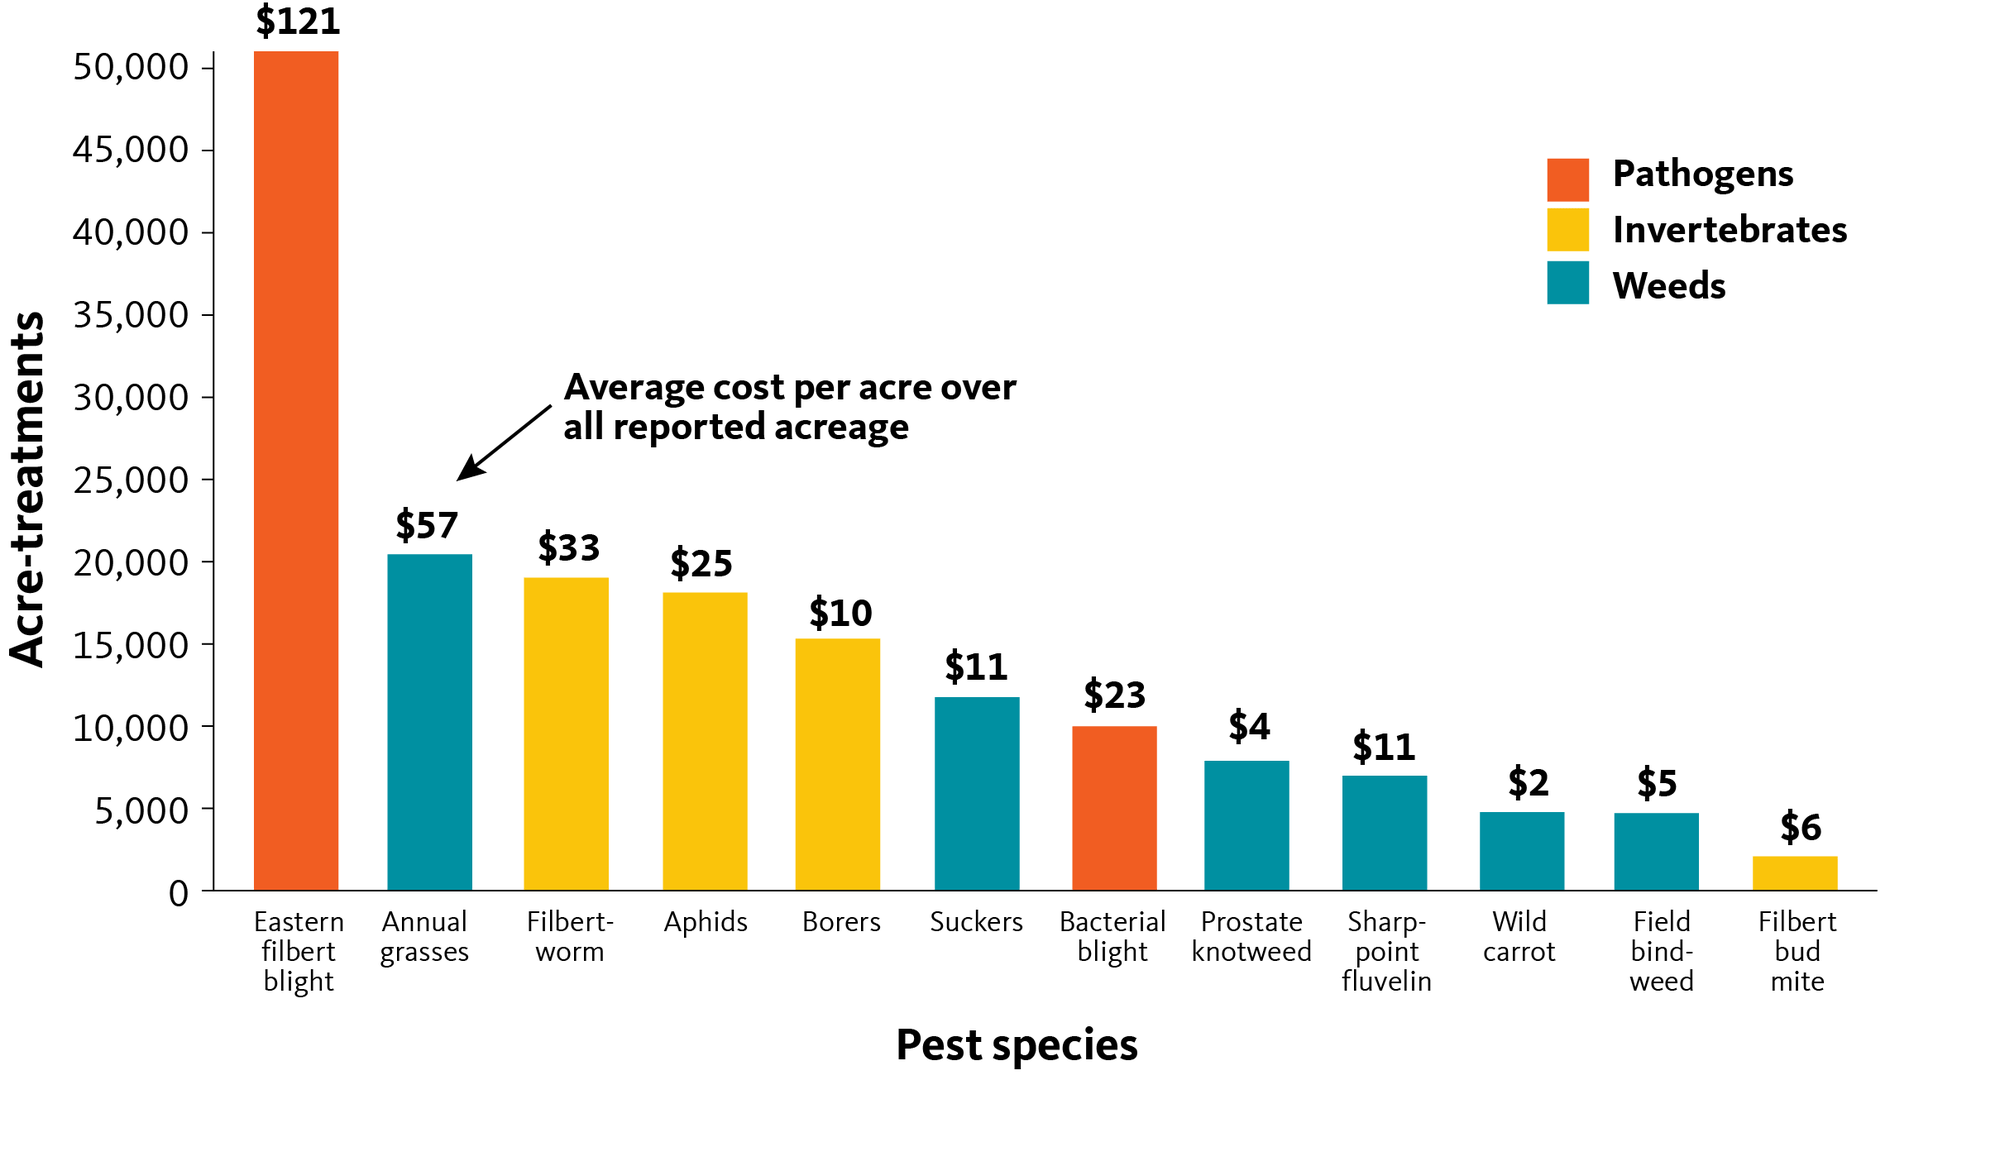
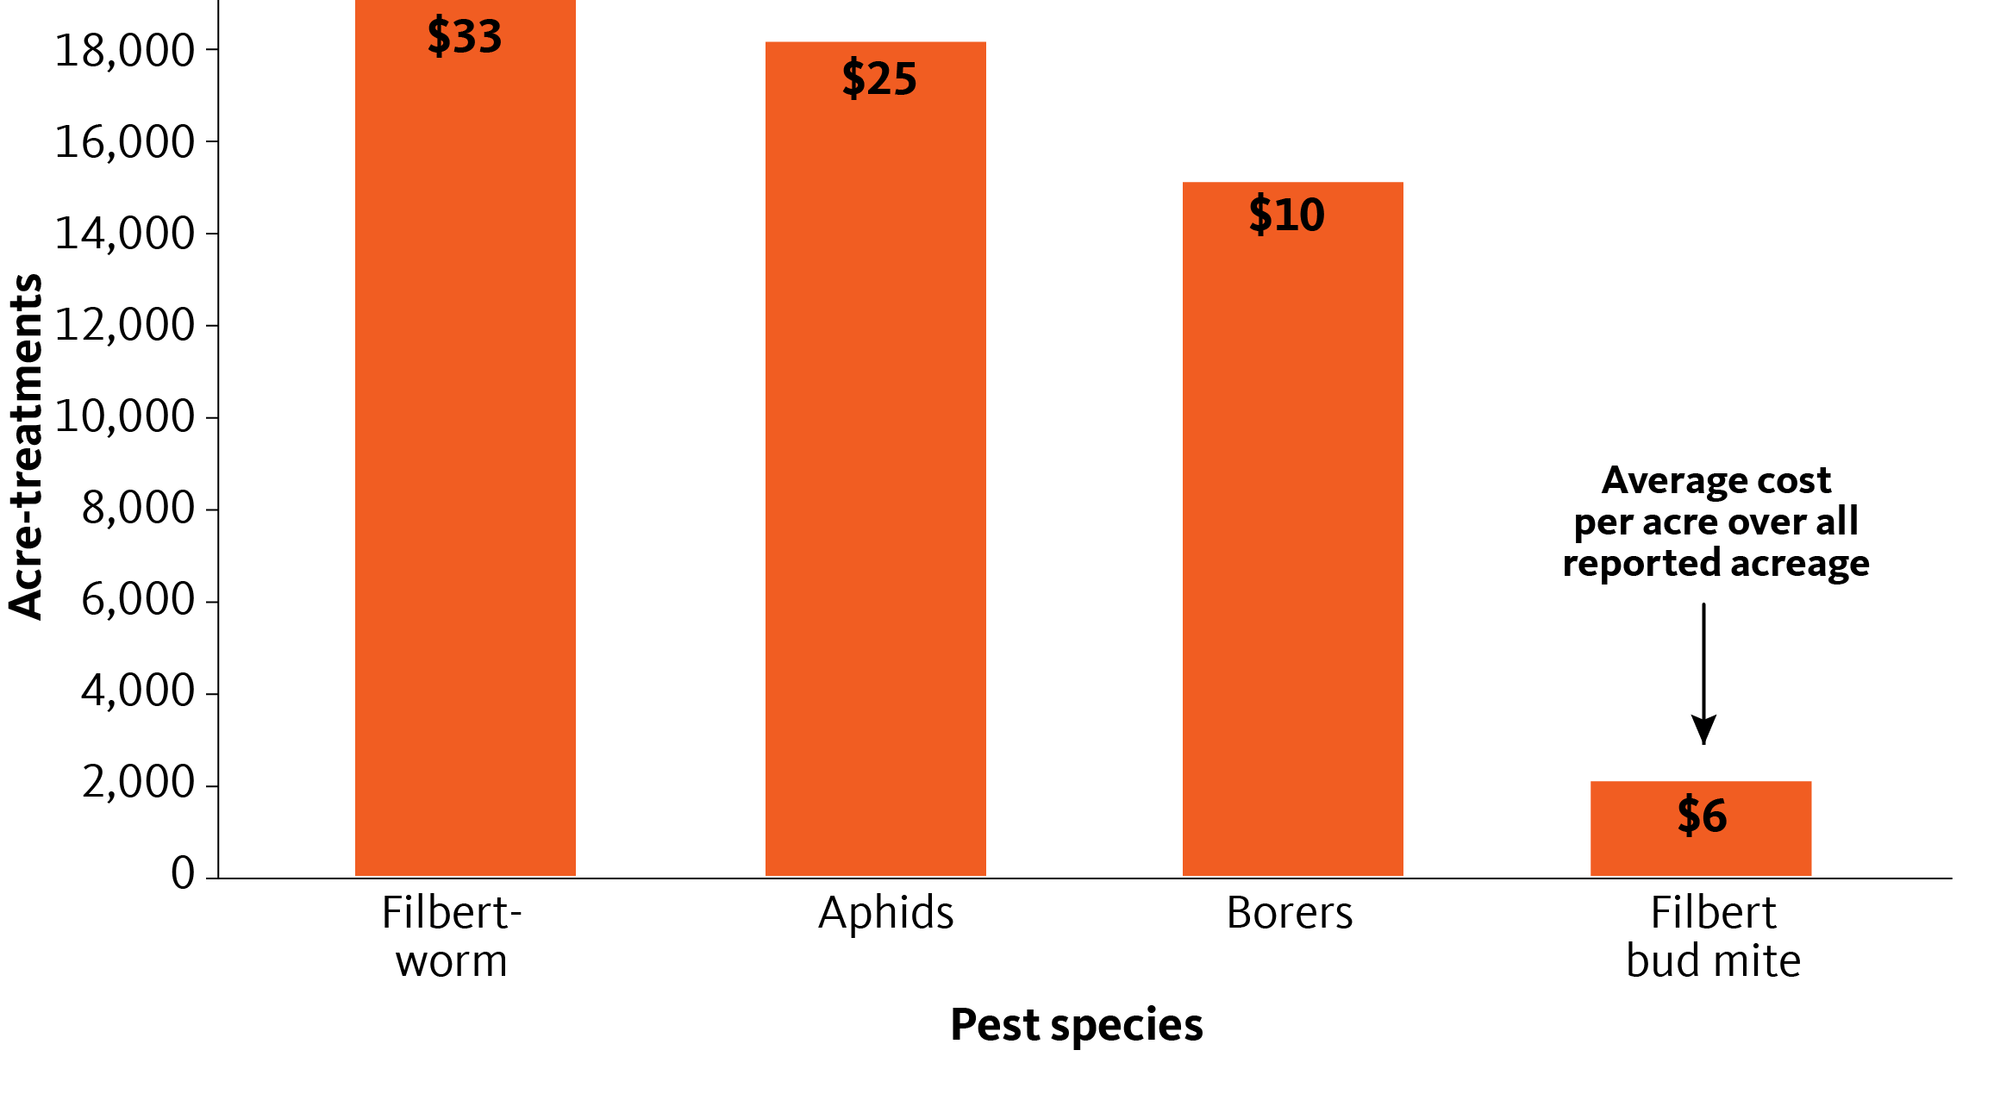
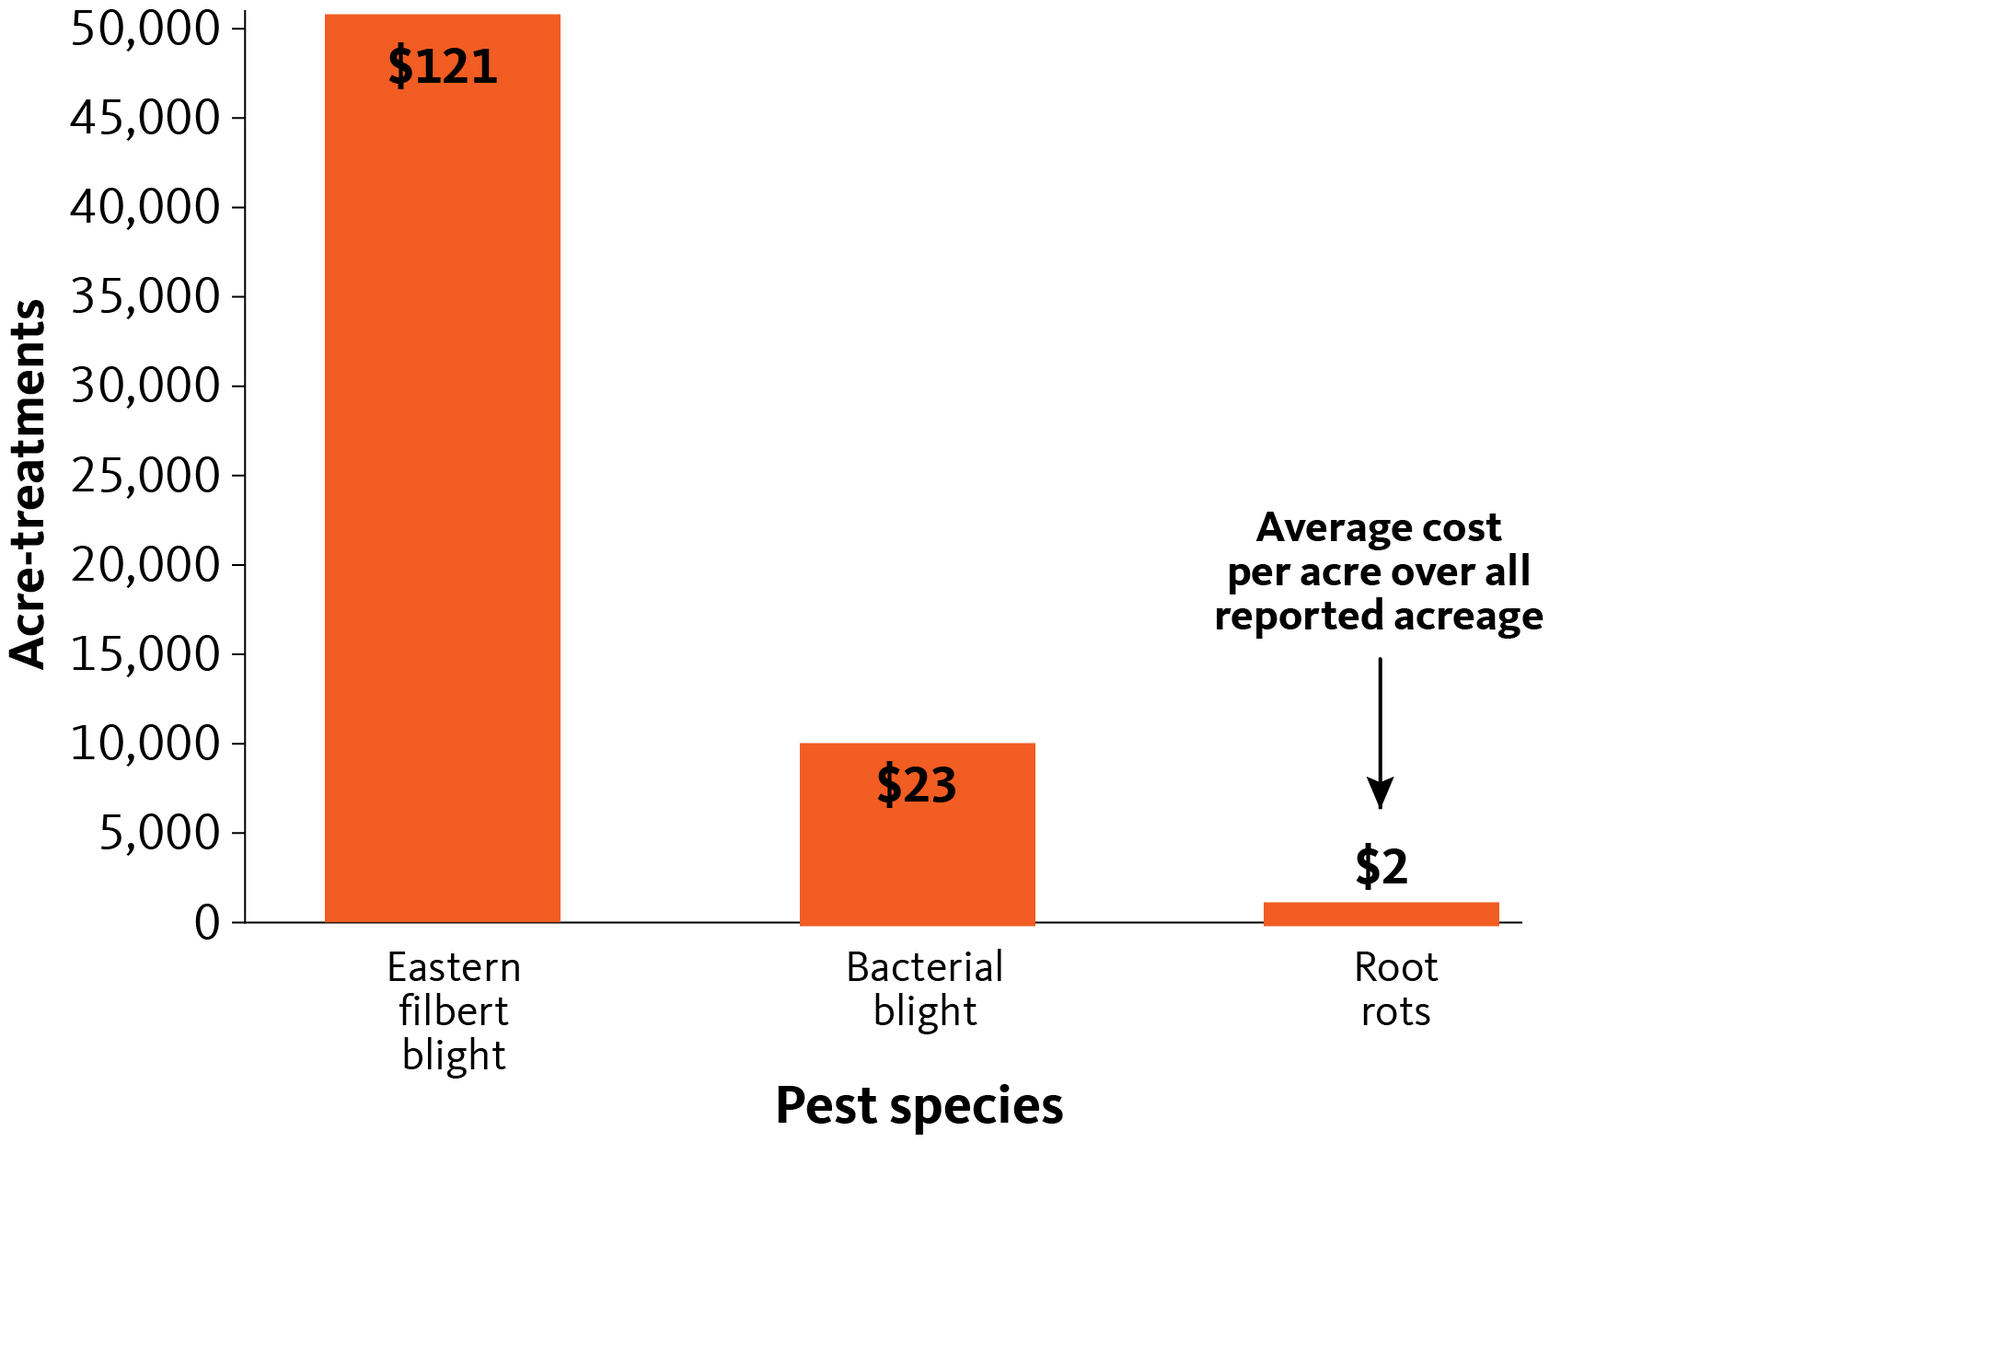
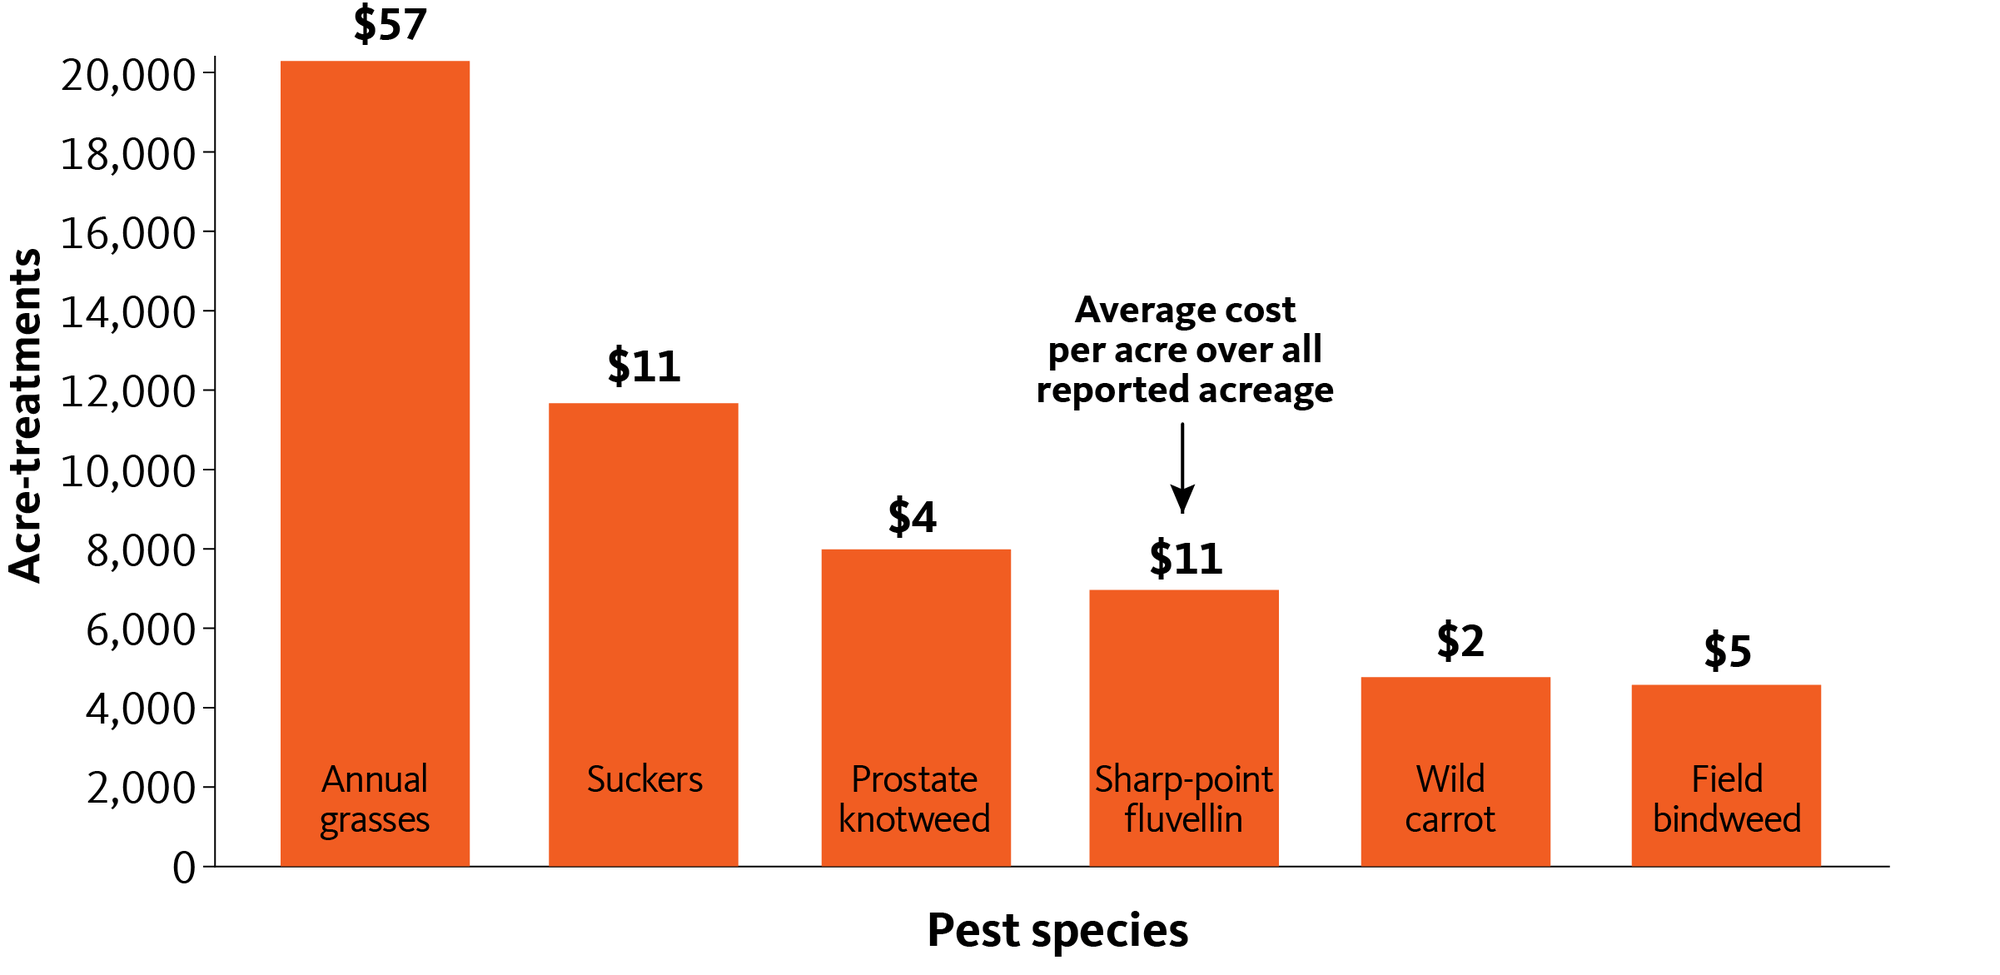
Acre-treatments per pest species
By multiplying the number of acres treated for a given pest by the average number of applications used to manage it, we obtain the “acre-treatments” metric. This number represents the total number of acres receiving treatment for a pest. The number of acre-treatments can exceed the number of acres surveyed when acres receive multiple applications (in this case, either multiple products or multiple applications of the same product).
This is another way to demonstrate the level of management required for various pests. The figures below reveal the hazelnut pests requiring the greatest amounts of chemical management in terms of “acre-treatments,” along with the average cost per acre of treatment and the average number of applications across all surveyed acres. Acre-treatment estimates include pesticide applications in the form of seed treatments, fumigation, chemigation, ground applications and aerial applications (if applicable).
Pests with highest acre-treatments
Figures 16-18 again break out these data into pest categories — invertebrates, diseases and weeds.
Acre-treatments for invertebrates
Acre-treatments for diseases
Acre-treatments for weeds
Costs of chemical management by pest species
For each pest species reported as present or managed on the acres that respondents oversaw, we determined the average number of pesticide applications made, along with the estimated average cost for one application (including application costs). The following figures depict the reported costs associated with management and represent the total cost over the growing season, by pest. Note that some pests might have been reported as present on some acreage but with no chemical applications. These data were also included in the following analyses, at zero cost, in order to gain a more accurate measure of the costs associated with the presence of a given pest.
Species whose chemical management costs were over $25 per acre on acreage where the pest was present
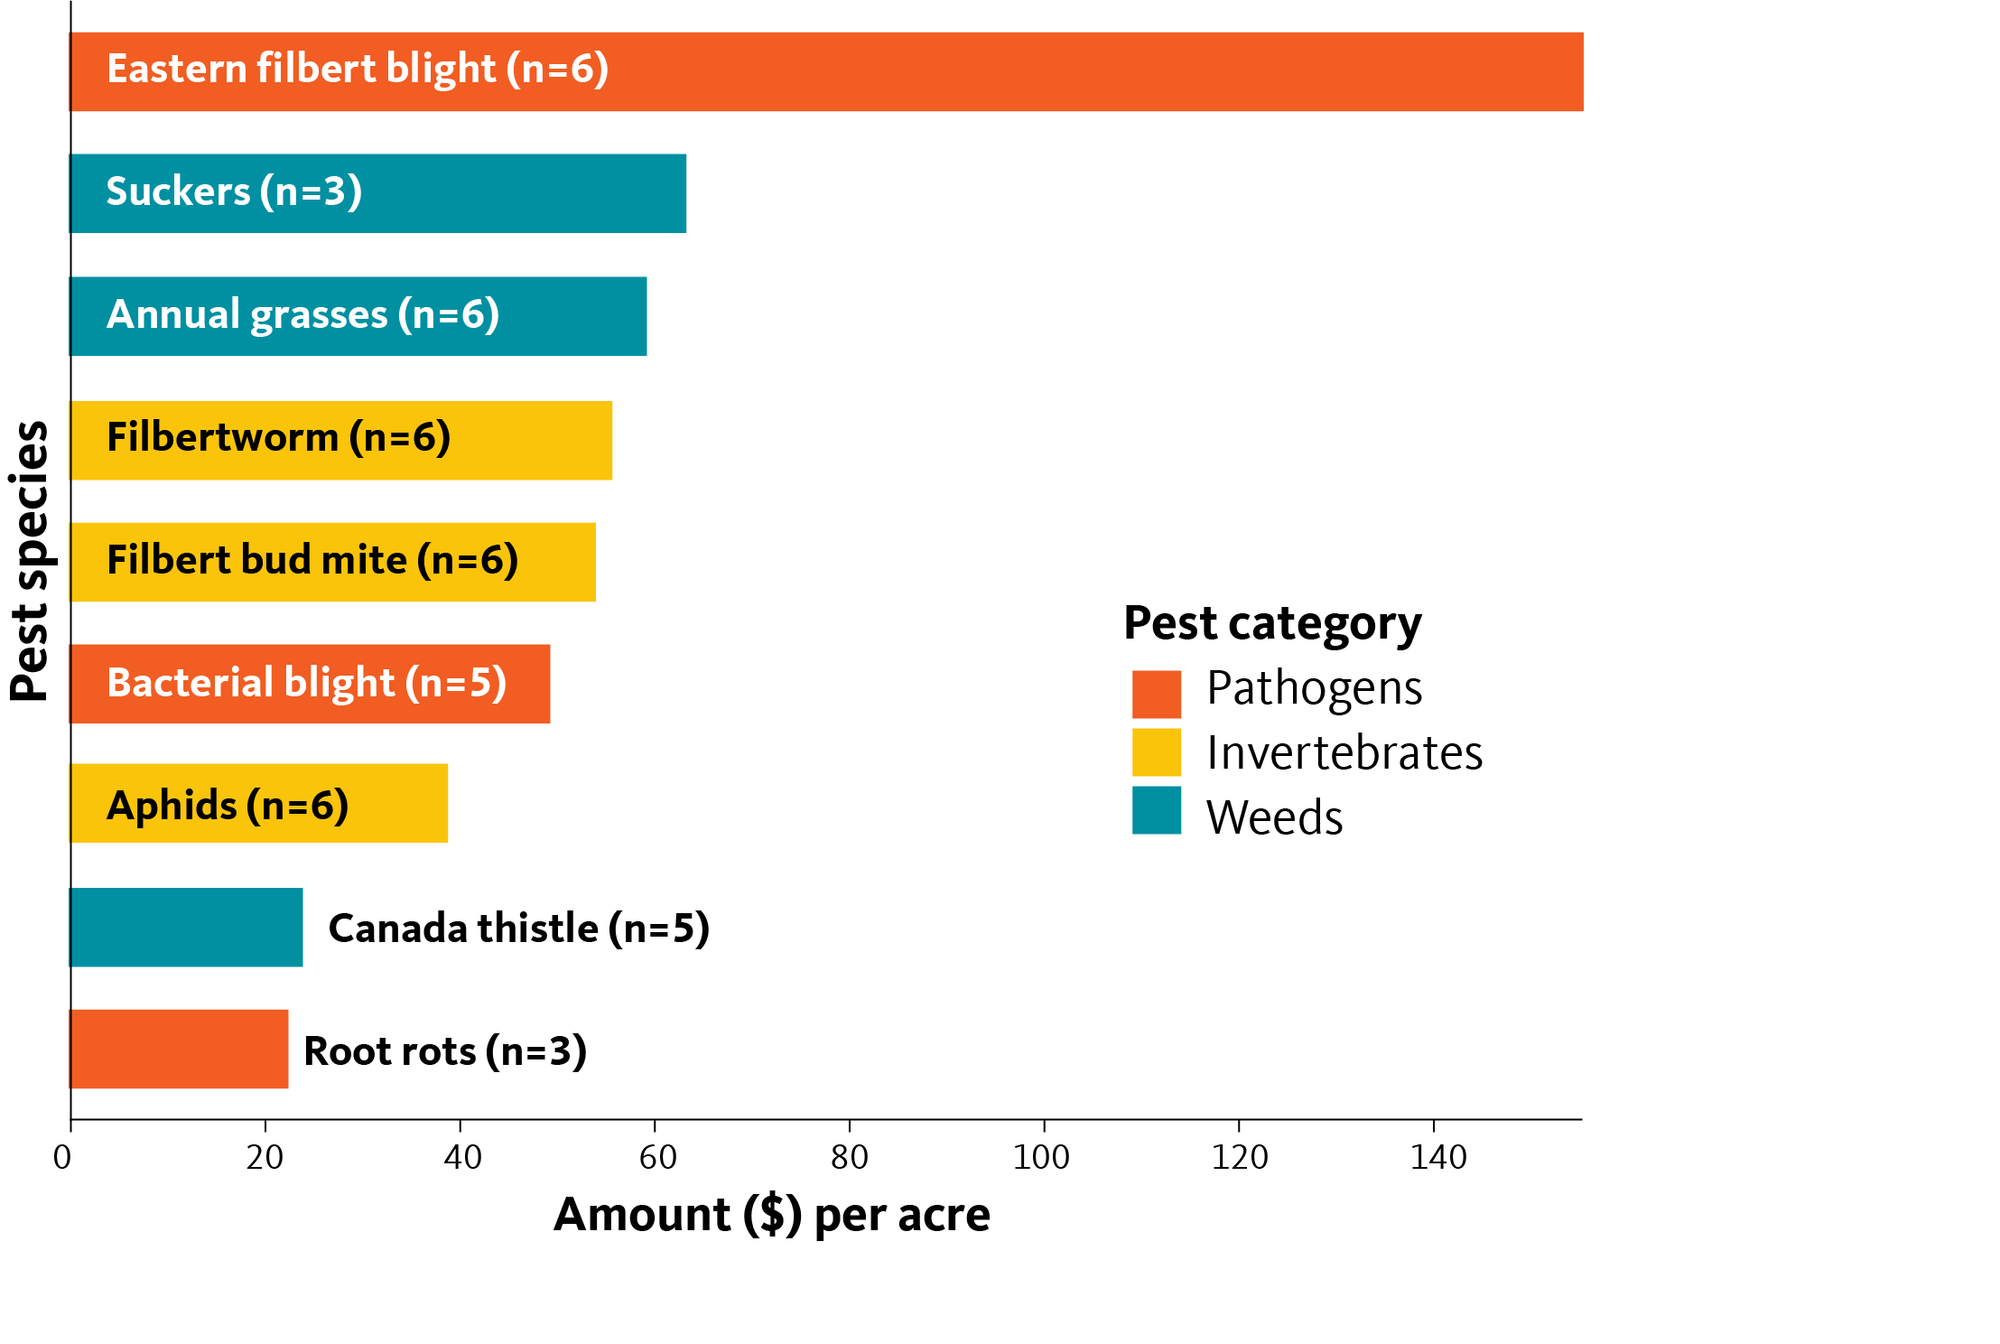
Figures 20–22 report these data for invertebrates, diseases and weeds, respectively. Eastern filbert blight is the pest with the highest overall cost of treatment.
Costs of chemical management for invertebrate pest species
Costs of chemical management for diseases and epiphytes
Costs of chemical management for weeds
Costs of other pest management activities
Respondents were also asked to estimate the cost of any additional pest management activities beyond the use of pesticides (such as scouting, equipment sanitation, cover cropping, etc.). These respondents were asked to report the average cost per acre, as well as the average number of acres to which each practice was applied. The cost per treated acre reflects respondents’ reported cost on acreage where the treatment was applied. The cost per acre across all surveyed acreage metric averages the treated acre costs across all surveyed acreage. For example, monitoring with traps may have occurred on only half the survey’s 17,250 acres, with an average “treated acre” cost of $5 per acre. When averaged across the whole 17,250 acres, this represents a $2.50 per acre cost. If a practice was applied across all of a respondent’s acreage, the two numbers (cost per treated acre and cost per acre across all survey acreage) will be the same.
Field scouting, forecasting, sanitation and other nonchemical IPM practices have associated costs such as fuel, time, labor and miscellaneous material expenses. Respondents struggled with estimating costs for these activities, which may have resulted in underreporting of the costs of additional management. If we are to calculate the total cost of IPM, including nonchemical tactics and practices, we need to identify and factor in the additional costs of pest management. We are seeking to improve our understanding of these additional costs over time as the survey methodology advances.
| Management action | Acres treated (%) | Cost per acre across all survey acreage ($) | Cost per acre on treated acreage ($) | N |
|---|---|---|---|---|
| Scouting | 23 | 1 | 3 | 6 |
| Monitoring with traps | 8 | 5 | 10 | 6 |
| Management action | Acres treated (%) | Cost per acre across all survey acreage ($) | Cost per acre on treated acreage ($) | N |
|---|---|---|---|---|
| Scouting | 92 | 7 | 7 | 6 |
| Resistant variety | 45 | 16 | 19 | 5 |
| Nutrient management | 26 | 25 | 75 | 2 |
| Field sanitation | 17 | 13 | 38 | 2 |
| Management action | Acres treated (%) | Cost per acre across all survey acreage ($) | Cost per acre on treated acreage ($) | N |
|---|---|---|---|---|
| Cultivation | 37 | 19 | 38 | 3 |
| Mow and blow | 5 | 4 | 13 | 2 |
| Equipment sanitation | 3 | 3 | 15 | 1 |
Pesticide use
In addition to collecting data by pest species, we asked respondents to provide details of each specific pesticide active ingredient utilized. The figures in this section summarize the reported use of pesticides in terms of the percent acres treated and the average number of applications for each active ingredient.
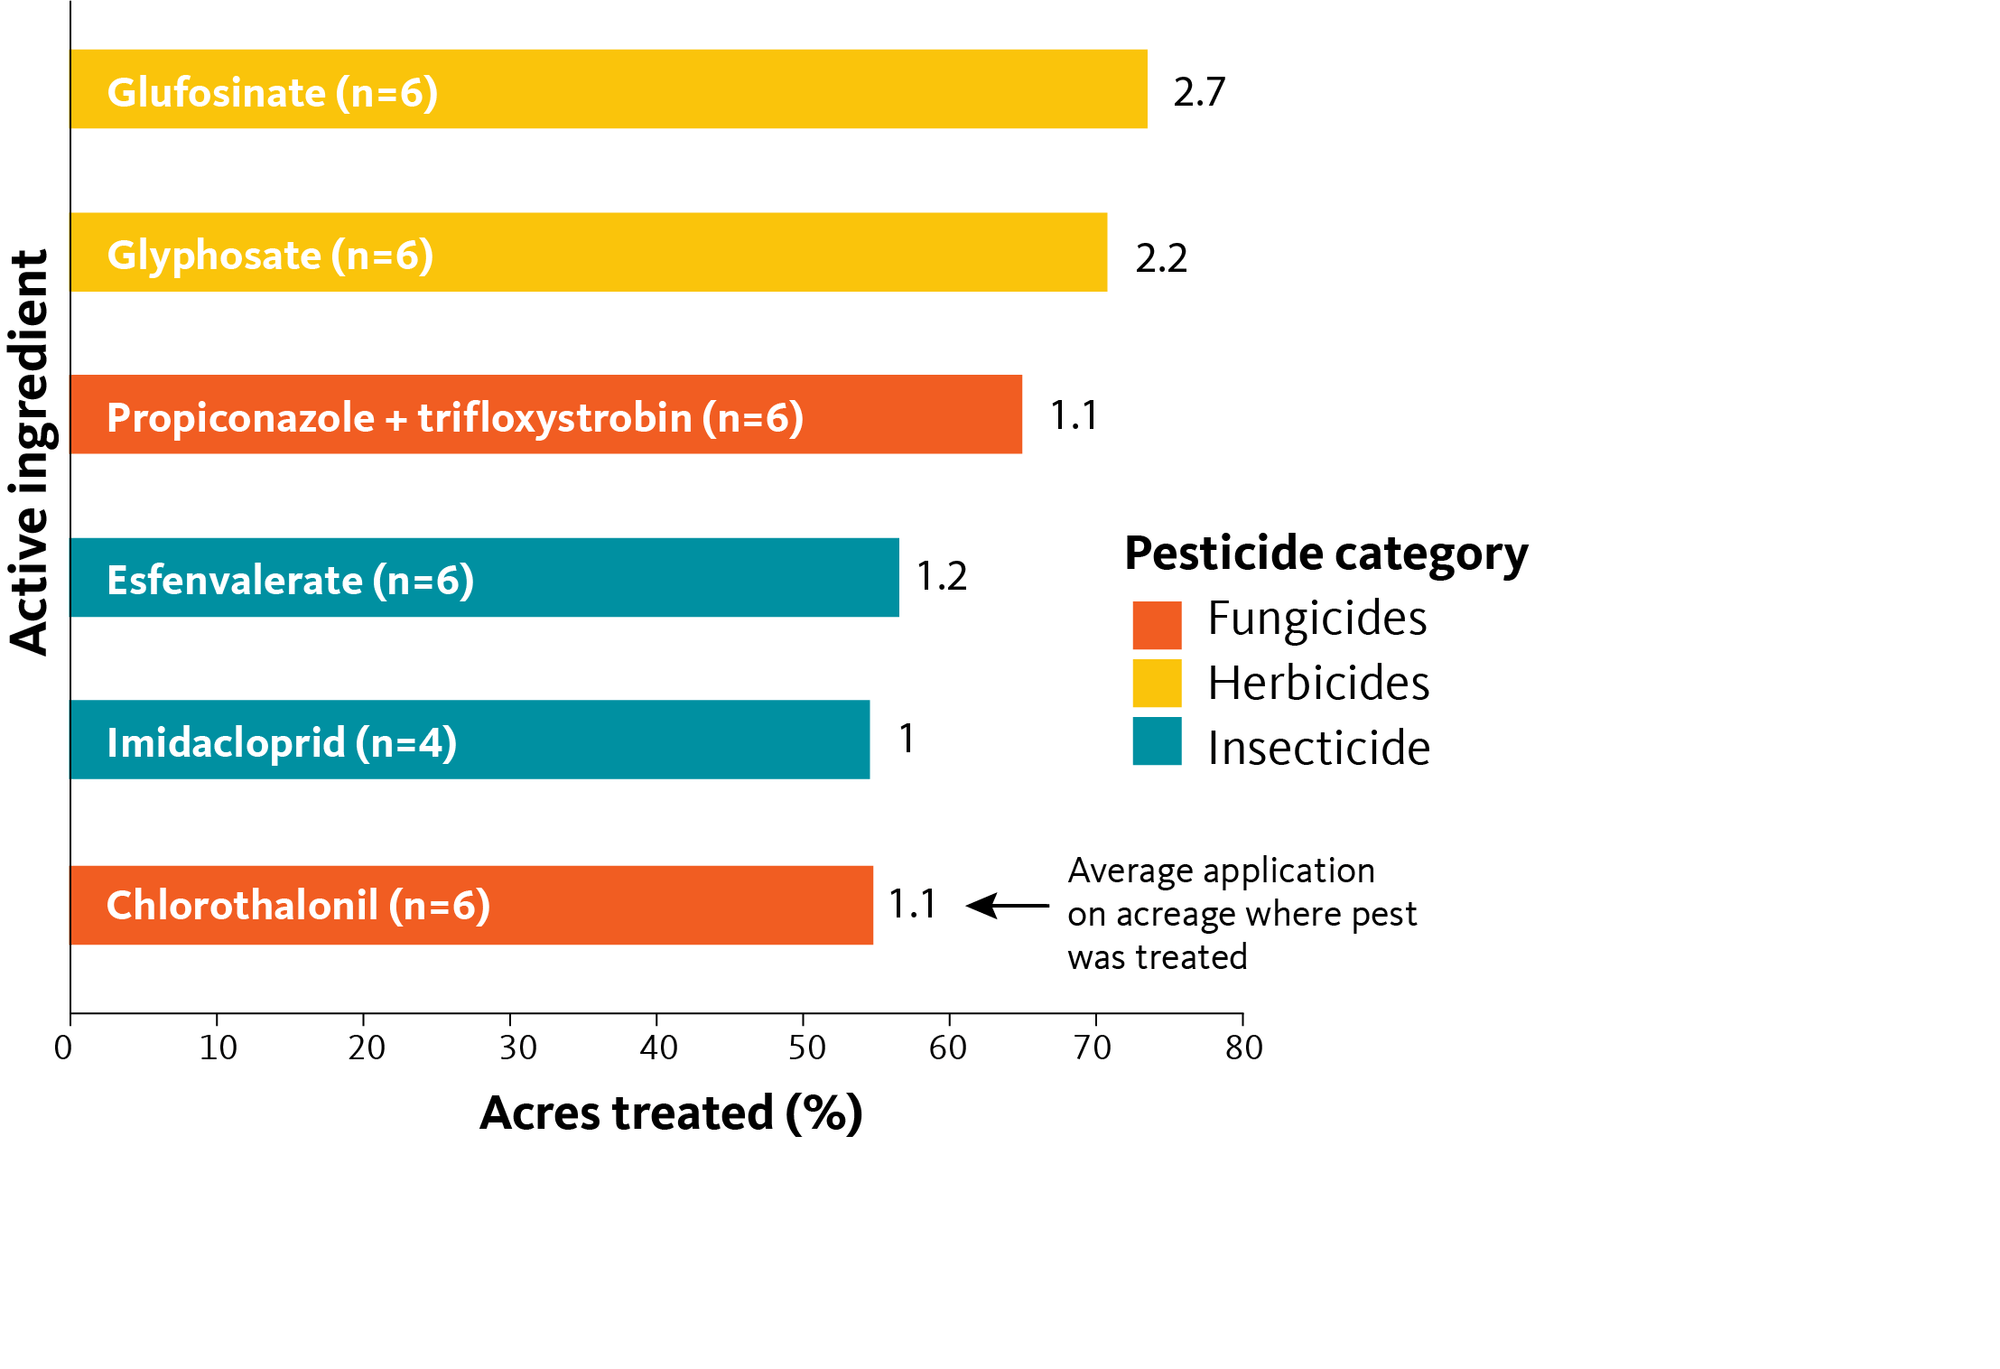
The first figure reports the pesticides used on over 50% of surveyed acreage, along with the average number of times each active ingredient was applied. The following figures report this data for insecticides, fungicides and herbicides, respectively. Note: average number of applications can be fractional because some single treatments were apportioned across multiple target pests
Pesticides applied on over 50% of survey acreage, with average number of applications
Percent acreage treated with insecticide active ingredient
Percent acreage treated with fungicide active ingredient
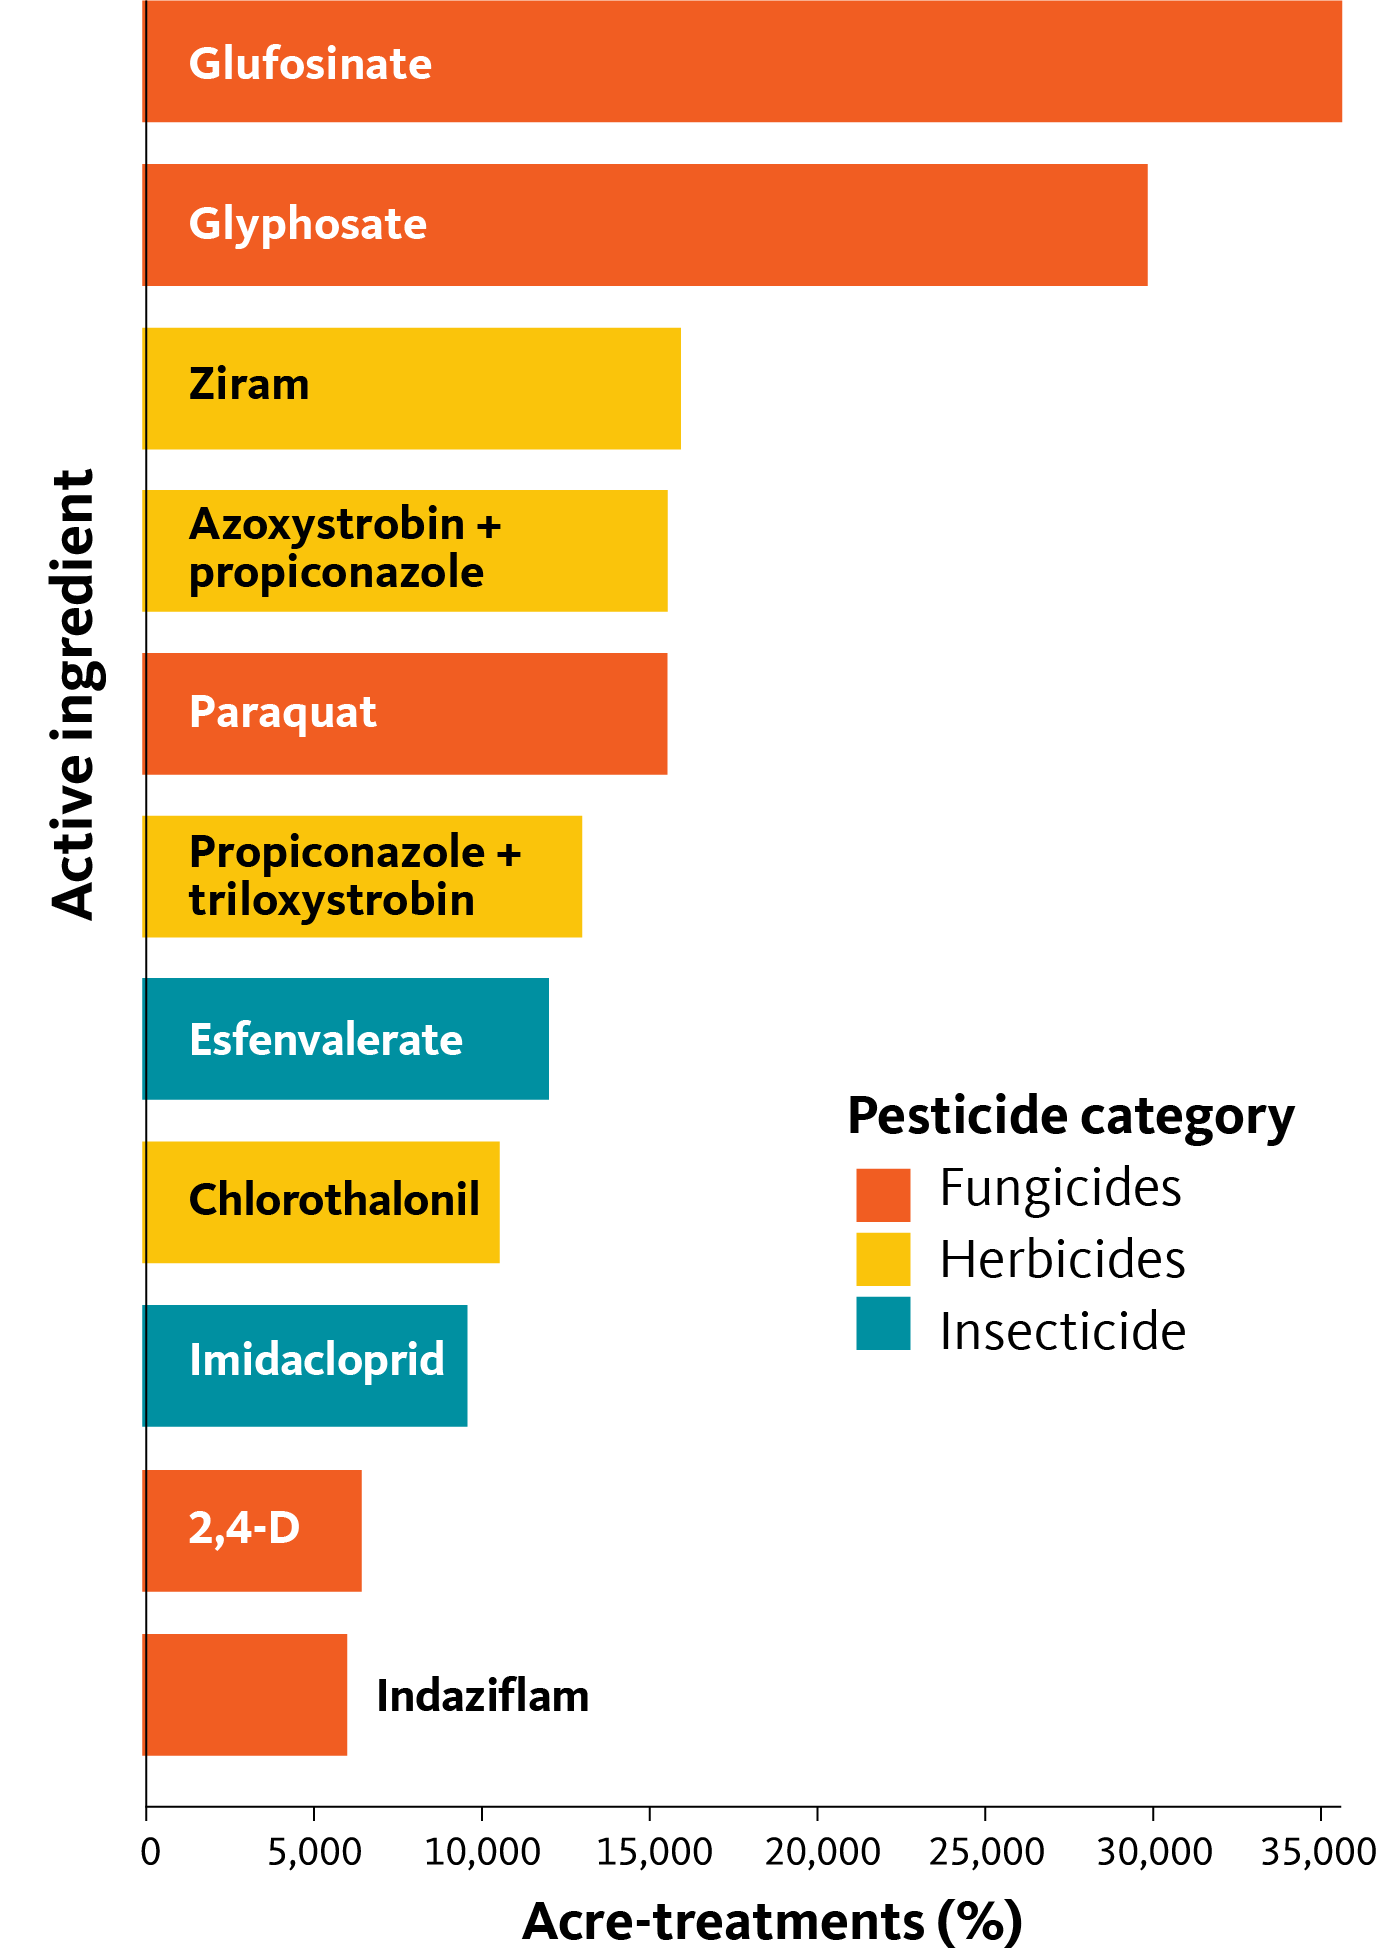
Pesticide acre-treatments
The number of acres treated with a given active ingredient, multiplied by the average number of applications, again reveals “acre-treatment” estimates (see “acre-treatments per pest species” for a reminder of this metric). This reveals the extent of pesticide use and provides critical information for researchers and educators, particularly those tracking issues such as pest resistance, natural enemy protection and pesticide efficacy. This also serves as a baseline for tracking how practices change over time. As a reminder, the acre-treatment metric is based only on our surveyed acreage (17,250 acres), and only those acres reported to have been treated with any given pesticide (see the previous section for percent acres treated and the average number of applications, the metrics used for the following calculations).
Figures 27–30 show the most significant pesticides used, in terms of acreage, across all pest classes (Figure 27) and for each of the three main pest classes (Figures 28-30).
These analyses can help identify overreliance on any given material or pesticide mode of action, which could promote pest resistance and ultimately limit efficacy and increase pest losses.
Percent acreage treated with herbicide active ingredient
Pesticide active ingredients with over 10,000 acre-treatments
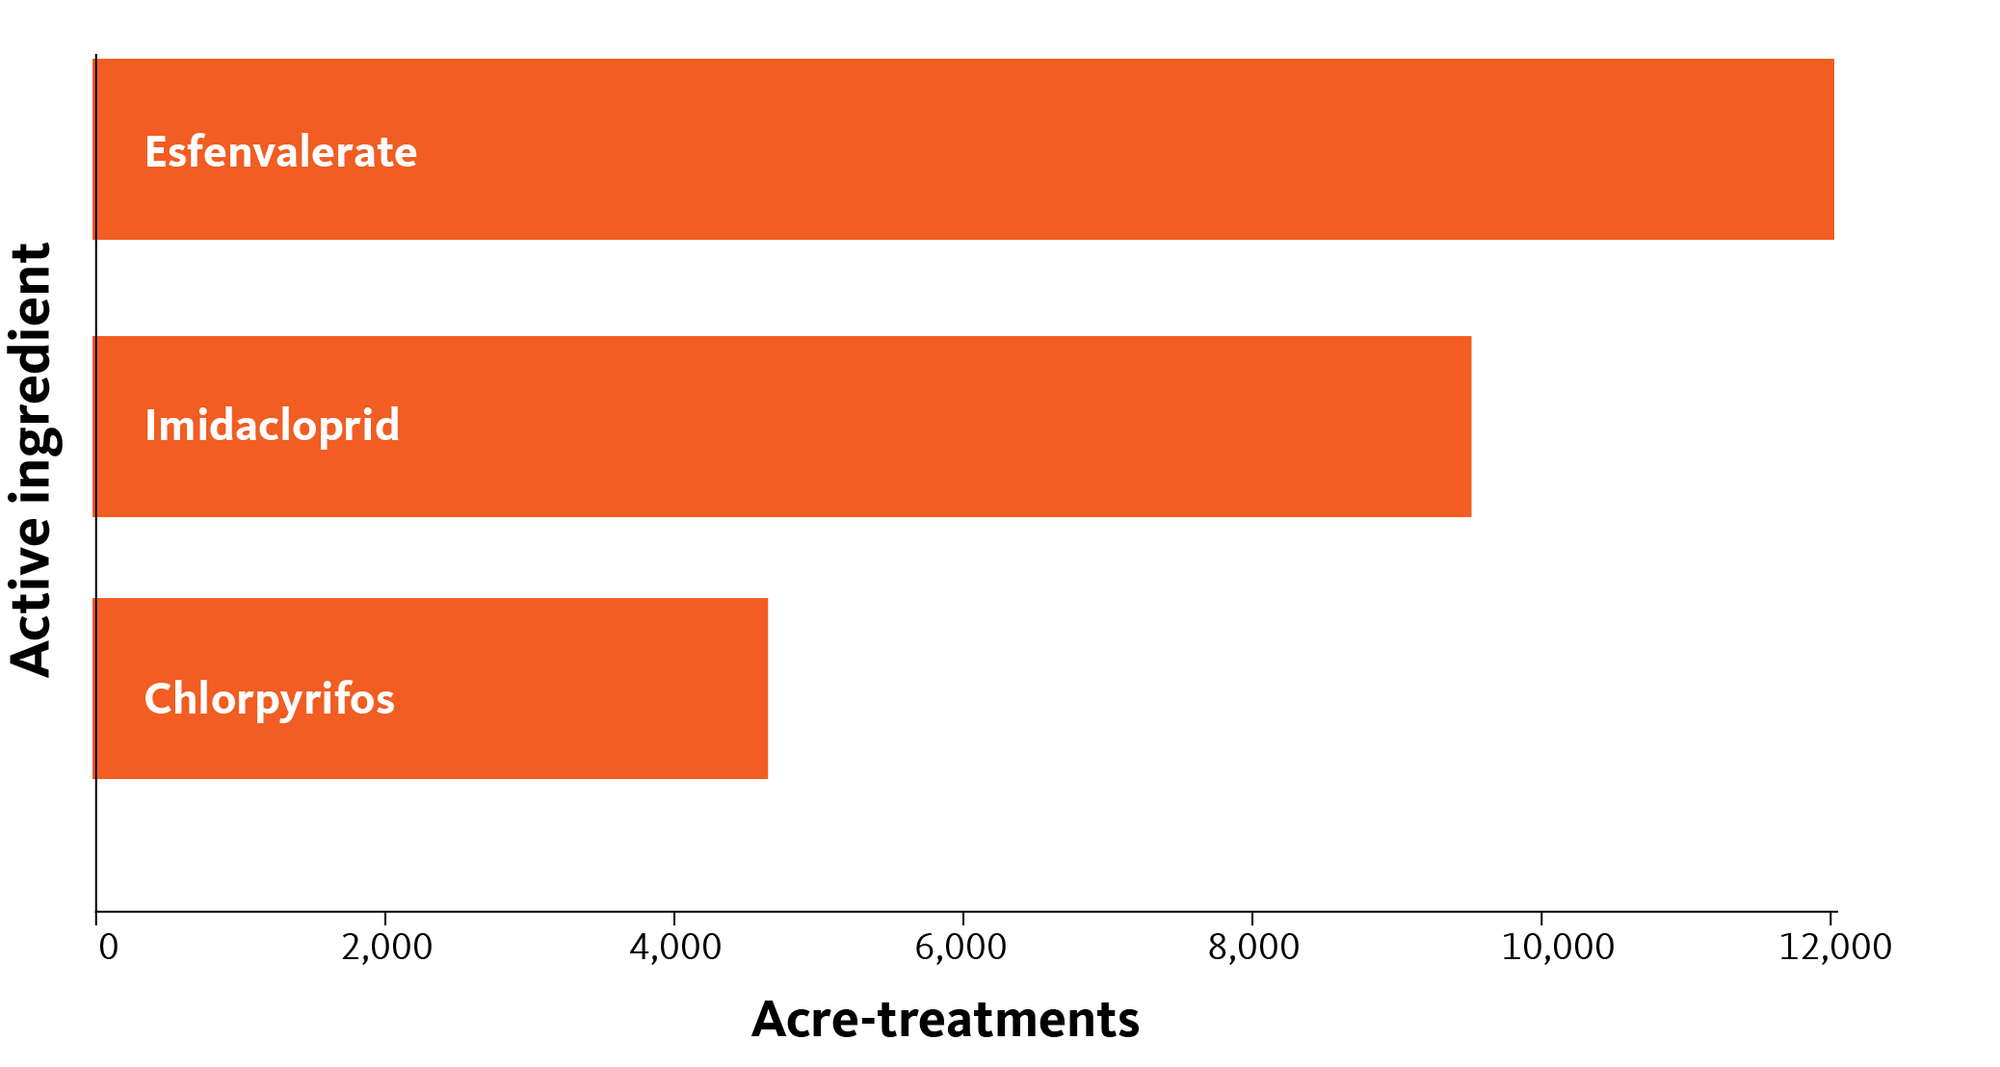
Acre-treatments for commonly used insecticides
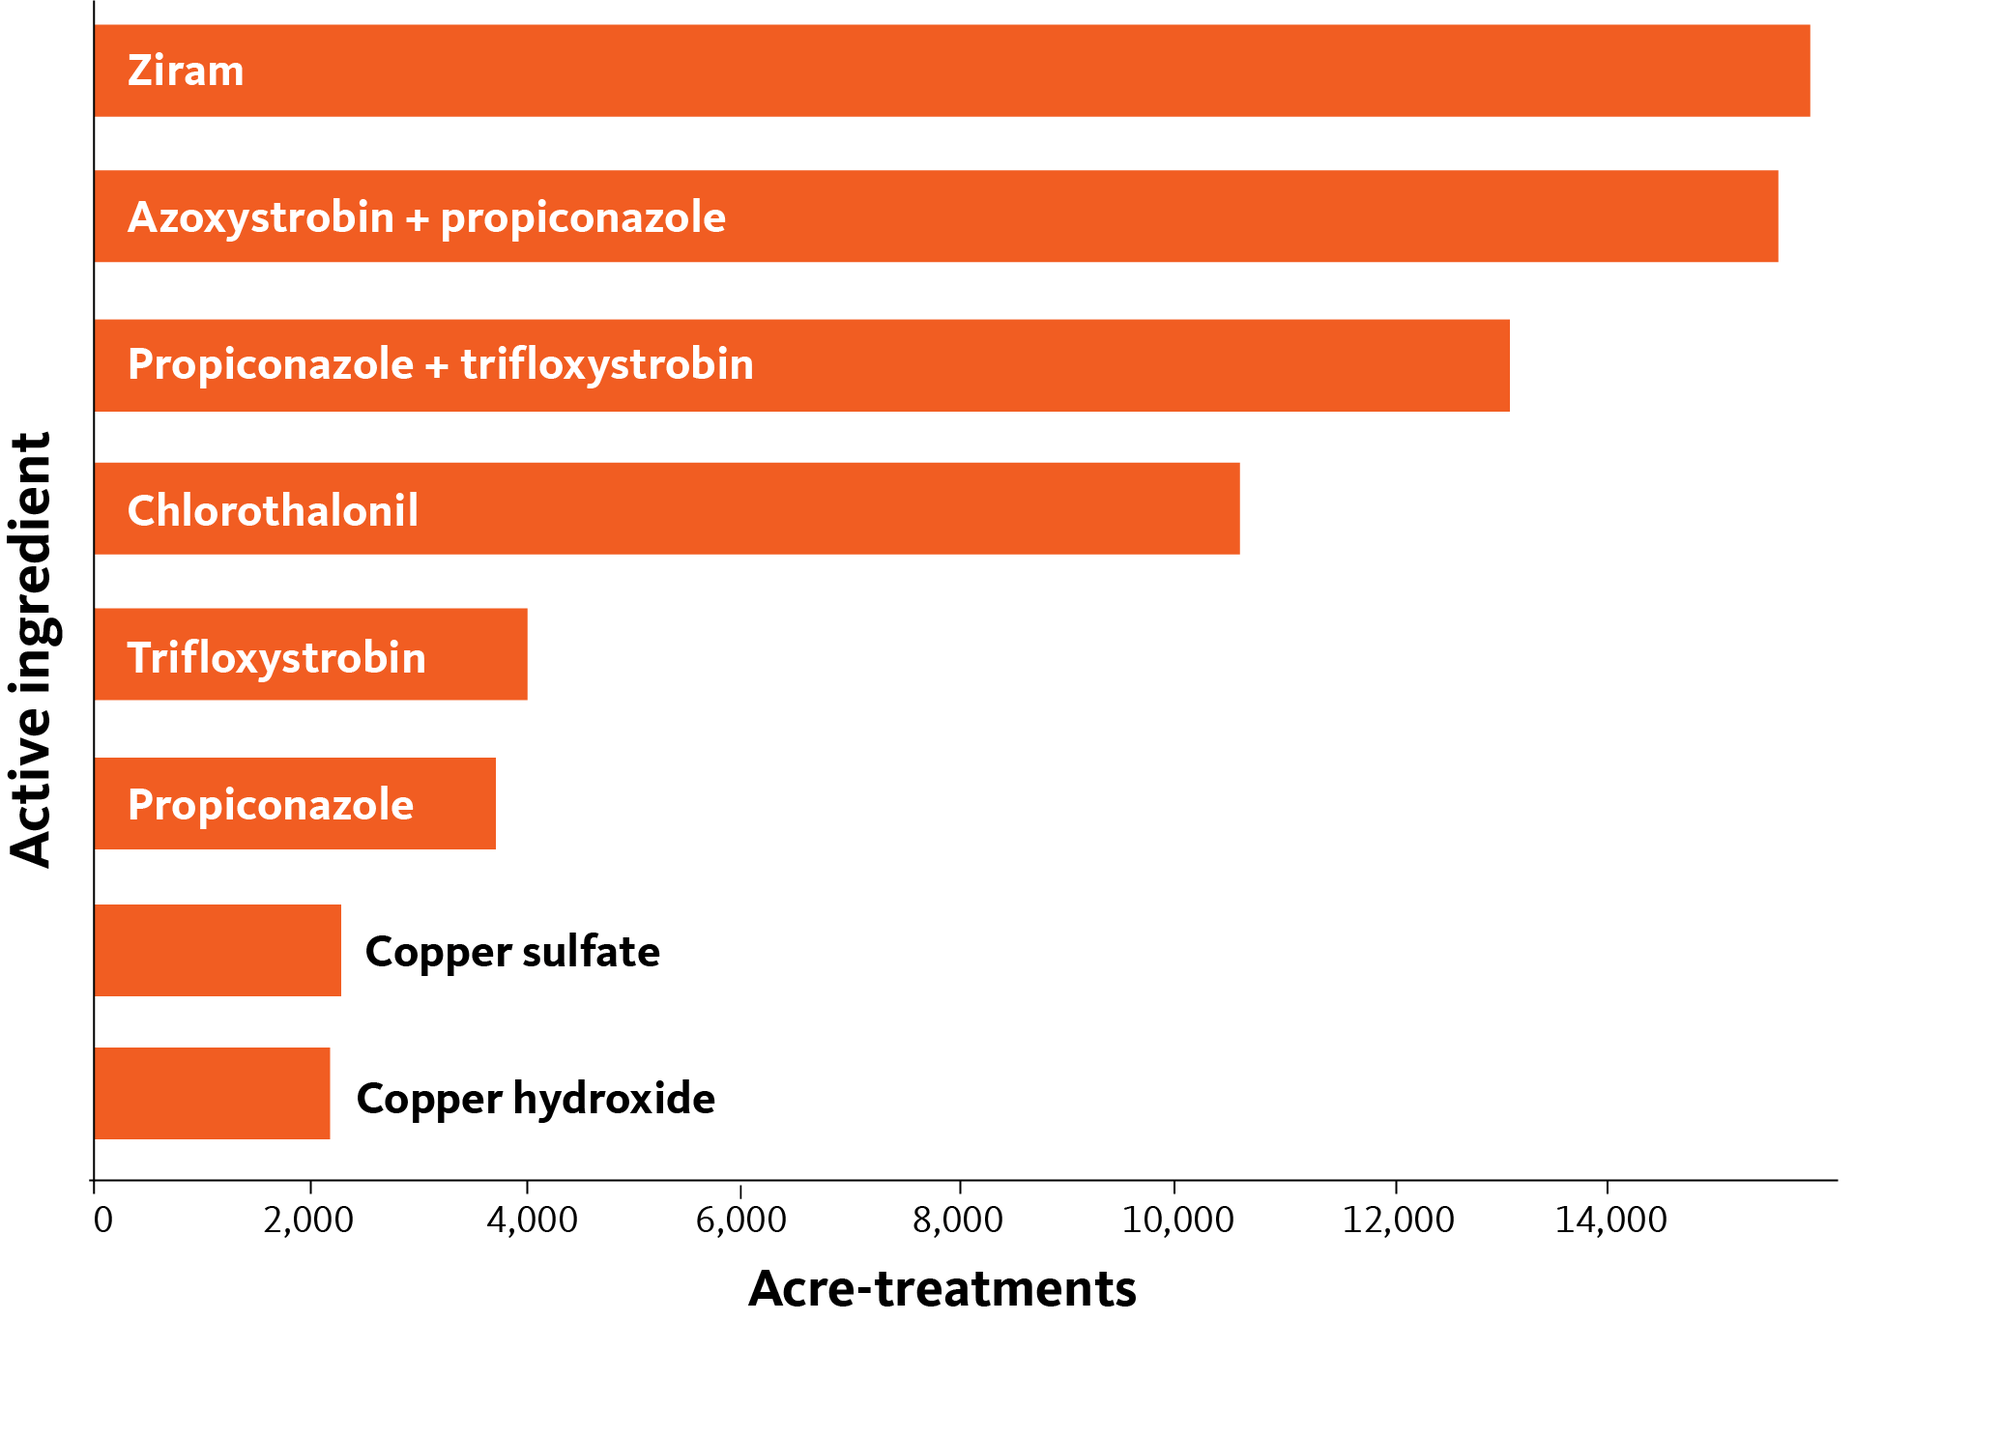
Acre-treatments for commonly used fungicides
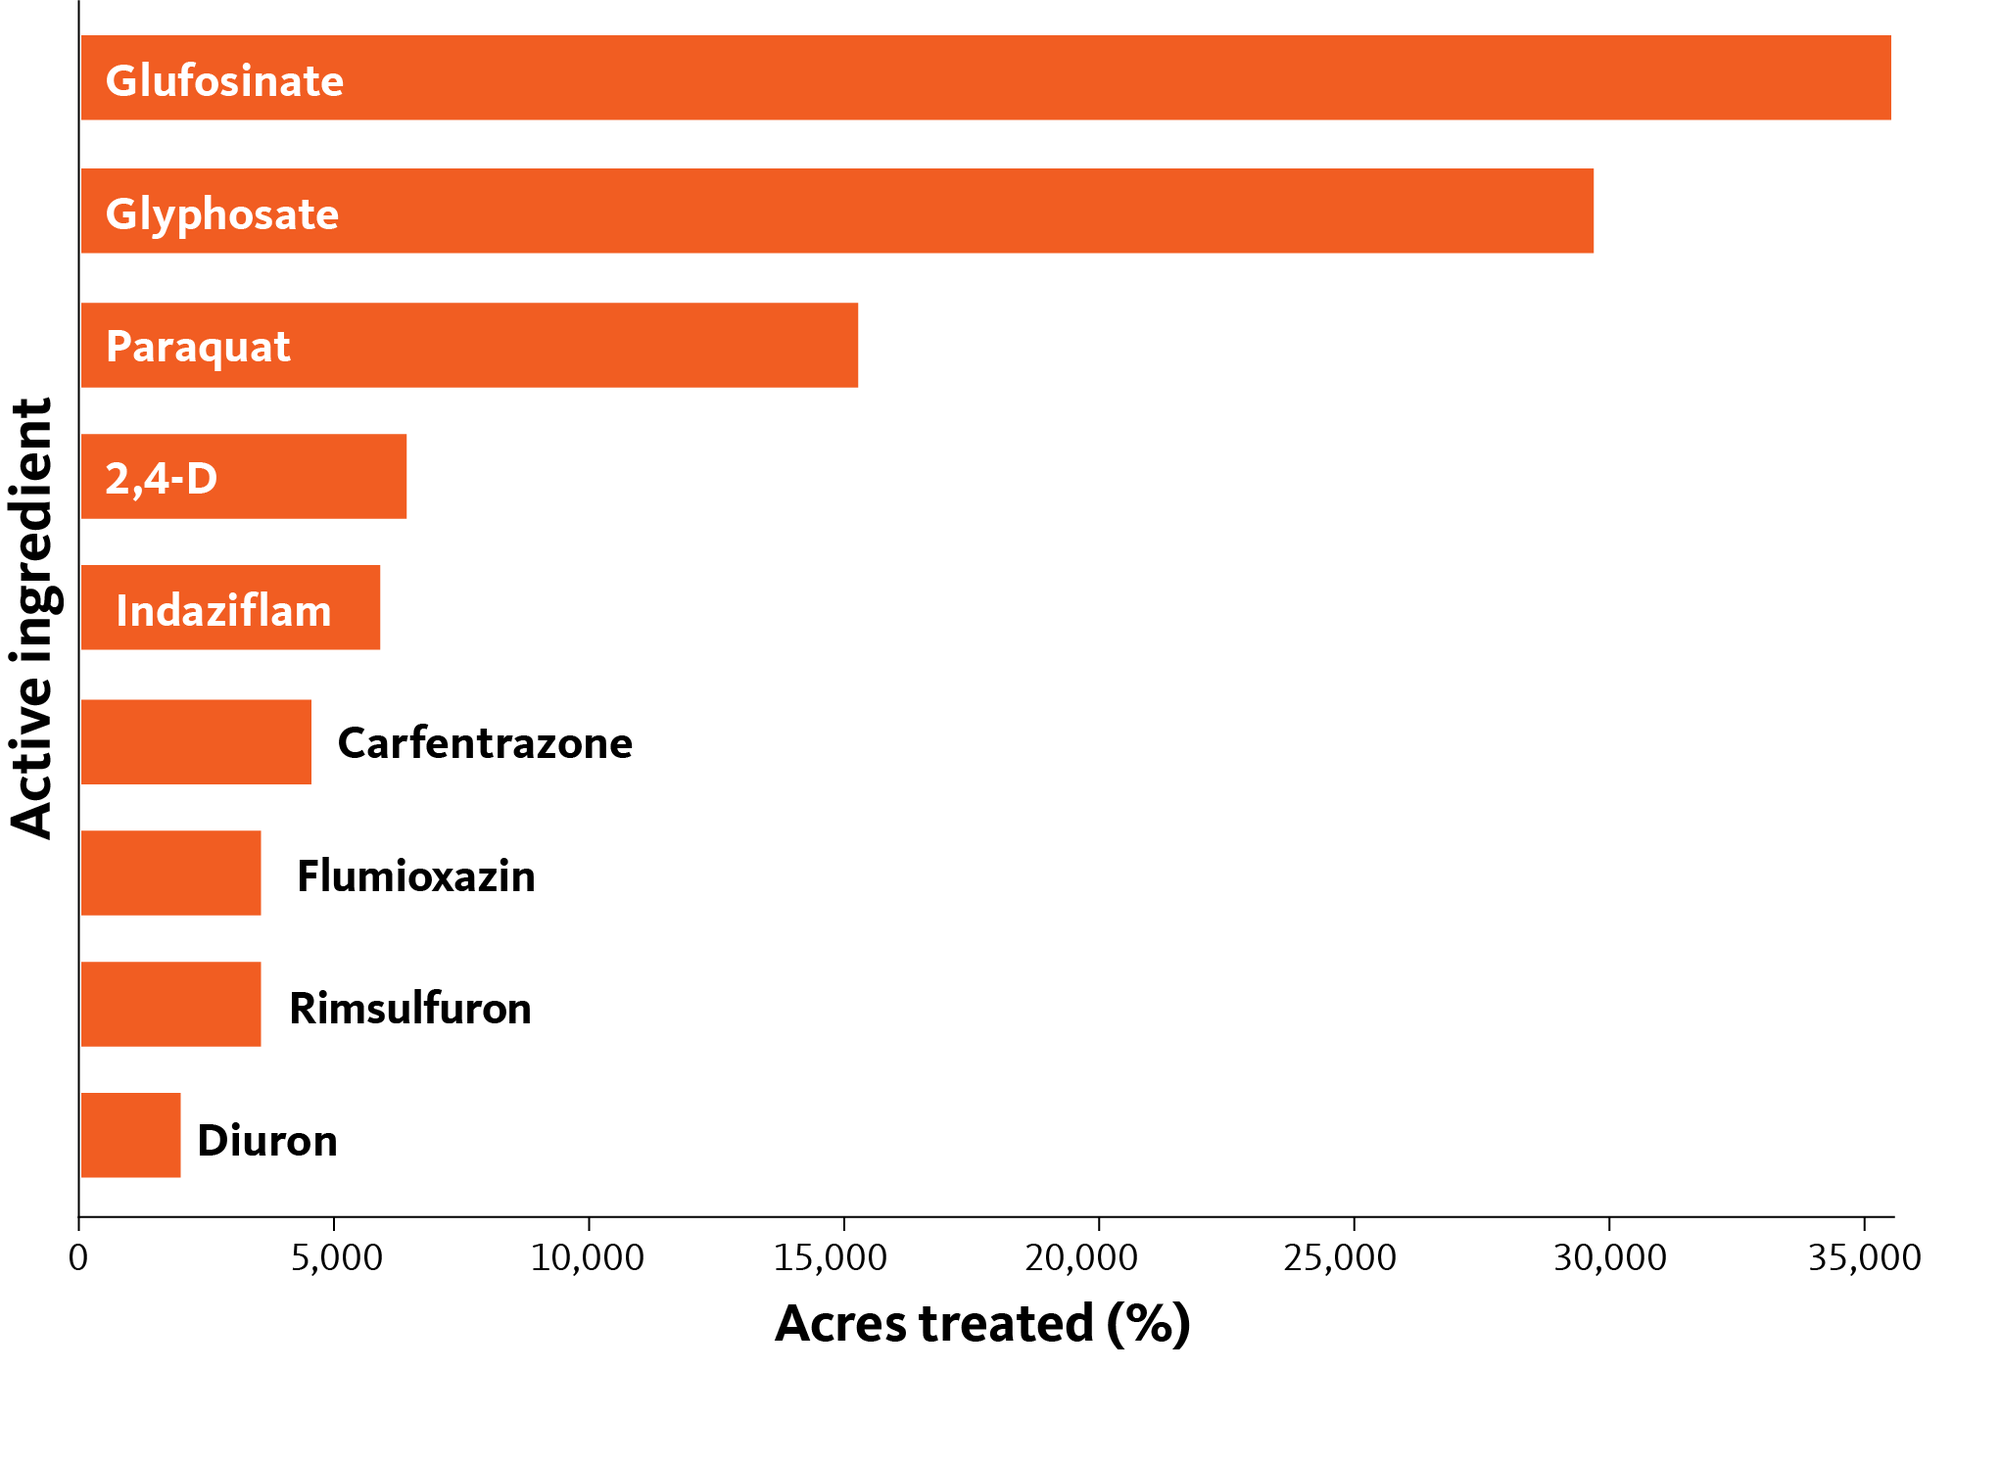
Acre-treatments for commonly used herbicides
Overall economic impacts
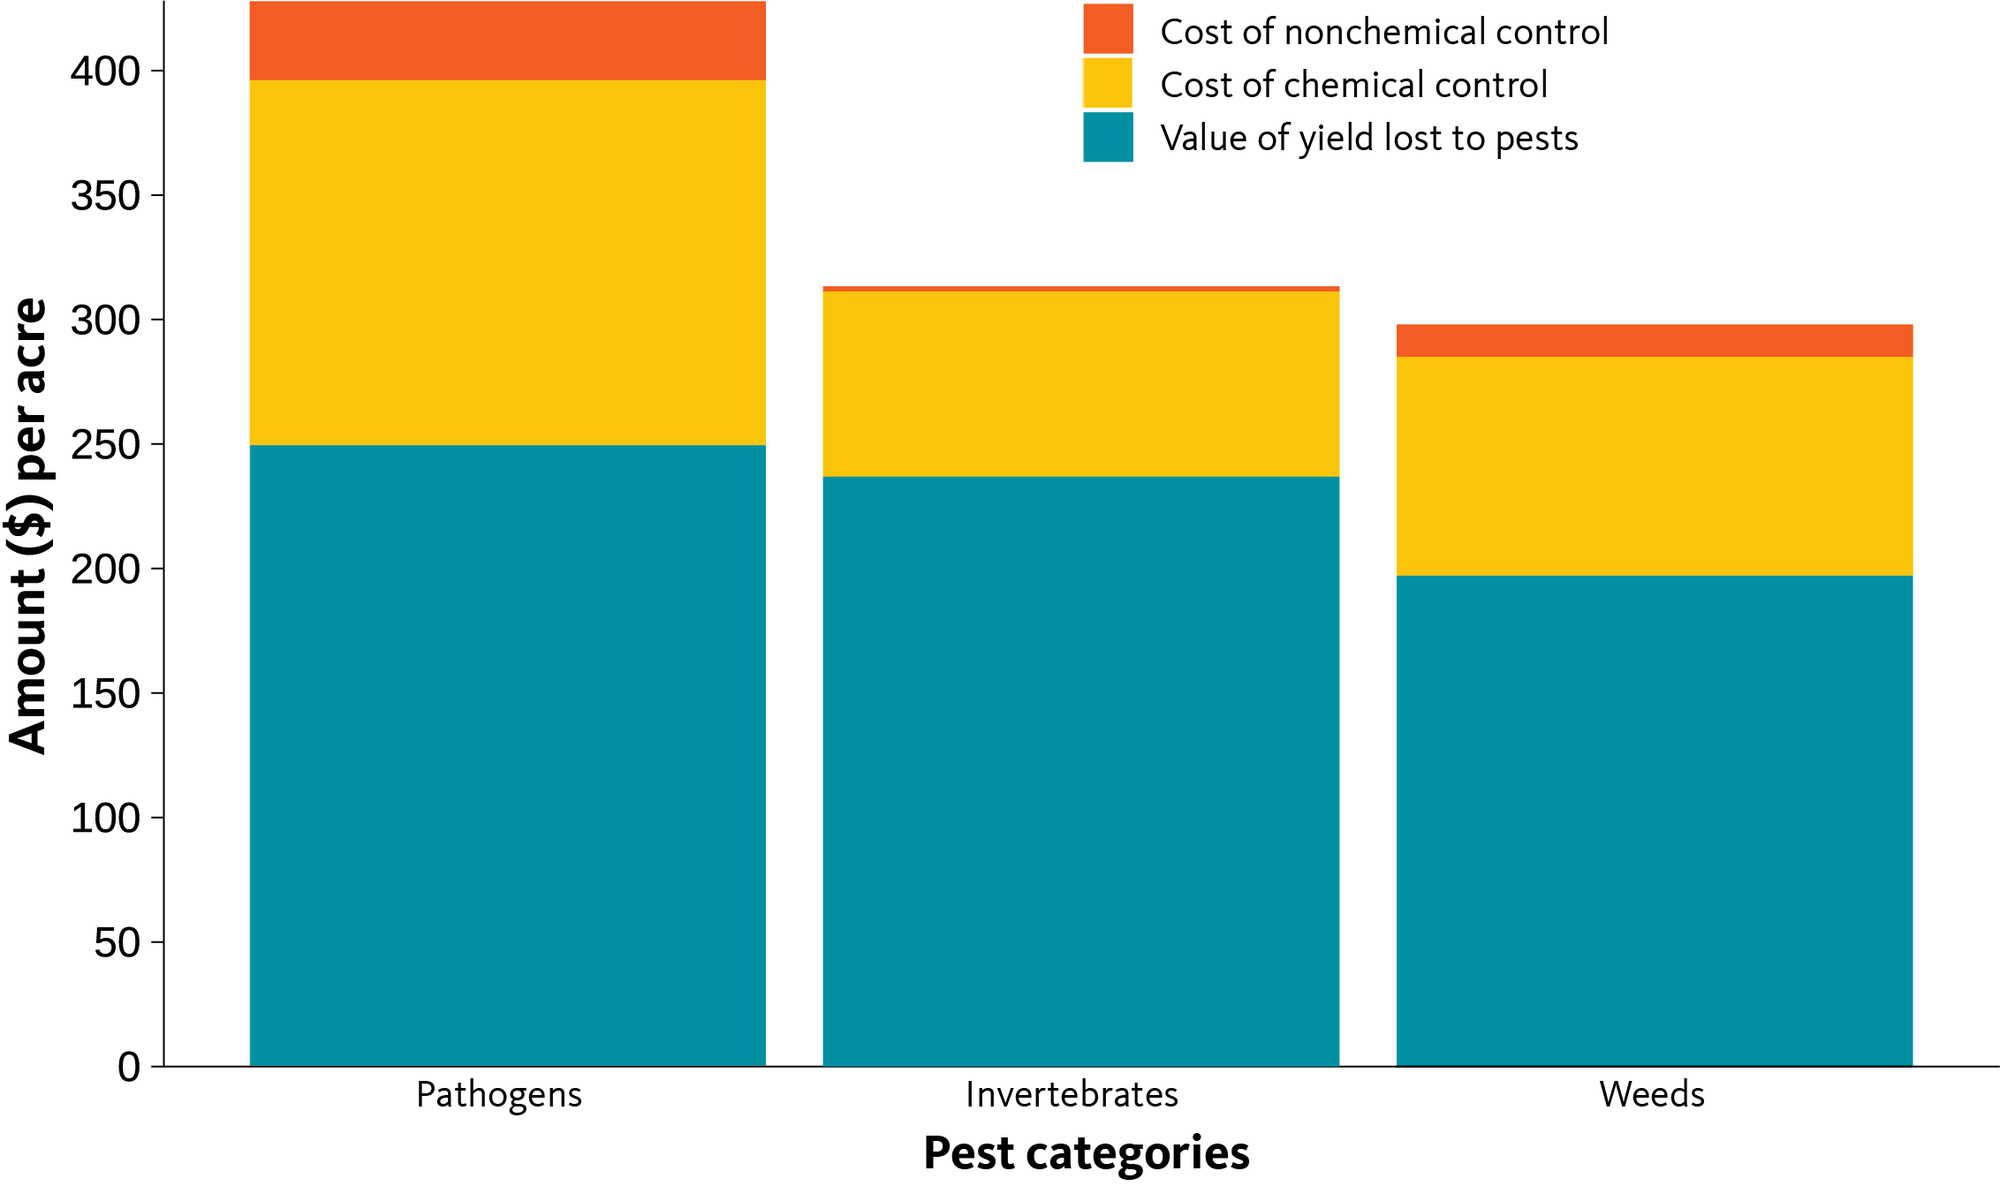
To get an idea of the overall economic impacts of yield loss and pest management across the entire survey area, we calculated a per-acre average of all pest management costs (chemical as well as additional or “nonchemical” costs), as well as the value of the total yield losses reported, which occurred despite the management methods employed. As previously mentioned, the nonchemical costs are an area for improvement in our survey process.
Summary of economic impacts per acre, across all survey acreage
Economic return
In section 1, we used respondents’ average actual yield estimates (in lb) and average price estimates to determine that the average surveyed acre of Oregon hazelnut had the potential to generate $3,017 per acre (Table 1). On average, our respondents estimated that pests reduced yield by an estimated $684/acre. Using cost and application estimates, we determined the cost of chemical and nonchemical pest, disease and weed management to be $355/acre (Table 5). This leaves an average of $1,978 per acre after pest management costs. There are many notable caveats to this revenue estimation. Mainly, several additional farming and business costs are not covered by this analysis. In addition, the estimation of nonchemical pest management costs are a particularly challenging undertaking, and the estimations presented in this report are likely underestimates. One key goal for the future is to accurately estimate and document the costs of nonchemical pest management practices.
| Pest category | Nonchemical control costs ($/ac) | Chemical control costs ($/ac) | Total control costs ($/ac) |
|---|---|---|---|
| Diseases | 31.64 | 146.64 | 178.28 |
| Insects | 2.04 | 74.43 | 76.47 |
| Weeds | 12.93 | 87.81 | 100.73 |
| Total | 46.61 | 308.88 | 355.48 |
Discussion
Detailed information regarding the economic impacts of pests and their management is critical to understanding ways to improve pest management and advance IPM. Our respondents reported a 43% difference between the maximum attainable yield and the actual yield, with almost half of this difference attributed to pest damage, indicating much scope for increasing pest management efficiency.
However, yield and pest management in hazelnuts vary depending on orchard age. This survey included respondents who managed orchards of all ages — from newly planted to mature orchards. Hazelnut yield (lb/acre) depends on stand age, hazelnut variety, stand density and other factors. Stands under 3 years old generally produce under 150 lb/ac, with yield increasing steadily every year until maturity. Mature stands (12+ years old) can produce 4,000 lb of dry nuts per acre.
Yield and pest management in Oregon hazelnuts also changed profoundly after 2007, when the Oregon State University hazelnut breeding program introduced hazelnut cultivars with increased yield capabilities and resistance to Eastern filbert blight. Future surveys could be adapted to incorporate orchard age and cultivar distribution to capture the significant differences in yield and pest management that arise from these factors. This will be considered in consultations with industry representatives.
Our respondents estimated an overall yield loss of 17% due to pests, despite an average of $309 per acre spent on chemical management (Table 5). Respondents reported diseases as having the largest overall negative impact on hazelnut yield, at around 6.1% of yield lost per acre. Invertebrates closely followed with an estimated 5.8% yield loss per acre, and weed species are reported to have negatively impacted yield loss at 3.1%. Three species — Eastern filbert blight, aphids and filbertworm — collectively dominated these negative impact estimations, contributing close to 10% yield loss on average. This significant yield loss reveals a clear and urgent need for identifying effective, economical and sustainable pest management strategies for the hazelnut industry.
Eastern filbert blight significantly impacted hazelnut yield in mature orchards where blight-resistant cultivars were not planted, and our respondents estimated an average 13% yield loss and 3.8 fungicide applications on acreage where it was present. In these cases, the average total expense of chemical pest management is $140/acre. Stands planted with blight-resistant strains generally require just a single treatment once per season when trees are young.
Aphids emerged as a key invertebrate pest for Oregon hazelnut based on our survey data. It was reported that they occur on 100% of surveyed acreage and cause the second-largest yield reduction of any pest species at 2.4%. They were the third most expensive invertebrate pest to treat, at $40/acre on average. Trioxys pallidus, a small braconid wasp introduced in the 1980s, has become established in the Willamette Valley and can take the place of chemical aphid management in many hazelnut orchards. Lag times between aphid population increase and wasp population increase are not always recognized by growers.
Filbertworm occurred on 64% of acreage surveyed, causing an estimated 3.1% yield reduction on acreage where it occurred, and a 2.1% yield loss overall. It was among the pests receiving the highest number of pesticide applications per season, at 1.9 applications, at a cost of $55 per acre, on average. According to hazelnut Extension specialists, the insecticide esfenvalerate is the most common product used for filbertworm, and is reported to cost approximately $8/acre. Esfenvalerate was applied on 56% of our survey acreage and was the most commonly used insecticide in our survey. Our respondents also reported using alternative, reduced-risk materials such as methoxyfenozide, spinosad, spinetoram and chlorotraniliprole to manage filbertworm. According to our data, these products can cost anywhere from $35/acre to $90/acre, raising the average application cost.
Pheromone trapping and mating disruption are increasingly being used to manage filbertworm. These strategies have the added benefit of protecting beneficial arthropods. Using pheromone traps and degree-day modeling for filbertworm enables precise, targeted treatments, reducing the need for aphicides and improving the survival of predators and parasitoids that attack leafrollers and filbertworm.
Though they only occurred on 4% of surveyed acreage, borer species were reported as treated on over 44% of surveyed acreage and required an average of 1.8 sprays per season, implying that growers proactively treat for borer species. Typically, only new orchards are treated for flatheaded borers.
Root rots also only occurred on 4% of acreage, and were treated on 6.2% of acreage. They caused a 9.4% yield loss locally.
Chlorpyrifos is an important tool for controlling omnivorous leaftier, reported on 22% of surveyed acreage. Notably, this pest is only problematic on 1- to 2-year-old orchards. A single spray of chlorpyrifos was conducted on approximately 25% of the acreage surveyed. In 2020, the Oregon Department of Agriculture initiated restrictions that will lead to a phaseout of this pesticide by 2023. This change will require additional research and education to ensure growers have replacement tools to effectively manage this pest.
A novel, emerging arthropod pest, the brown marmorated stink bug, was reported on 25% of surveyed acreage. Research is underway to identify effective nonchemical management for this new pest.
Annual grasses are a key pest grouping based on our survey, occurring on 99% of surveyed acreage and responsible for a 1.4% yield loss on acreage where these species occur. They were also the primary driver of herbicide use among our respondents and were reported as the main target for chemical applications on 93% of surveyed acreage while receiving an average of 1.2 herbicide applications per season. This species group was the second most expensive pest to treat, at $47 per treated acre.
As explained earlier, some pests, such as borers and root rots, cause considerable damage to acres where they are present but have a limited distribution. Others, such as annual grasses and weeds, might be less damaging where they occur, but more widespread in their presence. Some can be both widespread and damaging (for example, Eastern filbert blight). Effective response depends on understanding these patterns in detail. We must also consider the risks that growers take when fine-tuning their IPM approaches.
Our low confidence level in the reported costs associated with nonchemical IPM practices is a result of the challenge of effectively estimating these costs. This is an important area for improvement, especially in hazelnut, where many effective nonchemical management strategies reduce reliance on pesticides. IPM includes a full suite of nonchemical activities, and better accounting for the costs, as well as the value, of these activities to growers will further inform the system and advance IPM.
Finally, although our survey attempts to measure many sources of yield loss in Oregon hazelnuts, it does not account for impacts to quality, vertebrate pest losses and biennial bearing, all of which can result in significant economic losses. For example, vertebrate pests can have a severe impact on hazelnut crop yield. Based on what we learned in this first survey, future surveys should incorporate questions about yield loss to birds, rodents and deer. In addition, our survey did not ask respondents to differentiate between “green weight” and “merchantable yield” in their overall yield estimates. Merchantable yield represents yield after drying and defects have been taken out. These are additional opportunities to increase our ability to capture the full range of pest impacts.
The data on pest losses and management presented here provide detailed, valuable and previously missing information regarding IPM in hazelnut. Regularly gathered data can help us track changes in pest pressure and management over time, prepare for emerging problem pests and target specific areas with pest management resources. Collected over time, these data provide economic metrics for IPM that should be of direct value to growers and decision-makers, and also to research and Extension efforts.
References
Cerda R., J. Avelino, C. Gary, P. Tixier, E. Lechevallier, C. Allinne. 2017. Primary and Secondary Yield Losses Caused by Pests and Diseases: Assessment and Modeling in Coffee. PLoS ONE 12(1): e0169133.
Ellsworth, P.C., A. Fournier and W. Dixon. 2007 (rev. 1/2020). Arizona Cotton Insect Losses. Publ. No. AZ1183. University of Arizona, College of Agriculture and Life Sciences, Cooperative Extension, Tucson, Arizona. Updated data available upon request.
Ellsworth, P. C., A.J. Fournier, J.C. Palumbo, S.E. Naranjo and G.B. Frisvold. 2016. Chronicling Successful Integration of Technology and Knowledge Over 25 Years of IPM in Arizona. Economics of IPM in the 21st Century: Multiple Perspectives from Around the World. International Congress Entomology ICE 2016, Orlando, Florida. Sept. 26, 2016.
Lobell, D.B., K.G. Cassman and C.B. Field. 2009. Crop Yield Gaps: Their Importance, Magnitudes, and Causes. Annual Review of Environment and Resources. 2009 34:1, 179-204.
USDA National Agricultural Statistics Service (2017). NASS -Quick Stats (2020). Accessed Dec. 10, 2020.
Oregon Department of Agriculture (2020). Oregon Agricultural Statistics & Directory 2020.
Palumbo, J.C. 2019. Insect Losses and Management on Desert Lettuce: A 15-Year Summary. University of Arizona Vegetable IPM Update, Vol. 10, No. 13. June 2019.
Popp, J., and K. Hantos. 2011. The impact of crop protection on agricultural production. Studies in Agricultural Economics, No. 113.
Appendix 2: Survey question outline
General yield and losses information
Respondent crop yield and pricing general information
Acres managed
Actual yield per acre
Maximum attainable yield per acre
Price received per pound
General factors impacting crop yield
Overall percent loss due to weather damage
Overall percent loss due to chemical injury
Overall percent loss due to insect species
Overall percent loss due to diseases
Overall percent loss due to weeds
Overall percent loss due to nematodes
Overall percent loss due to distillation method/process
Overall percent loss due to “other pests” [indicate]
Overall percent loss due to “other factors” [indicate]
Type of production
Percent acres managed that are certified organic
Percent acres managed that are transitional
Percent acres managed that are conventional
Fumigation
General fumigation information
Number of acres fumigated
Cost per acre for fumigation
Fumigation target pests
Additional fumigation targets
Information on specific fumigation targets
Fumigation target (select from list of pest species)
Percent intended target of fumigation
Specific product(s) used
Pesticide application data
Air
Percent acres treated by air
Average applications by air
Average cost ($) per acre for a single aerial application (excluding application cost)
Ground
Percent acres treated by ground
Average applications by ground
Average cost ($) per acre for a single ground application (excluding application cost)
Chemigation
Percent acres treated by chemigation
Average applications by chemigation
Average cost ($) per acre for a single chemigation application (excluding application cost)
Losses due to specific insect pests
Number of acres where pest was present
Number of acres treated for pest
Average percent yield loss due to pest on infested acres
Number of applications used for pest
Average cost of single application (including application cost)
Pest losses due to specific diseases
Number of acres where pest was present
Number of acres treated for pest
Average percent yield loss due to pest on infested acres
Number of applications used for pest
Average cost of single application (including application cost)
Pest losses due to specific weeds
Number of acres where pest was present
Number of acres treated for pest
Average percent yield loss due to pest on infested acres
Number of applications used for pest
Average cost of single application (including application cost)
Insecticide application data
Number of acres treated per insecticide
Average number of applications per insecticide
Cost of product per acre
Target pest
Average rate of application (low, medium, max)
Timing of application (early, midseason, late or a combination)
Application method (ground, air, chemigation)
Historic use of product
Fungicide application data
Number of acres treated per fungicide
Average number of applications per fungicide
Cost of product per acre
Target pest
Average rate of application (low, medium, max)
Timing of application (early, midseason, late or a combination)
Application method (ground, air, chemigation)
Historic use of product
Herbicide application data
Number of acres treated per herbicide
Average number of applications per herbicide
Cost of product per acre
Target pest
Average rate of application (low, medium, max)
Timing of application (early, midseason, late or a combination)
Application method (ground, air, chemigation)
Historic use of product
Nonchemical insect control practices
Number of acres where practice was utilized
Estimated cost per acre
Target insect
Nonchemical pathogen control practices
Number of acres where practice was utilized
Estimated cost per acre
Target insect
Nonchemical weed control practices
Number of acres where practice was utilized
Estimated cost per acre
Target insect
About the authors

¡Use los pesticidas con seguridad!
- Póngase ropa de protección y equipo de seguridad según las recomendaciones de la etiqueta. Báñese después de cada uso.
- Lea la etiqueta del pesticida—aunque lo haya usado antes. Siga al pie de la letra las indicaciones de la etiqueta (y cualquiera otra indicación que Ud. tenga).
- Tenga precaución al aplicar los pesticidas. Conozca su responsabilidad legal como aplicador de pesticidas. Usted puede ser responsable de heridas o daños resultantes del uso de un pesticida.
Trade-name products and services are mentioned as illustrations only. This does not mean that the Oregon State University Extension Service either endorses these products and services or intends to discriminate against products and services not mentioned.