Abstract
Crop yield is the most important parameter measured by agricultural researchers conducting applied research. The objective of this study was to validate the performance of the “WeiSEL,” a new plot combine yield measurement system manufactured by Zürn Harvesting GmbH & Co. KG, Germany (2020 Model: Zürn 110). Small plots of winter wheat were harvested at two locations in Oregon in the Inland Pacific Northwest (Figure 1). A scatter plot of grain yield data from the combine weigh system and grain yield measured manually with a calibrated platform scale revealed a significant and highly positive linear relationship (r=0.98). Further, a Bland-Altman analysis revealed a good agreement between the WieSEL yield data and manually weighed yield data. This is the first independent validation of the new WieSEL weigh system. It appears to be a less expensive and reliable alternative to manual yield collection methods.

Introduction
Grain yield of wheat is essential for evaluating the profitability of new germplasm and experimental treatments related to agricultural methods, practices, products and techniques. Accurate and timely grain yield measurements are critical for researchers to deliver important information to producers to estimate crop performance and farming profitability. Precision agriculture has been adopted for many crops, and yield-monitoring systems are an essential component of modern precision agriculture. These systems can provide producers and agricultural researchers with real-time, post-harvest feedback on crop yield.
On-combine yield monitoring systems have become common since the development of commercial yield-monitoring technology in the U.S. in the early 1990s. More recently, integrated yield-monitoring technology has become available on small-scale plot equipment for agricultural researchers. A desirable yield monitoring system should be reliable, practical and relatively affordable for crop producers and agricultural researchers.
Commercial-scale yield equipment is typically integrated with a Global Positioning System. Yield is measured by force impact plates, optical sensors or microwave sensors. Research-scale, on-combine weigh systems instead typically utilize load cell systems to deliver grain weight. The researcher must then calculate the weight into yield using the surface area of the harvested plot.
Marketplace options for plot combine weigh systems for agricultural researchers are limited. The options include HarvestMaster by Juniper Systems (Logan, Utah), Schlingmann Weigh System by Schlingmann (Germany), ALMACO Weigh Hopper by ALMACO (Nevada, Iowa), and WeiSEL by Zürn Harvesting (Germany). All of these systems function with the same basic framework and load cell technology. The main differences are the graphical user interface and plot combine compatibility. Price, options and compatibility vary greatly among weighing systems. Researchers should contact company representatives to obtain product options and quotes.
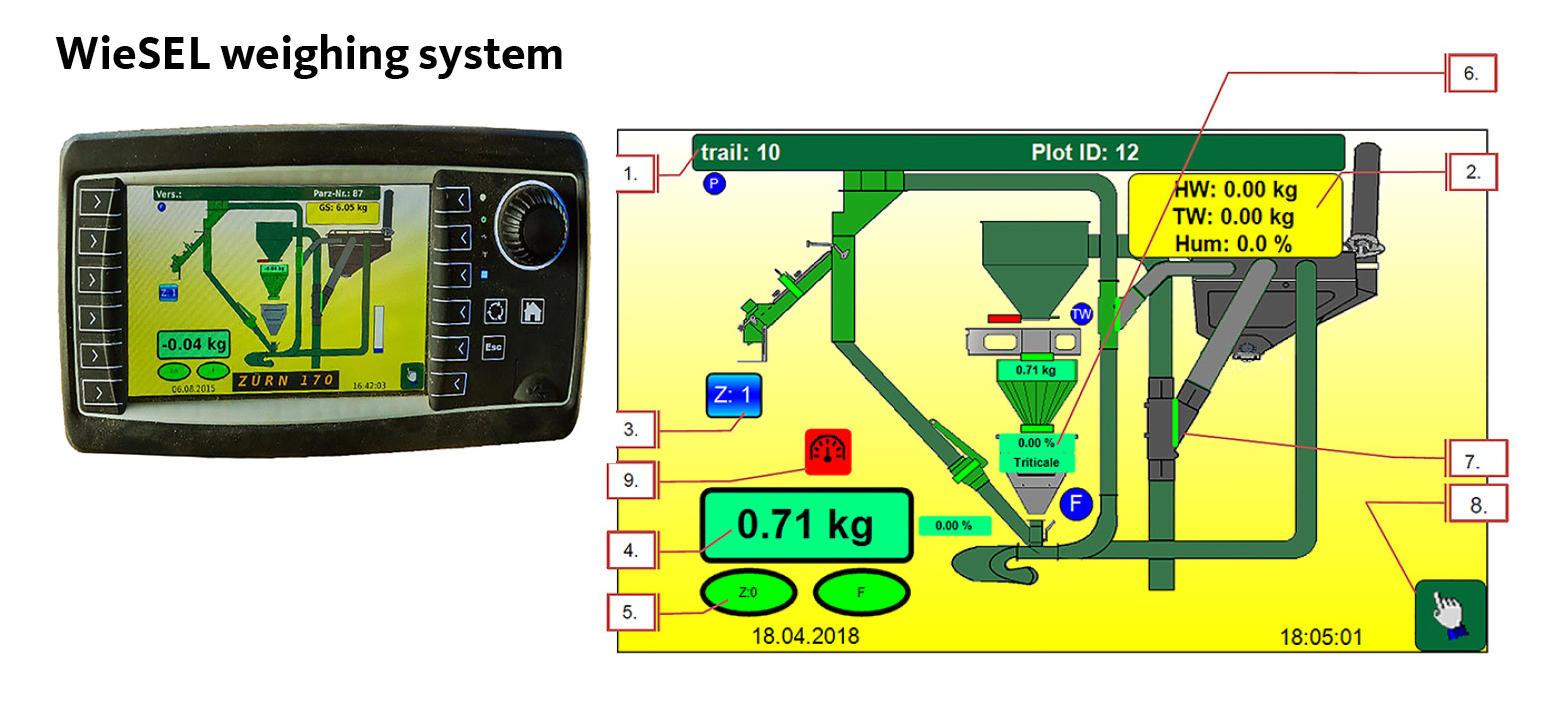
For agricultural researchers utilizing small plot combines, many on-combine yield-monitoring systems are cost-prohibitive, do not integrate with antiquated research equipment or both. Consequently, it is common for researchers to collect threshed grain from the entire plot and weigh bags with a stand-alone calibrated scale after harvest. This technique requires more labor than an integrated system and can delay the data-collection process while grain sacks are organized and weighed independently from harvest. A new weigh system integrated with the plot combine, the WieSEL, was developed by Zürn Harvesting GmbH & Co. KG in Germany (Figure 2). Its simple design makes its price lower than competitors.
The weighing system provides a compact user terminal and multiple modular function expansions, such as:
- A weigh system for analysis of the plot yield.
- Seed moisture measurement (not included in this study).
- A near infrared reflectance spectroscopy (NIRS) system to analyze value-determining components of the crop, including protein (not included in this study).
- Plot-management system for data processing.
The WieSEL weigh system requires clean samples to measure plot weight and to create accurate data. The ZURN 110 plot combine and its 1.6-square-meter cleaning surface provide the required clean samples. After the threshing and cleaning process, the grain moves pneumatically to the WieSEL weighing bucket. The weighing process takes two to three seconds, and the system communicates the plot weight immediately to the operator through an onboard computer and graphical user interface. The WieSEL system enables the research team to take a sample before the seed flows to a bulk grain tank after the weighing process. The operator has an overview of the cleaning and weighing process on the screen, allowing the operator to know exactly when the system is ready to begin harvesting the next plot.
This is the first independent validation study of the new WieSEL weigh system for the agricultural research industry.
Material and methods
Field sites and plots
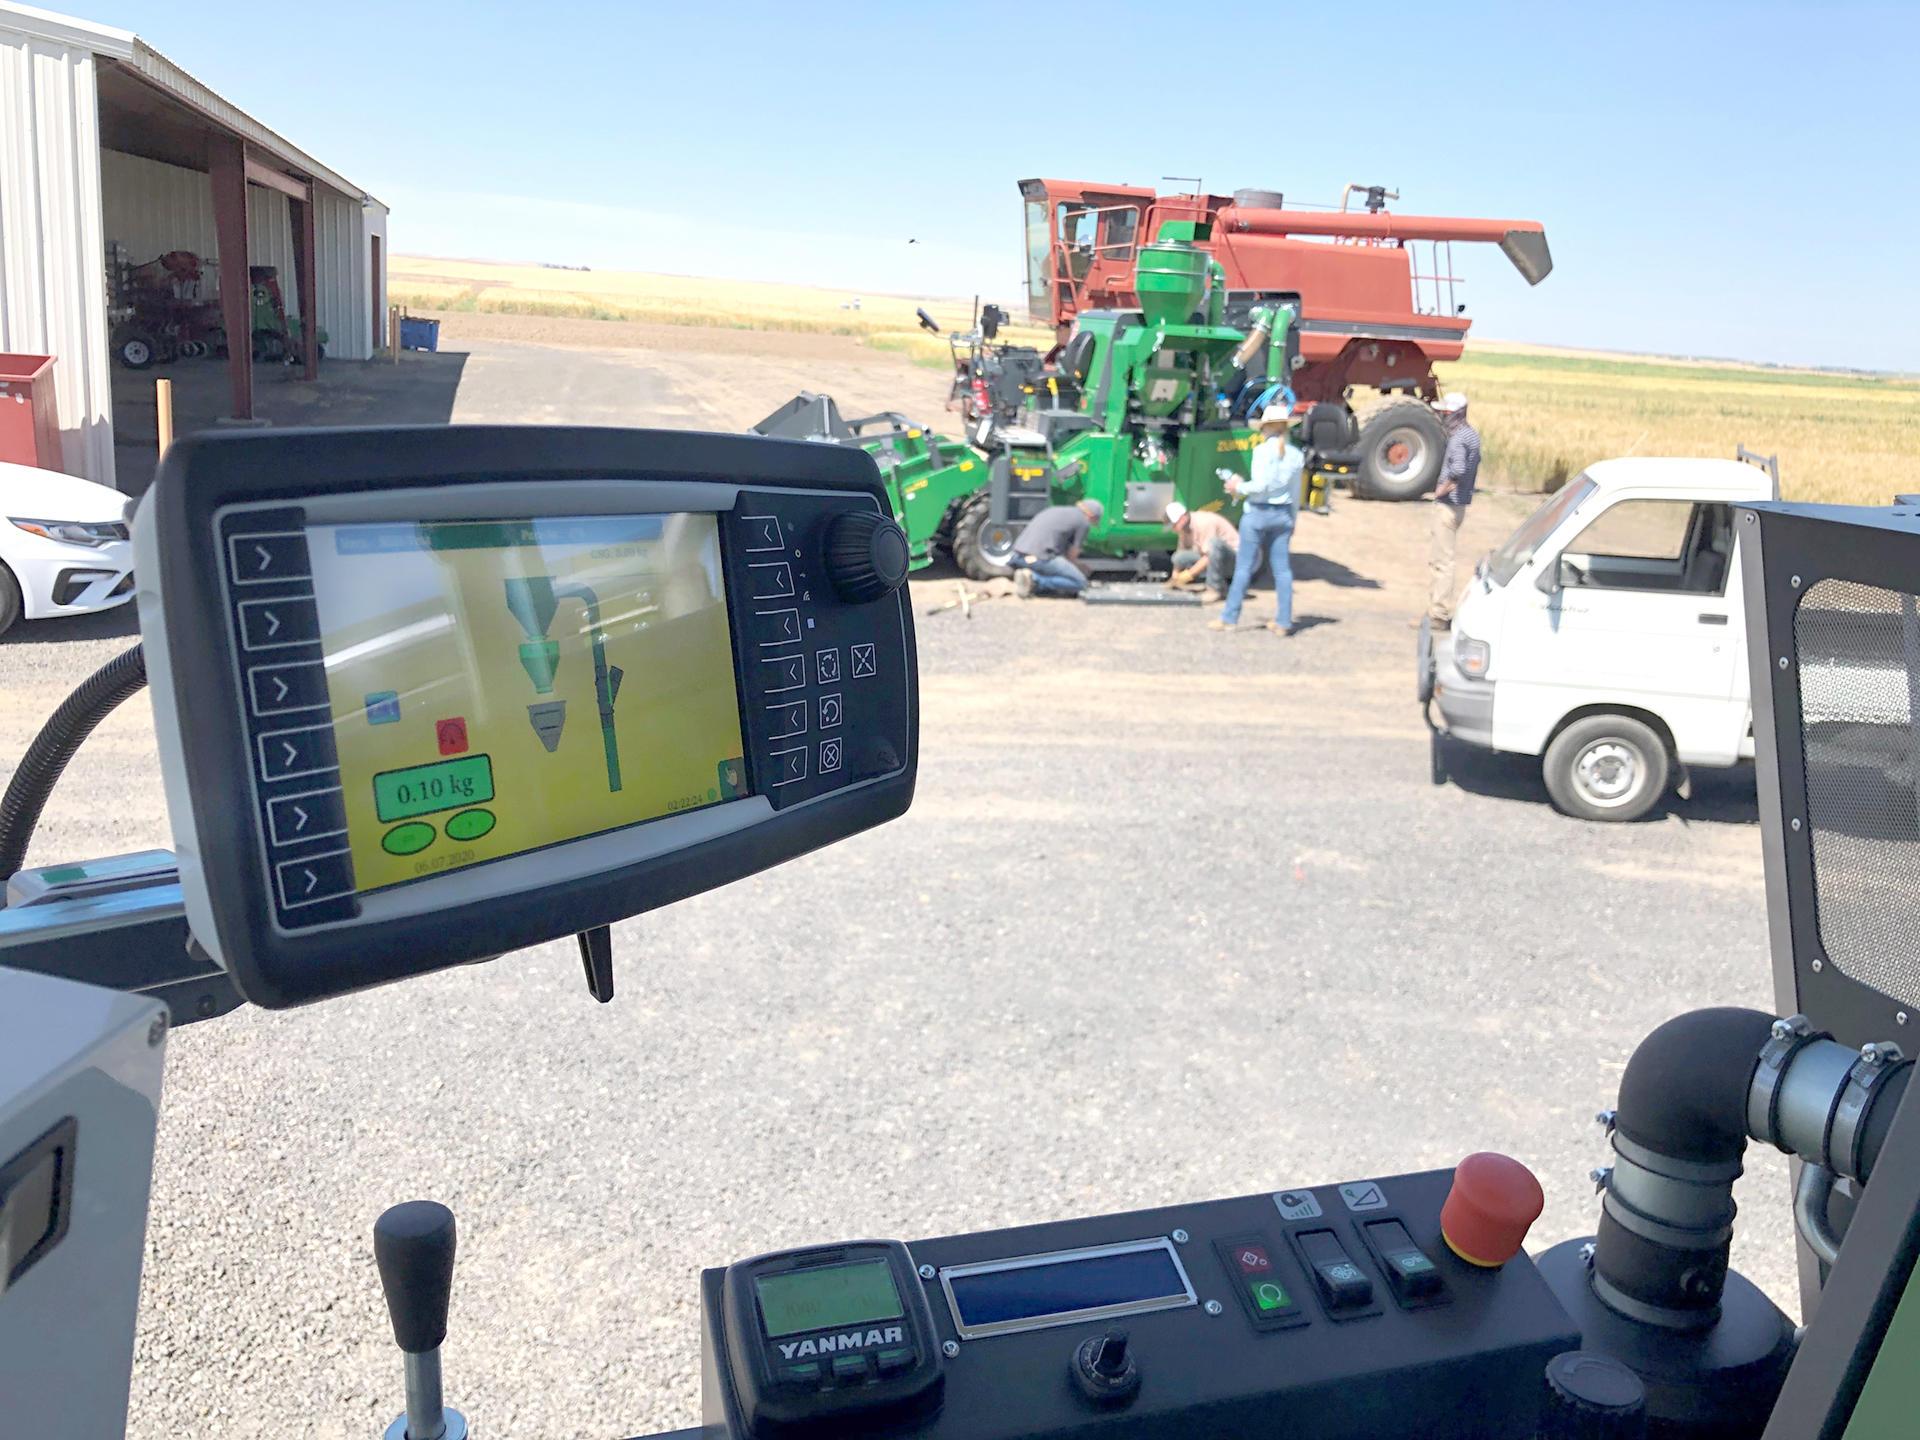
To evaluate the performance of the WieSEL weigh system, two sets of winter wheat experiments (noted here as Site 1 and Site 2), were established in commercial winter wheat fields in Morrow County, Oregon (~119.6°N; 45.5°W). Site 1 included 54 plots and Site 2 included 53 plots (one sample was lost in error). Each plot was 1.5 meters wide by 12.2 meters long. The soft white winter wheat cultivar ‘Appleby’ was seeded at both sites with a no-till plot drill into each plot on Sept. 28, 2019. All plots were managed uniformly within experiments using an appropriate fertility program based on soil test reports. Weed management and pest control were typical for winter wheat production in the Inland Pacific Northwest.
Wheat harvest and yield measurements
Prior to harvest, the WieSEL weigh system was calibrated according to manufacturer instructions. Wheat was harvested with a compact plot combine (Zürn Harvesting GmbH & Co. KG, Germany, Model: Zürn 110) on July 8, 2020. The grain yield of each plot (measured in kilograms per plot) from 107 plots was collected from the WieSEL weigh system integrated with the plot combine. To validate the accuracy of data collected from the weigh system, the harvested grain from each plot was bagged and weighed manually in a nearby warehouse with a calibrated Cardinal DETECTO (model No. 5852F-210) platform scale (Webb City, Missouri) within three hours of harvest. According to the National Conference of Weights and Measures, the Cardinal platform scale is an electronic, Class III “legal-for-trade” balance.
Data analysis
Pearson’s correlation coefficient was used to examine the relationship between grain yield measured by the WieSEL system and the grain yield measured with the manually operated platform scale. A Bland-Altman analysis was used to examine agreement between the two methods. Data were normally distributed. The manual platform scale was considered the standard method in this study, as researchers without an on-combine weigh system would be utilizing a manual scale to obtain yield post-harvest. Error was calculated as the percent difference between the two methods. The scatter plot was used to graphically present the paired measurements using the ggplot2 package in R.
Results and discussion
Grain yield measured by the onboard WieSEL system ranged from 4.32 to 7.06 kilograms per plot. Grain yield measured manually with the platform scale ranged from 5.10 to 7.50 kilograms per plot. The average grain yield error of 4.83% is within the acceptable range.
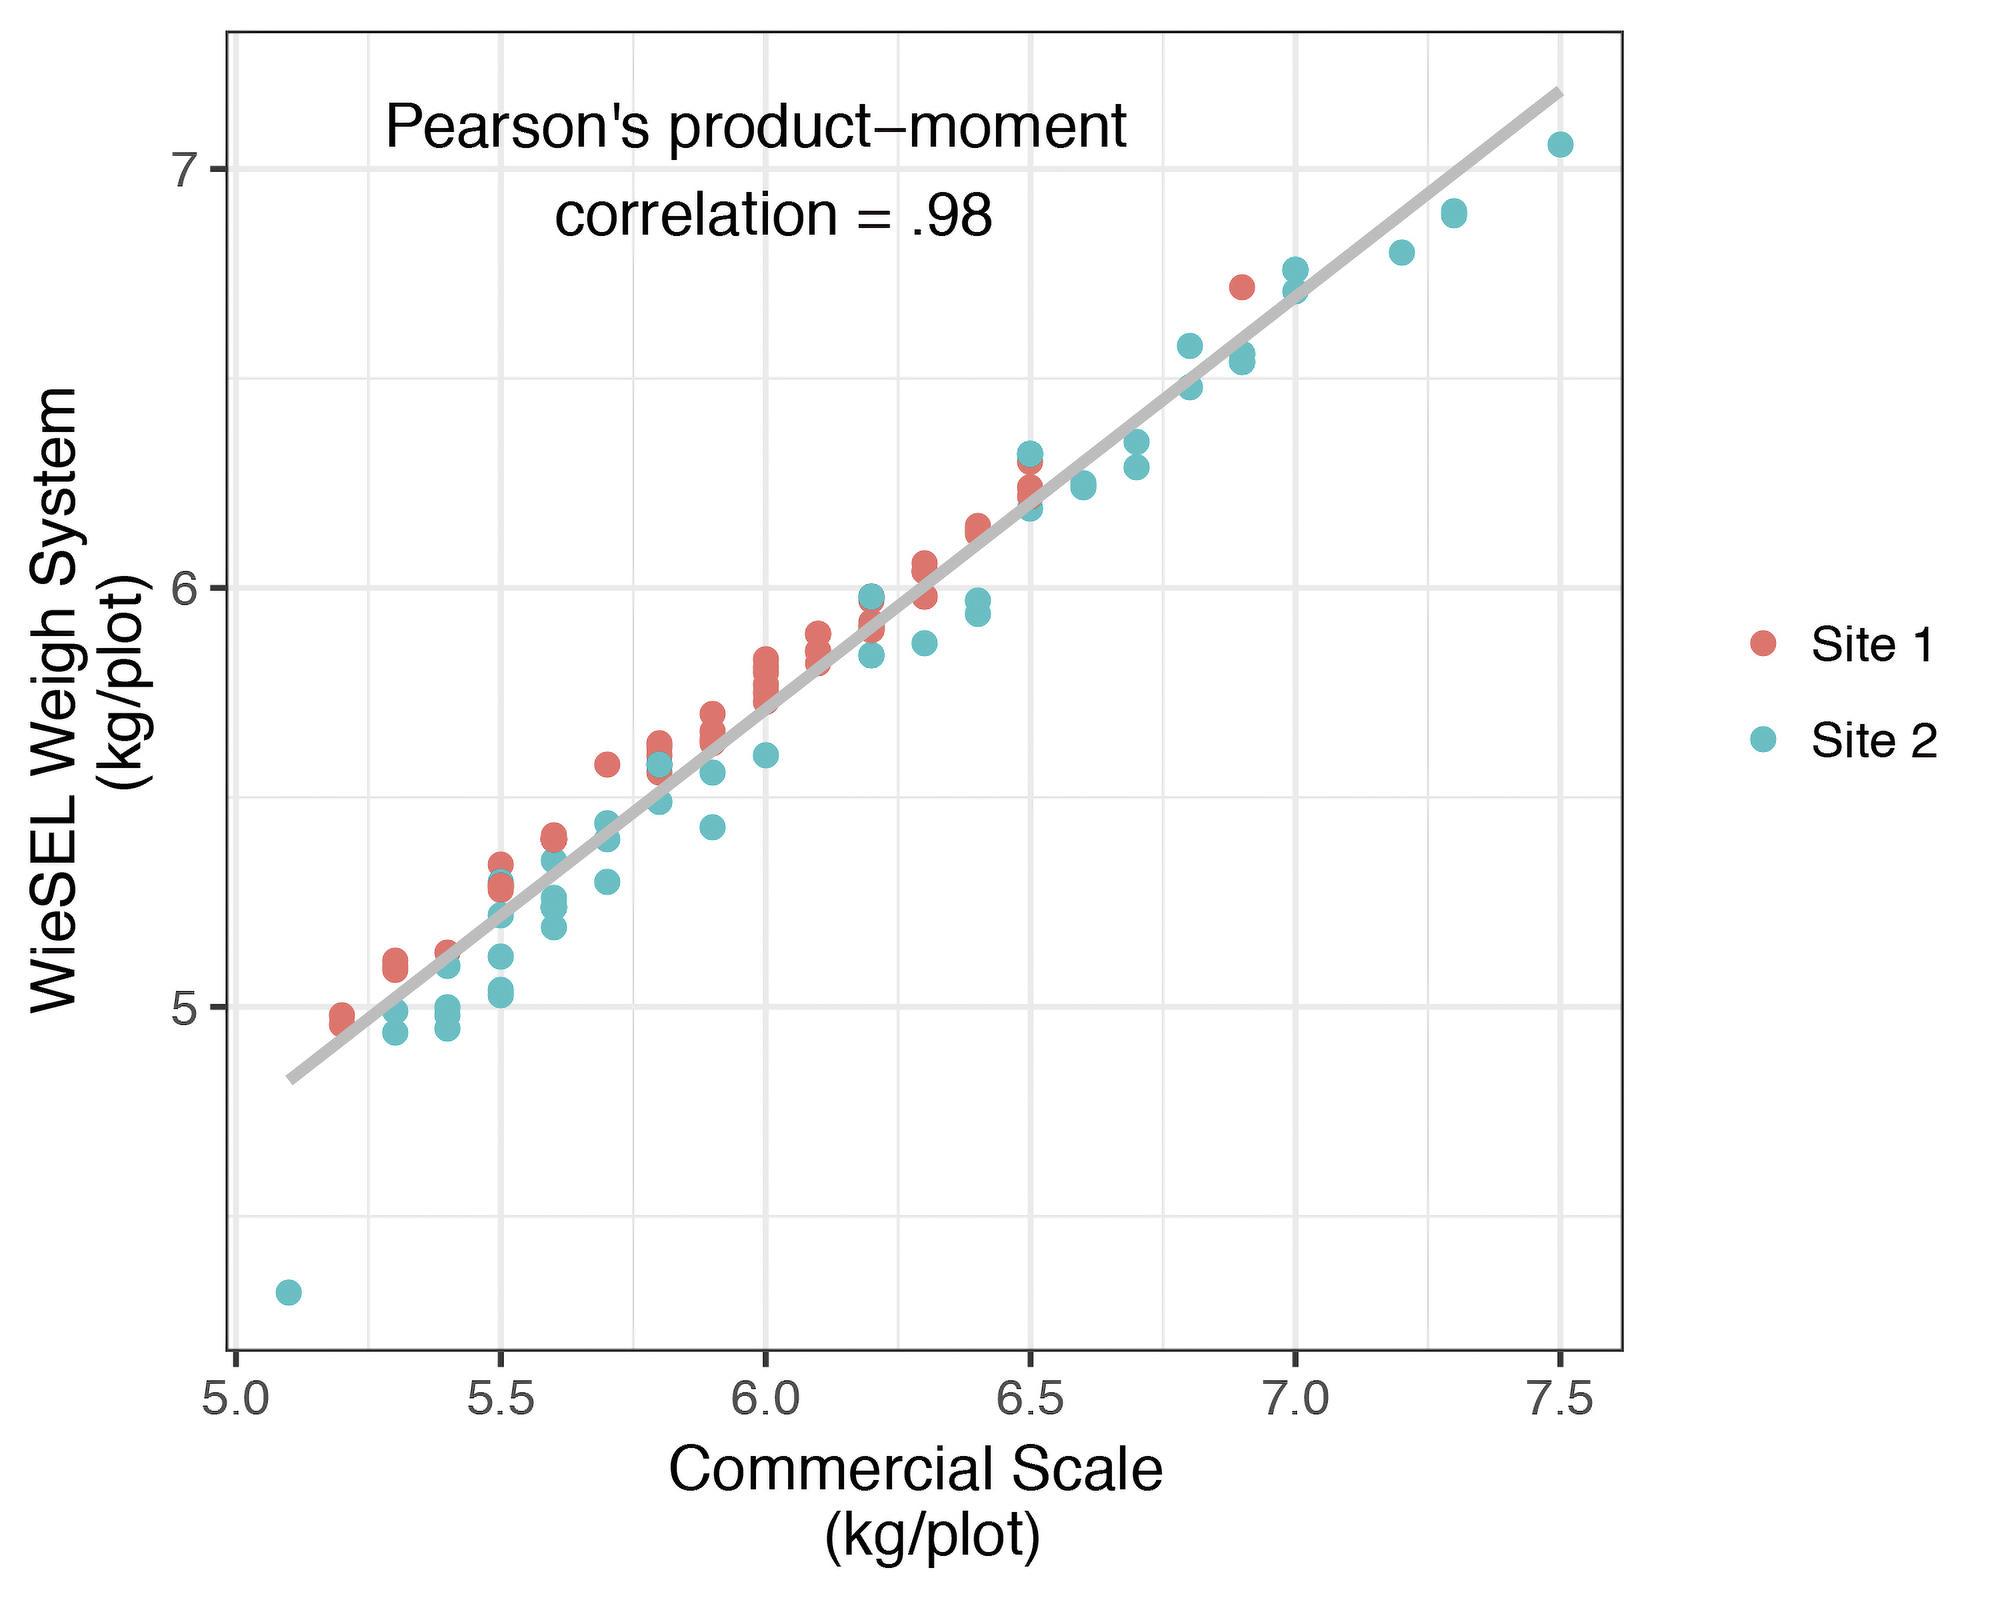
Correlation analysis indicated grain yield measured using the WieSEL weigh system was strongly associated with those measured manually (r=0.98). A scatter diagram shows all but one of the data points (an outlier from Site 2; 4.32, 5.10 kilograms per plot) fell close to the line of identity (Figure 3).
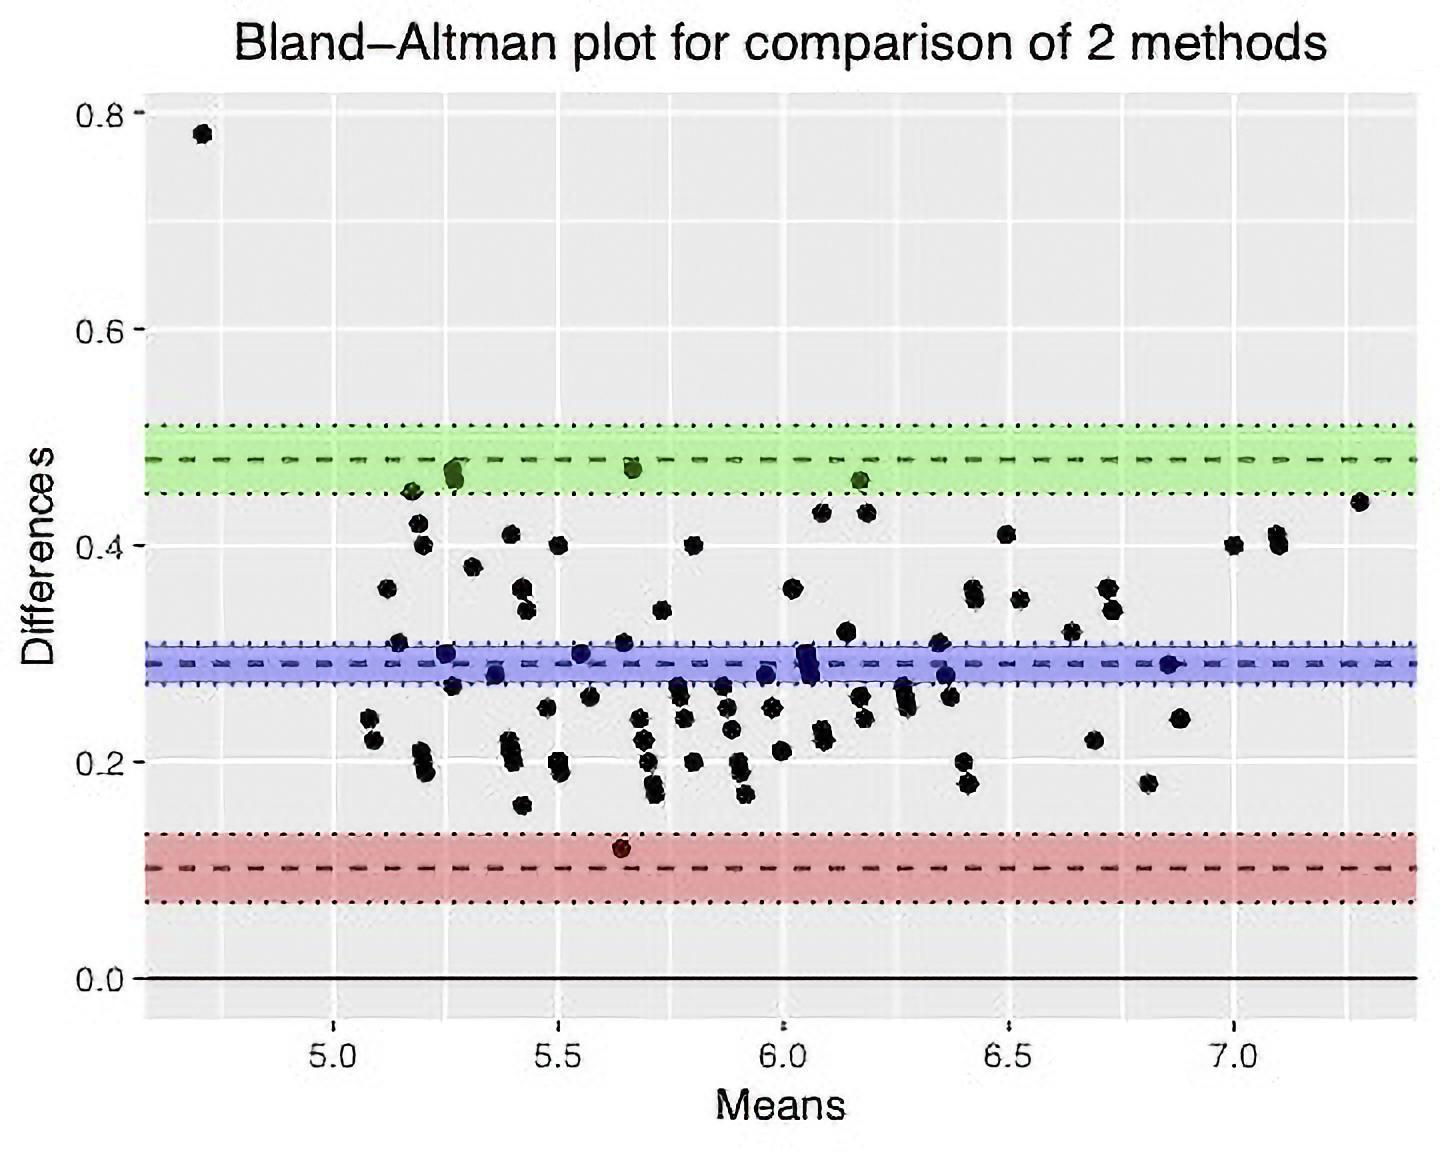
The Bland-Altman plot (Figure 4) shows the difference in grain yield of each plot between the WieSEL weigh system and the platform scale was negative and varied from -0.78 to -0.12, suggesting there was a systemic negative bias. Therefore, the WieSEL weigh system yielded a lower grain yield than that measured simultaneously with the platform scale. The dotted horizontal lines in Figure 4 represent the 95% confidence limits of agreement for the two measurements. As shown in Figure 4, only one of 107 (0.93%) data points exceeded the lower limit of agreement. The bias and standard deviation (SD) of the difference score as of this data set were -0.29 and 0.10. Moreover, the confidence limit was 0.38 kilogram per plot which is acceptable in agricultural field work. Results suggest there is good agreement between the WieSEL and the manual scale. As such, the WieSEL weigh system could satisfactorily replace the manual scale to measure grain yield in agricultural research plots integrated with a plot combine and will be particularly expedient for accurately comparing relative differences in yields among experimental treatments.
Conclusions
There was a strong relationship between grain yield determined by the onboard WeiSEL system and the platform scale. There are several advantages of the WieSEL weigh system, including:
- It was easy to operate.
- It was stable, repeatable and reliable.
- It measures grain yield in real-time.
- It provides a compact user terminal and modular function expansion, including potential add-on instrumentation for moisture and protein measurements (not evaluated in this study).
- It manages data with ease.
- It reduces labor requirements.
These characteristics allow this product to measure crop yields in the small-plot wheat harvest. We conclude that the WieSEL weigh system is a sufficient and low-cost alternative to more-expensive plot combine yield-monitoring systems with greater market share in North America. The scope of inference for this validation study is limited to winter wheat. But we expect the WieSEL system would work with other seed crops, including cereal grains, legumes and oilseed crops. Research equipment is notoriously expensive. Agricultural researchers interested in making a sizable investment in an integrated plot combine weigh system should contact the corresponding author of this publication for more information.
References
Altman, D.G. and J.M. Bland. 1983. Measurement in Medicine: the analysis of method comparison studies. The Statistician. 1983. 32: 307-317.
Andrade-Sanchez, P. and J.T. Heun. 2013. Yield Monitoring Technology for Irrigated Cotton and Grains in Arizona: Hardware and Software Selection. The University of Arizona Cooperative Extension. Bulletin AZ-1596.
Arslan S. and T.S. Colvin. 2002. An evaluation of the response of yield monitors and combines to varying yields. Precision Agriculture 3: 107-122.
Bachmaier, M., M. Rothmund and H. Auernhammer. 2008. An Attempt to Optimize Yield Maps by Comparing Yield Data from a Plot Combine and from a Combine Harvester. Agricutural Engineering International: CIGR Journal.
Bland J.M., D.G. Altman. 1986. Statistical methods for assessing agreement between two methods of clinical measurement. Lancet i: 307-310.
Datta, D. 2017. blandr: a Bland-Altman Method Comparison package for R. Zenodo.
Doğan N.Ö. 2018. Bland-Altman analysis: A paradigm to understand correlation and agreement. Turkish Journal of Emergency Medicine 18(4): 139-141.
Giavarina, D. 2015. Understanding Bland-Altman analysis. Biochemia Medica 25(2): 141-151
Kirk, K.R., Y.J. Han, W.M. Porter, W.S. Monfort, W.G. Henderson and J. Thomas. 2012. Development of a Yield Monitor for Peanut Research Plots. American Society of Agricultural and Biological Engineers.
Ranganathan P., C. Pramesh and R. Aggarwal. 2017. Common pitfalls in statistical analysis: Measures of agreement. Perspectives in Clinical Research 8: 187-191.
Wickham, H. Ggplot2: elegant graphics for data analysis. Springer-Verlag New York. ISBN 978-3-319-24277-4, 2016.
About the authors


Trade-name products and services are mentioned as illustrations only. This does not mean that the Oregon State University Extension Service either endorses these products and services or intends to discriminate against products and services not mentioned.