This report summarizes pest impact data for Oregon peppermint, gathered through Oregon State University’s Crop Pest Losses Impact Assessment program. The program facilitates the collection of real-world data on the impacts of insects, diseases, weeds and other pests on key crops in the Pacific Northwest — data which are vital yet lacking in most agricultural industries. We demonstrate the yield and economic impacts of specific pests and management practices for the 2018 crop season. The report is targeted at peppermint researchers, Extension workers, crop consultants and others who have an interest in crop losses, and in development and deployment of integrated pest management.
Background
This report presents data from Oregon State University’s Crop Pest Losses Impact Assessment program, a collaboration between Oregon State University’s Oregon IPM Center, the University of Arizona’s Arizona Pest Management Center, the Western IPM Center and industry partners. The program aims to provide a detailed measure of the economic impacts of insects, diseases, weeds and other pests to a crop production system.
Improving our understanding of crop-yield losses and the factors that contribute to them is critical to improving agricultural production and increasing food security. Quantitative data on pest impacts are limited, and estimating crop losses is challenging. However, quantifiable measurements of pest pressure, pesticide use, costs, and yield and quality losses due to pests are our most objective tools for assessing IPM status, and general progress in agriculture. These data are also valuable in supporting IPM evaluation and needs assessment, in priority-setting and education, and for informing federal decision-making, including the U.S. Environmental Protection Agency’s pesticide registration and review process. In particular, assessments of crop losses that occur despite all of the crop protection strategies that are deployed is critical for identification of research and Extension needs, and also for improving pest management decision-making.
We designed a detailed survey based on multidisciplinary expertise in our center, using methods perfected over decades of research in Arizona. This instrument aims to capture information from commodity group pest managers (generally crop consultants) on the impacts of pests, including yield losses and pest management costs, across a number of key Oregon commodities. In this case, the crop is Oregon peppermint. We hope that these data are used to inform pest-management decision-making and IPM advances, especially when collected regularly over time.
This report is for peppermint researchers, Extension workers, crop consultants and others who have an interest in crop losses, and in the development and deployment of IPM.
Oregon peppermint production statistics
In 2018, Oregon ranked second in peppermint oil production in the United States, accounting for 30% of the nation’s production. According to the Oregon Department of Agriculture, the statewide value of Oregon’s 2018 peppermint crop was over $34 million, with approximately 19,000 acres of peppermint under cultivation. In 2017, the top five peppermint oil-producing counties in Oregon were Union, Marion, Benton, Polk and Linn, by acreage harvested, according to the Department of Agriculture’s National Agricultural Statistics Service. Other mint-producing counties include Lane, Baker, Jefferson and Jackson. In 2018, an average of 85 pounds of Oregon peppermint oil was distilled per acre, with a value of $21 per pound. A total of 1.6 million pounds of peppermint oil distillate was produced by Oregon growers in 2018, the ODA reported.
Methods
Materials
The data in this report are based on a survey conducted in January 2019, with crop consultants reporting on 2018 mint production. Data were generated through an interactive, web-based survey modeled after the Arizona Cotton Insect Losses survey. The survey was developed using specialized software (Telerik) that allows for multiple levels of response validation. Surveys were conducted at an in-person group session where respondents entered information online via a weblink. Respondents used their own laptops to complete the survey, which took approximately two hours. Survey responses were automatically downloaded into a database, from which results were analyzed.
The survey is divided into multiple sections relating to both pests and pest management (Appendix 2). In the first section, respondents estimate the price received per pound of peppermint oil distillate, actual oil yields in pounds and maximum attainable yields (based on definitions of yield potential). This initial estimate provides a measure of overall yield loss (the difference between the reported actual yield vs. the maximum attainable yield). Respondents are then asked to attribute overall yield loss to various factors, both biotic and abiotic.
In subsequent parts of the survey, respondents refine these yield loss estimates for specific pests, along with pest-by-pest information on acreage where the pest was present. They also approximate costs of control. Finally, respondents estimate pesticide use by active ingredient (acreage, number of applications and costs), as well as the use and costs of nonchemical control methods. See Appendix 2 for a more detailed outline of survey questions.
Respondents
Nine peppermint crop consultants completed the survey in January 2019. All respondents were volunteers, recruited with the help of the Oregon Mint Commission and Oregon State University faculty. The respondents reported on a total of 4,576 peppermint acres across five mint-producing counties, representing 24% of the state’s 19,000 acres of peppermint under cultivation. The share of total survey acreage under an individual respondent’s management ranged from 3% to 19% of the 4,576 surveyed acres.
It is important to note that the counties represented in this survey represent the Willamette Valley region of the state: Linn, Benton, Lane, Polk and Marion counties. Mint-growing regions in Central and northeastern Oregon have different environmental conditions and pest pressures. A future goal of this project is to incorporate data from additional regions in order to better understand pest impacts in peppermint across the state.
Design
This is descriptive research that seeks to understand and quantitatively describe the impacts of pests and their management on peppermint production in Oregon. Each survey is intended to inform respondents, growers, researchers and industry professionals about current pest-management successes and needs. It is also intended to be part of a sequence of annual surveys that can reveal trends and responses to change over time.
Analysis
Respondent data were analyzed using specific formulas that allowed us to investigate the information gathered and derive output useful for crop management decision makers. The analytical formulae are detailed in Appendix 1. While we could perform many possible analyses on these data, we focused on those that would shed light on the impacts of pests and on the effectiveness and costs of management.
Results
I. Crop yield losses
Actual yield, maximum attainable yield and price
In the first part of the survey, respondents were asked to estimate the average price received per pound of peppermint oil distillate, and the average actual yield from their managed acreage. They were also asked to estimate the “maximum attainable yield” per acre by estimating the highest possible yield. This assumes ideal growing conditions and no pest pressure, within the general constraints of varieties grown, weather and local geography.
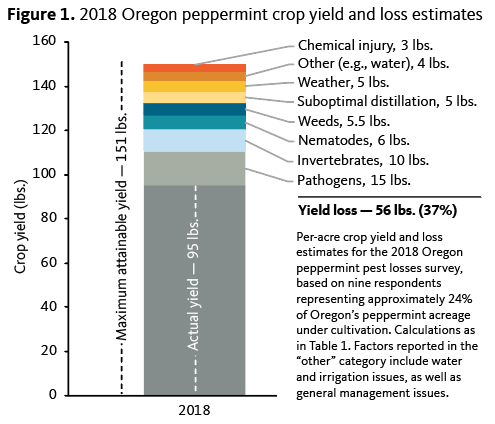
We multiplied the average maximum yield in pounds per acre (95.31 lb) by the average price received per pound ($23.33) to determine that the average surveyed acre had the potential to generate $2,224 per acre. There was a difference of 56 lb/acre in oil yield between the maximum attainable yield and the actual yield reported (Table 1, Figure 1).
| Mean | Standard deviation (+/-) | |
|---|---|---|
| Price ($ per pound) | 23 | 3.8 |
| Actual yield (lbs oil/acre) | 95 | 16.6 |
| Maximum attainable yield (lbs oil/acre) | 151 | 35 |
Average (+/- SD) price received per pound on peppermint oil distillate per acre, mean actual yield in pounds per acre, and mean maximum attainable yield in pounds per acre. Yield averages are weighted by respondent’s share of acreage surveyed (Equations 1 and 2, Appendix 1). Price data are not weighted (Equation 3, Appendix 1). Based on reported data from all nine respondents.
Overall yield loss
The difference between respondent estimates of actual yield and maximum attainable yield represents the overall yield loss experienced. The average rate of yield loss estimated across surveyed peppermint acres was 37% (Table 1, Figure 1).
Crop yield losses can be attributed to a combination of factors, including pest pressure, management issues and environmental conditions.
In the second part of the survey, respondents were asked to attribute their estimated overall yield loss to a list of biotic and abiotic yield-reduction factors, including damage from insects, diseases and weeds, as well as impacts from weather, oil distillation practices, irrigation and other management inefficiencies.
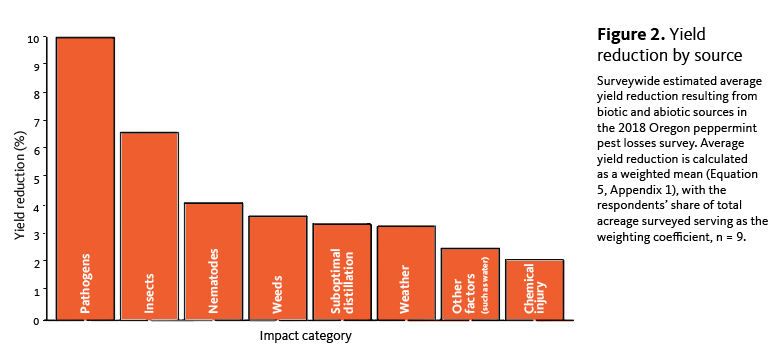
Biotic impacts were responsible for the largest reduction in Oregon peppermint crop yield on our surveyed acres, at almost 25% (Figure 2). Diseases caused by plant pathogens were the largest biotic contributor to yield loss, followed by invertebrate pests, nematodes and weeds. (Note: Nematodes were separated out from other invertebrate pests for the purposes of our survey.)
The largest abiotic contributor to yield loss was suboptimal oil distillation, leading to an estimated 3.4% reduction in yield, followed by weather, chemical injury and other factors such as irrigation (Figure 2). More than 10% of possible yield was reported lost to abiotic impacts.
Note: Not all survey respondents experience all possible pests, which leads to variation in “n” throughout some of the figures in this report. Averages for acreage where the pest was present include, for example, only the data for those respondents who reported specific pests, pesticides or management actions. Our averages across all survey acreage include all responses, including those with nothing to report for certain pests or management, whose response is assumed to be zero (in terms of yield losses and management costs).
Yield loss and economic value by pest species
Within the biotic yield loss categories of invertebrate pests, pathogens and weeds, respondents were asked to break down their estimates even further, by reporting average percent yield losses by pest species on acreage where the pest was present.
Of course, these yield losses are experienced by growers as economic losses. Using the average estimated price per pound reported by our survey respondents, we can assign a dollar value to the reported losses.
The following figures reveal the most economically damaging mint pests, overall and within each pest category (invertebrates, pathogens and weeds). Within an agricultural system, this type of data can highlight priority pest issues for targeted research and education. These data can also inform the regulatory system when decisions are made about the tools available for management.
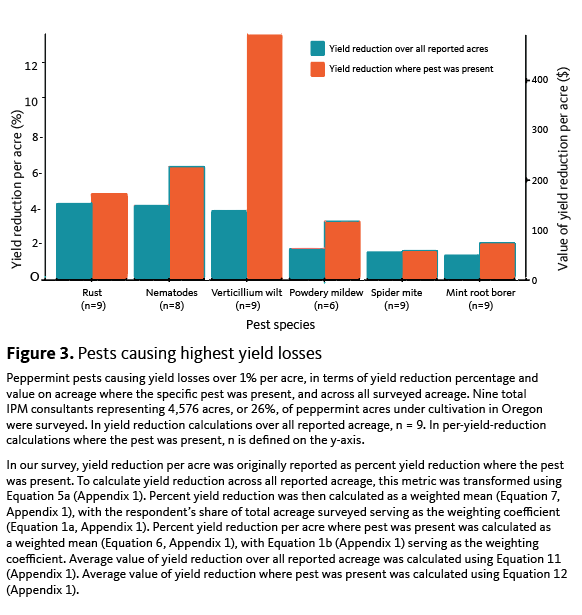
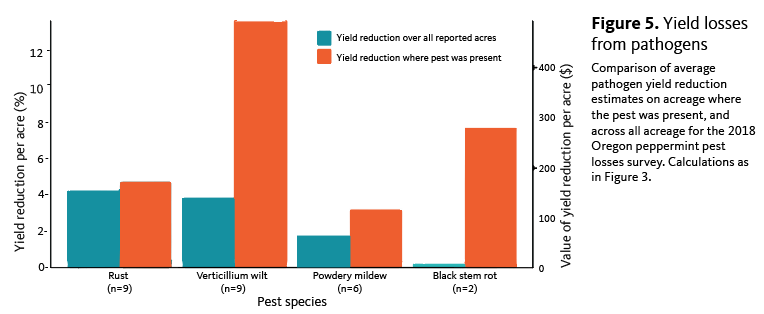
The pests causing the most damage across all surveyed acreage and on acreage where the pest was present included verticillium wilt, nematode species and rust (Figure 3). Where these particular pests occur, they can cause significant yield loss. The economic impact of any given pest may be lessened if it is not widespread, as we can see when calculating the impacts to all surveyed acres (including acreage where the pest was not present).
Single species assessments of yield reduction
We analyzed reported impacts to yield losses pest-by-pest, both on acreage where the pest was present and across all reported acres. As with the top pests above, these two scenarios differ based on the extent of infestation.
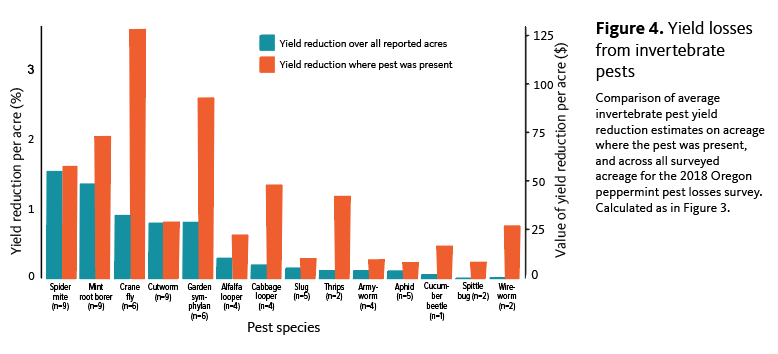
On acreage where the pest was present, crane fly, garden symphylan, mint root borer and spider mites were among the invertebrate pests causing the highest impacts to yield (Figure 4). When the extent of infestation across reported acreage is factored in, the impact of a given pest changes. Based on our data, spider mites, mint root borer and crane fly appear to have the greatest impact on yield loss across all surveyed acreage.
We see similar differences between the list of most damaging pests on acreage where the pest was present and over all reported acres when analyzing losses to pathogens and weeds. But it is clear that when a grower has verticillium wilt, black stem rot, powdery mildew or rust, they can expect to incur significant yield losses on the impacted acres (Figure 6).
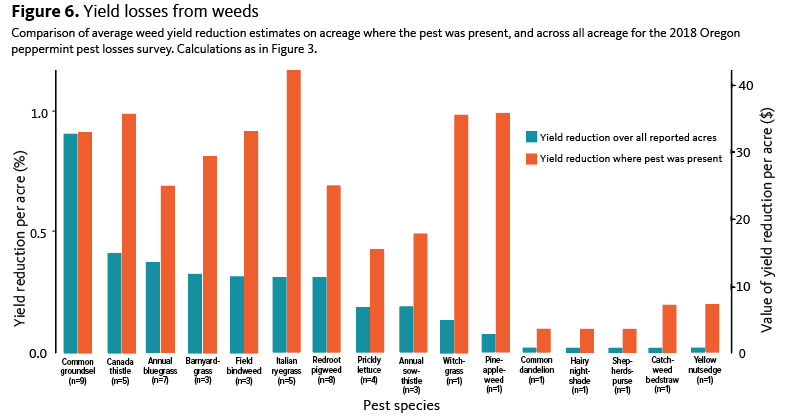
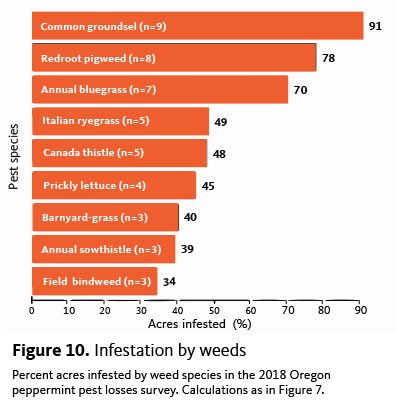
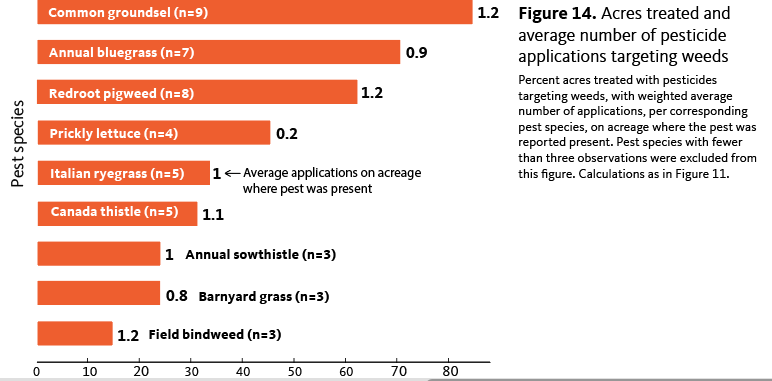
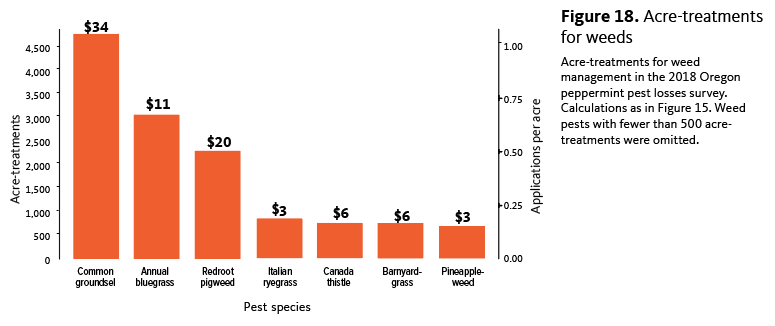
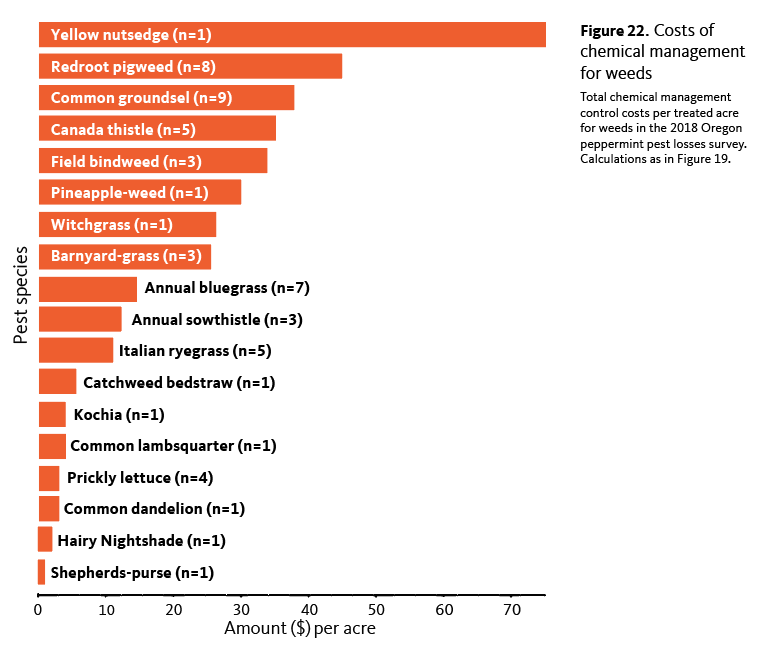
Specific yield losses caused by different weed species are more difficult to estimate. However, based on our data, common groundsel (Senecio vulgaris) is a key pest for the Oregon mint industry, because it was reported by every respondent, and results in the highest surveywide yield loss among all weed species (Figure 6). Additional problematic weed species for the Oregon peppermint industry include Canada thistle (Circium arvense), annual bluegrass (Poa annua) and barnyard grass (Echinochloa spp.), among others (Figure 6).
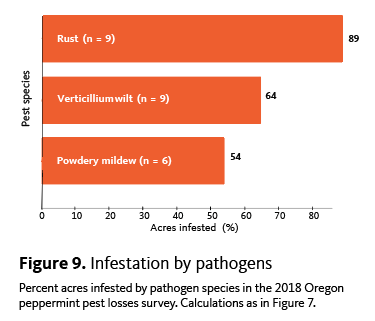
II. Percent of acreage infested and treated, by pest
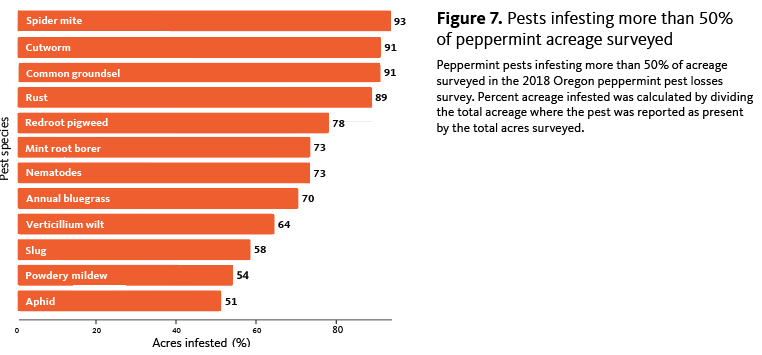
The potential for any given pest to have a significant impact across the industry depends on a combination of the yield loss it causes where it is present, and the level of infestation across the industry as a whole. The figures below present pests infesting over 50% of the peppermint acreage we surveyed, followed by figures showing infestation levels by all invertebrates, pathogens and weeds, respectively.
At least a dozen pests are infesting more than half of the peppermint acres we surveyed, many of which are causing significant losses in yield.
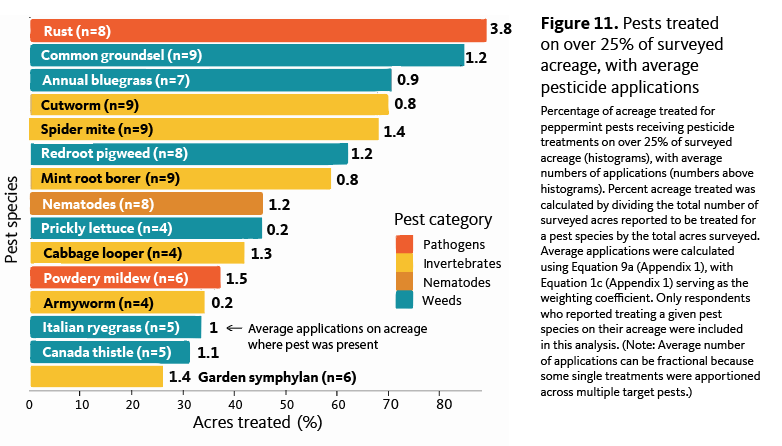
Acres treated and average number of pesticide applications on treated acres
The yield losses our respondents reported for the 2018–2019 field season were experienced in spite of the management applied to help mitigate losses and manage pests. For each pest species, respondents estimated the average number of pesticide treatments used to control the pest, as well as the average number of acres on which treatments were applied.
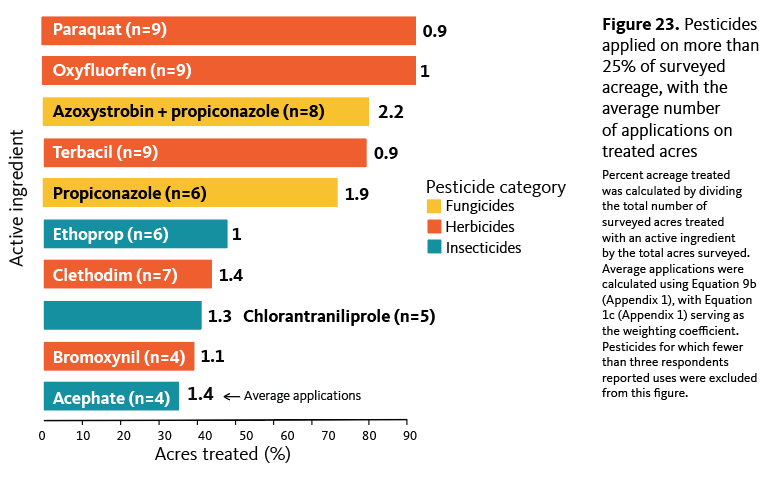
Figure 11 depicts pests requiring pesticide treatment on more than 25% of acreage. We also include the average number of pesticide applications applied on these acres. These two numbers taken together reveal the extent of management required for a given pest, which can be calculated as “acre treatments” (see Figures 15–18).
These data highlight the pests requiring higher levels of input and those which drive management programs. Producers need more targeted research and Extension support to improve management efforts to control these pests, protect crops and advance IPM.
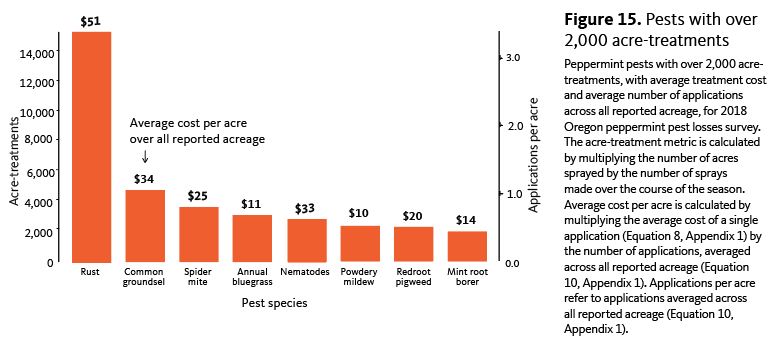
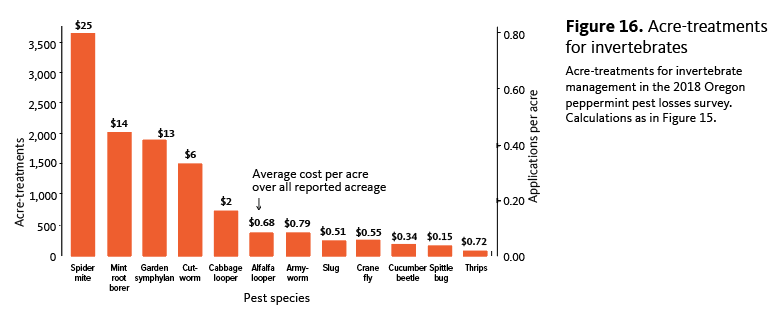
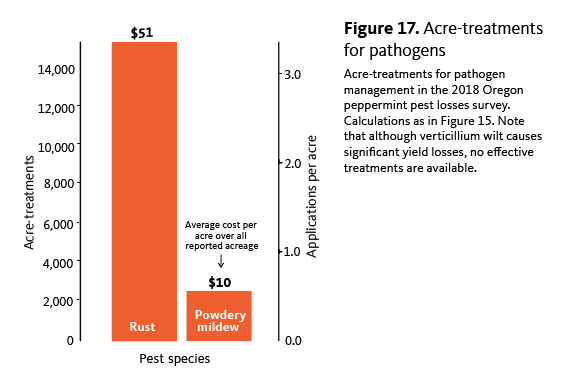
Acre-treatments per pest species
By multiplying the number of acres treated for a given pest by the average number of applications used to control it, we obtain the “acre-treatments” metric. This number represents the total number of acres receiving treatment for a given pest. The number of acre-treatments can exceed the number of acres surveyed when acres receive multiple applications (in this case either multiple products, or multiple applications of the same product).
This is another way to demonstrate the level of management required for various pests. The figures below reveal the peppermint pests requiring the greatest amounts of chemical management in terms of “acre-treatments,” along with the average cost of treatment per acre and the average number of applications, across all surveyed acres.
Estimating the number of pesticide applications
For each pest noted to be present or managed, survey respondents were asked to estimate the average number of pesticide applications used for control. Single pesticide applications are commonly intended to target multiple pests. In these cases, respondents were asked to apportion the single application to multiple pests based on the extent to which each pest was an intended target. For example, an insecticide might be used to target mainly cutworm (75% intended target), but also to manage armyworm (25% intended target). Thus, the average number of applications for any given pest might be less than one.
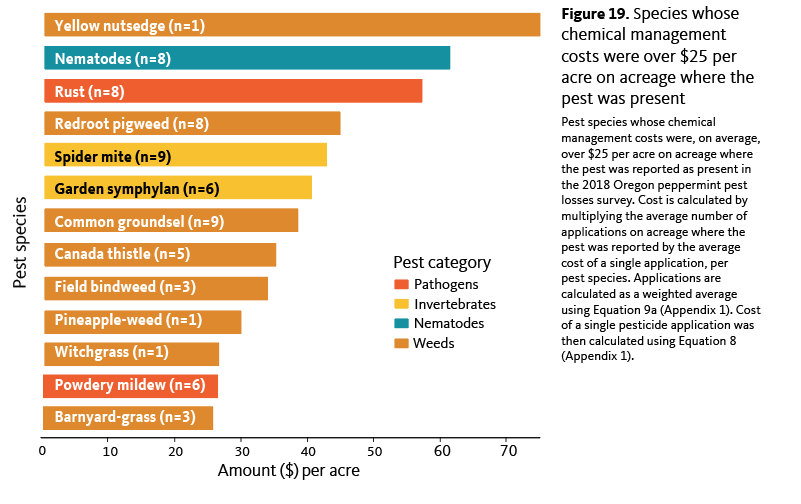
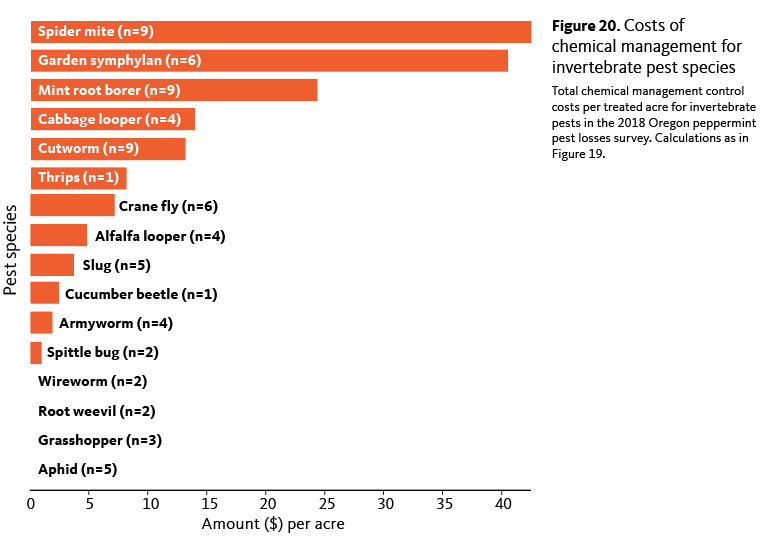
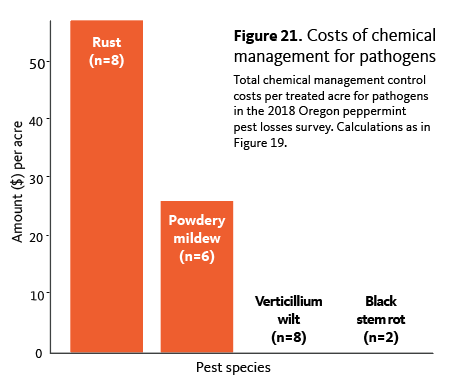
III. Costs of chemical control by pest species
For each pest species reported as present or managed on the acres that respondents oversaw, we determined the average number of pesticide applications made, along with the estimated average cost for one application (including application costs). The following figures depict the reported costs associated with management and represent the total cost over the growing season by pest. Note that some pests might have been reported as present on some acreage, with no chemical applications. These data were also included in the following analyses, with zero cost, in order to gain a more accurate measure of the costs associated with the presence of a given pest.
IV. Costs of other pest management activities
Respondents were also asked to estimate the cost of any additional pest management activities, beyond the use of pesticides. Respondents were asked to report the average cost per acre, as well as the average number of acres to which each practice was applied. The cost per treated acre reflects respondents’ reported cost on acreage where the treatment was applied. The cost per acre across all surveyed acreage metric averages the treated acre costs across all surveyed acreage. For example, monitoring with traps may have taken place on only half of the survey’s 4,576 acres, with an average cost of $5 per acre across those acres that were monitored. When averaged across the whole 4,576 acres, this represents a cost of $2.50 per acre. If a practice was applied across all surveyed acreage, the two numbers (cost per treated acre and cost per acre across all surveyed acreage) will be the same.
Respondents struggled with estimating costs for activities like sanitation, monitoring and forecasting, which may have resulted in underreporting of the costs of additional management. If we are to calculate the total cost of IPM, including nonchemical tactics and practices, we need to identify and factor in the additional costs of pest management. Field scouting, forecasting, sanitation and other practices all have associated costs. We are seeking to improve our understanding of these additional costs over time, as the survey methodology advances.
| Management action | Acres treated (%) | Cost per acre across all surveyed acreage ($) | Cost per acre on treated acreage ($) | N |
|---|---|---|---|---|
| Insect forecasting | 97 | 2 | 2 | 9 |
| Scouting | 97 | 26 | 26 | 9 |
| Selective pesticide use | 49 | 21 | 39 | 5 |
| Soil management | 45 | 9 | 16 | 5 |
| Field sanitation | 28 | 1 | 6 | 2 |
| Monitoring with traps | 16 | 1 | 2 | 3 |
Estimated costs of additional pest management activities, comparing the average cost per acre across all surveyed acreage with the average cost per acre on treated acreage estimates, for invertebrate pest control in the 2018 Oregon peppermint pest losses survey. The average cost per acre on treated acreage was calculated from the raw cost data. Average cost per acre across all surveyed acreage estimates were transformed using Equation 5c (Appendix 1) prior to calculating the average.
| Management action | Acres treated (%) | Cost per acre across all surveyed acreage ($) | Cost per acre on treated acreage ($) | N |
|---|---|---|---|---|
| Scouting | 93 | 23 | 23 | 9 |
| Nutrient management | 65 | 9 | 14 | 6 |
| Equipment sanitation | 35 | 0 | 0 | 3 |
| Crop rotation | 33 | 0 | 0 | 6 |
| Harvest timing | 32 | 1 | 2 | 3 |
| Soil management | 30 | 8 | 25 | 3 |
| Flaming | 29 | 4 | 11 | 3 |
| Disease forecasting | 26 | 0 | 0 | 3 |
| Double cutting | 23 | 0 | 1 | 4 |
| Irrigation practices | 22 | 3 | 13 | 2 |
| Site selection | 19 | 0 | 0 | 5 |
| Field sanitation | 4 | 3 | 15 | 2 |
Estimated costs of additional pest management activities, comparing the average per treated acre estimate with the average cost per acre estimates, for pathogen control in the 2018 Oregon peppermint pest losses survey. Calculations as in Table 2.
| Management action | Acres treated (%) | Cost per acre across all surveyed acreage ($) | Cost per acre on treated acreage ($) | N |
|---|---|---|---|---|
| Crop rotation | 39 | 0 | 0 | 5 |
| Site selection | 38 | 1 | 2 | 5 |
| Flaming | 23 | 4 | 11 | 3 |
| Hand weeding | 9 | 12 | 37 | 3 |
| Disking | 4 | 2 | 10 | 2 |
| Hoeing | 2 | 13 | 57 | 2 |
Estimated costs of additional pest management activities, comparing the average per treated acre estimate with the average cost per acre estimates, for weed control in the 2018 Oregon peppermint pest losses survey. Calculations as in Table 2.
V. Pesticide use
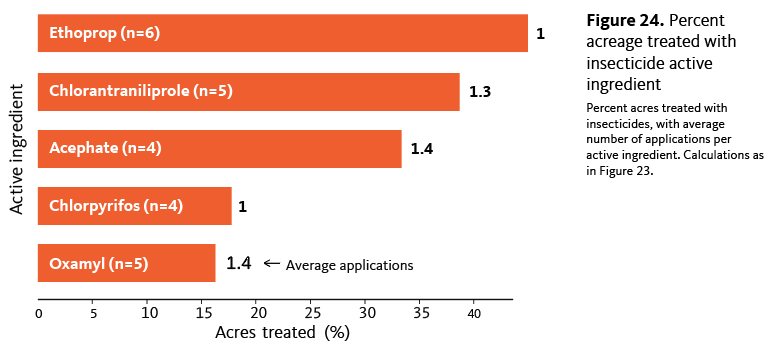
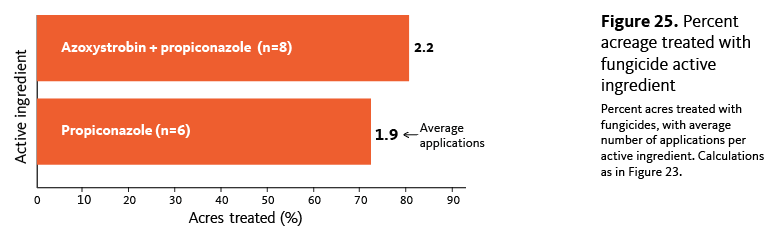
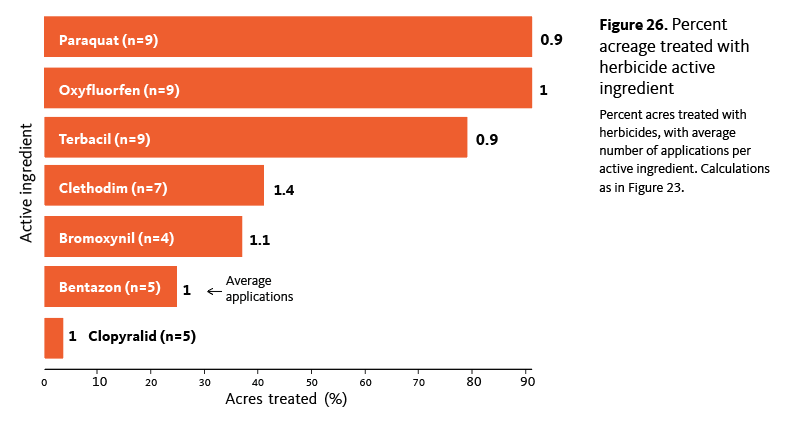
In addition to collecting data by pest species, we asked respondents to provide details of each specific pesticide active ingredient they used. The figures in this section summarize the reported use of pesticides in terms of percent acres treated and average number of applications for each active ingredient.
The first figure reports the pesticides used on over 25% of surveyed acreage, along with the average number of times each active ingredient was applied. The figures that follow report these data for insecticides, fungicides and herbicides, respectively.
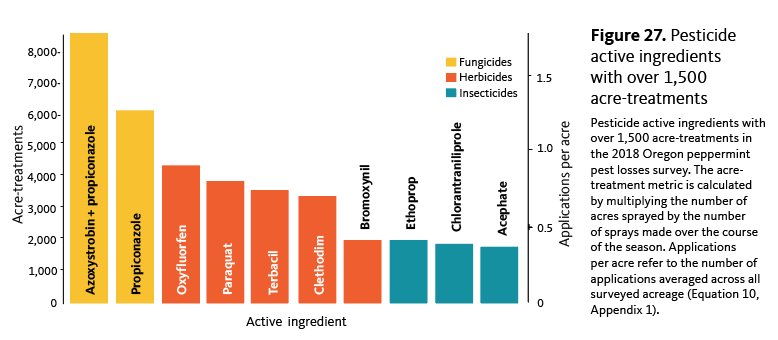
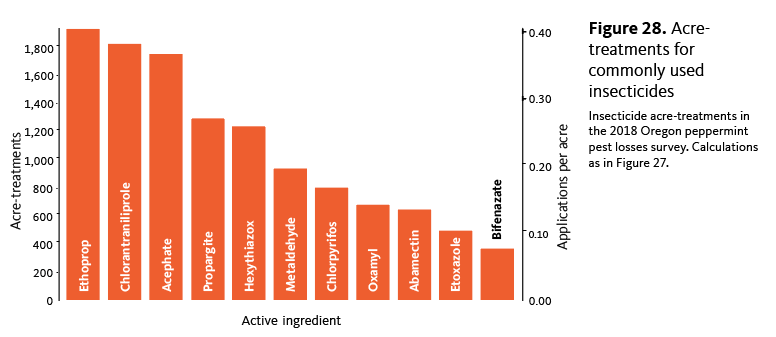
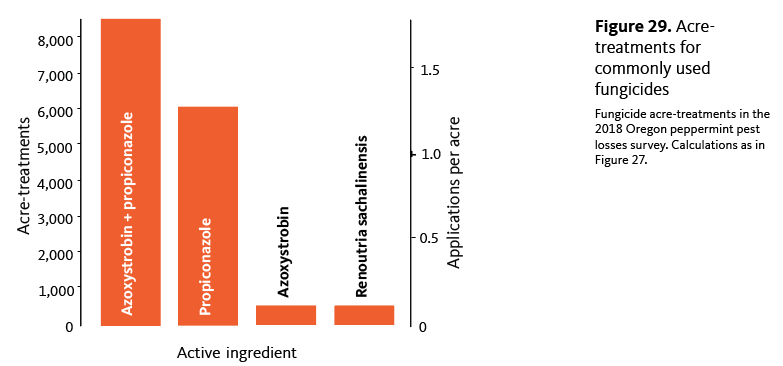
Pesticide acre-treatments
The number of acres treated with a given active ingredient multiplied by the average number of applications again reveals “acre-treatment” estimates. (See “acre-treatments per pest species” for a reminder of this metric.) This reveals the extent of pesticide use required and provides critical information for researchers and educators, particularly those tracking issues such as pest resistance, natural enemy protection and pesticide efficacy. This also serves as a baseline for tracking the way practices change over time. As a reminder, the acre-treatment metric is based only on our surveyed acreage (4,576 acres), and only those acres reported to have been treated with any given pesticide. (See previous section for percent acres treated and average number of applications, the metrics used for the following calculations.)
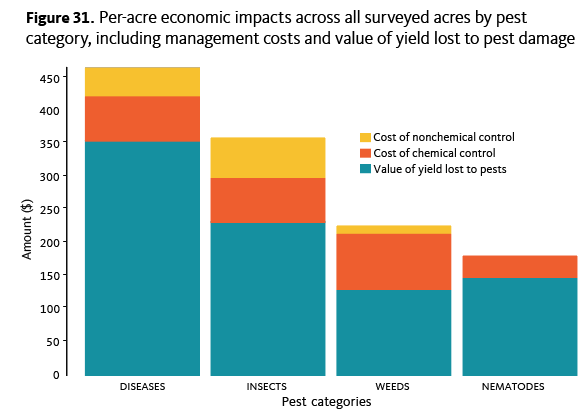
VI. Overall economic impacts
To get an idea of the overall economic impacts of yield loss and pest management across the entire survey area, we calculated a per-acre average of all pest management costs (chemical as well as additional or “nonchemical” costs), as well as the value of the total yield losses reported, which occurred despite the management methods employed. As previously mentioned, the nonchemical costs are an area for improvement in our survey process.
Economic return
In Section 1, we used respondents’ average actual oil yield estimates (in pounds) and average oil price estimates to determine that the average surveyed acre of Oregon peppermint has the potential to generate $2,224 per acre (Table 1). Using cost and application estimates, we then determined the cost of management to be $1,159 per treated acre (Table 6). This leaves an average of $1,065 per acre after pest management costs, although a number of additional farming and business costs are not covered by this analysis.
| Pest category | Chemical control costs ($/ac) | Nonchemical control costs ($/ac) | Total control costs ($/ac) |
|---|---|---|---|
| Diseases | 96 | 123 | 219 |
| Weeds | 379 | 181 | 560 |
| Insects | 190 | 107 | 297 |
| Nematodes | 83 | -- | 83 |
| Total | 748 | 411 | 1,159 |
Cost of chemical control was calculated first by transforming each respondent’s application estimate using Equation 5b (Appendix 1). Weighted average applications per pest species were then calculated using Equation 10 (Appendix 1). Average pesticide cost per treated acre per pest species was calculated using Equation 8 (Appendix 1). These two values were then multiplied, per pest species, then summed per pest category. Nonchemical control method averages were calculated by transforming the per-acre application cost estimates, per respondent (Equation 5b, Appendix 1), then averaging the transformed estimates per pest species, and finally summing each average nonchemical cost per pest category. To calculate the value of yield lost to pests, the respondents’ yield loss per acre estimate was first transformed using Equation 5a (Appendix 1). The transformed yield loss estimate was then used in the weighted average value of single species yield reduction calculation (Equation 11, Appendix 1) for each species in a given pest category per acre. These estimates are then summed per pest category.
Discussion
Detailed information regarding the economic impacts of pests and their management is critical to understanding ways to improve pest management and advance IPM. The large difference between the estimated maximum attainable yield and the actual reported yield in this survey is an indicator that there is much scope for increasing pest management efficiency. Around 25% of overall yield losses were attributed to the impacts of pests — despite over $350 per acre spent on management. The numbers show that the need for identifying effective, economical and sustainable pest management strategies is clear and urgent.
Respondents report pathogens as having the largest overall negative impact on peppermint oil yield, at around 10% of yield lost per acre. Invertebrates closely follow with an estimated 7% yield loss per acre, and weeds and nematode species are reported to negatively impact yield loss at 4%, respectively. Surveywide, we can see that rust, verticillium wilt and nematode species contribute the most to yield loss, at around 4% each.
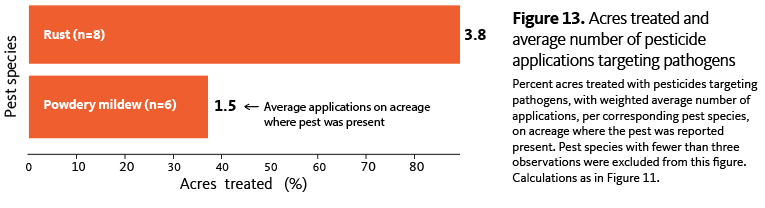
Rust emerges as a key pest species based on our survey data. It was reported on 89% of surveyed acreage and required more pesticide applications than any other pest, at an average of 3.8 applications per acre on acreage where it was present. It was also the second-most expensive pest to treat behind nematode species, with an overall per-acre average cost of $51/acre over the course of the season.
Verticillium wilt is also a key pest species based on our survey, occurring on 64% of surveyed acreage, and responsible for approximately 14% of yield loss on acreage where it occurred. This species is especially problematic because there are no methods for chemical control.
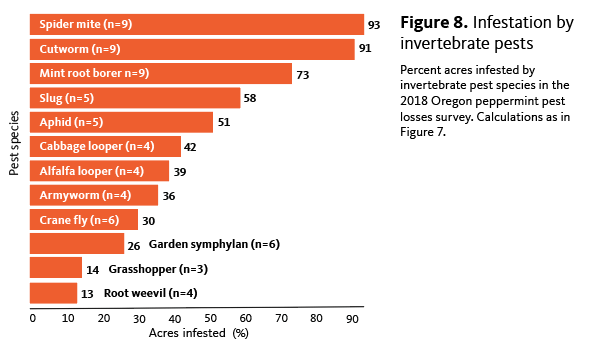
Spider mites were the most geographically widespread species in our survey, occurring on 93% of surveyed acreage. Spider mites were reported to have the largest negative impact on yield loss among all invertebrate pests, at around 2%. In addition, spider mites received the most acre-treatments (around 3,600) of all invertebrate species, costing, on average, $25/acre to control over the course of the season over all surveyed acreage.
Though crane fly and garden symphylan were limited in their distribution among respondents (30% and 26% of survey acreage infested, respectively), they were among the most devastating invertebrate pests in the survey where they were present (~3.5% and ~2.5% yield loss, respectively).
Common groundsel (Senecio vulgaris) was the key weed pest in our survey, occurring on 91% of surveyed acreage, and responsible for the greatest negative impact to crop yield among the various weed species, at ~ 0.9% lost per acre, across all surveyed acreage. It was the second-most expensive pest species to control in our survey at $34/acre overall, requiring, on average, 1.2 herbicide applications per season on acreage where it occurred.
Some pests, such as crane fly and symphylan, cause considerable devastation on acreage where they are present, but have a limited distribution. Others, such as spider mites and certain weeds, might be less damaging where they occur but more widespread in their presence. Some, such as rust, can be both widespread and damaging. Understanding these patterns in more detail for the main economic pests of a given crop is critical if we are to respond effectively and also consider the risks that growers take when fine tuning their IPM approaches.
One important constraint with these data is that although our survey covered 24% of Oregon’s peppermint acreage for the 2018 growing season, our respondent pool was primarily made up of growers in the Willamette Valley. Pest pressures and management options differ by region, and a broader respondent pool will more accurately capture these differences across the state.
As noted earlier, our low level of confidence in the reported costs associated with nonchemical IPM practices is a result of the challenge of effectively estimating these costs. This is an important area for future improvement. IPM includes a full suite of nonchemical activities. Better accounting for the costs — as well as the value — of these activities to growers will further inform the system and advance IPM.
Finally, although our survey attempts to measure yield loss, it does not specifically account for impacts to quality, which can also result in economic losses. Pest issues such as high weed pressure can impact oil quality at harvest, and lead buyers to reject certain lots or offer reduced prices for lesser quality oil. This is another area where the survey could be improved to capture the full range of pest impacts.
The data on pest losses and management we have presented here provide detailed, valuable and previously missing information regarding IPM in mint. If we gather this data regularly, we can track changes in pest pressure and management over time, we can prepare for emerging problem pests, and we can identify the specific areas where pest management resources are best targeted. Collected over time, these data provide economic metrics for IPM that should be of direct value to growers, decision makers and research and Extension efforts.
References
- Cerda R., J. Avelino, C. Gary, P. Tixier, E. Lechevallier, and C. Allinne. (2017) Primary and Secondary Yield Losses Caused by Pests and Diseases: Assessment and Modeling in Coffee. PLoS ONE 12(1): e0169133.
- Ellsworth, P.C., A. Fournier and W. Dixon. 2007 (rev. 1/2020). Arizona Cotton Insect Losses. Publ. No. AZ1183. University of Arizona, College of Agriculture and Life Sciences, Cooperative Extension, Tucson, Arizona. Updated data available upon request.
- Ellsworth, P.C., A. J. Fournier, J.C. Palumbo, S.E. Naranjo and G.B. Frisvold. (2016). Chronicling Successful Integration of Technology and Knowledge Over 25 Years of IPM in Arizona. Economics of IPM in the 21st Century: Multiple Perspectives from Around the World. International Congress of Entomology ICE 2016, Orlando, Florida. Sept. 26, 2016.
- Lobell, D.B., K.G. Cassman, and C.B. Field, (2009). Crop Yield Gaps: Their Importance, Magnitudes, and Causes. Annual Review of Environment and Resources 2009 34:1, 179-204.
- Oregon Department of Agriculture, Oregon Agricultural Statistics & Directory 2020.
- Palumbo, J.C. (2019). Insect Losses and Management on Desert Lettuce: A 15-Year Summary. University of Arizona Vegetable IPM Update, Vol. 10, No. 13, June 2019.
- Popp, J., and K. Hantos (2011). The impact of crop protection on agricultural production. Studies in Agricultural Economics, No. 113, p. 47-66.
- USDA National Agricultural Statistics Service (2017). NASS Quick Stats (2020), Accessed Dec. 10, 2020.
Appendix 2: Survey question outline
General yield and losses information
- Respondent crop yield and pricing general information
- Acres managed
- Actual yield per acre
- Maximum attainable yield per acre
- Price received per pound
- General factors impacting crop yield
- Overall percent loss due to weather damage
- Overall percent loss due to chemical injury
- Overall percent loss due to insect species
- Overall percent loss due to pathogens
- Overall percent loss due to weeds
- Overall percent loss due to nematodes
- Overall percent loss due to distillation method/process
- Overall percent loss due to “other pests” [indicate]
- Overall percent loss due to “other factors” [indicate]
Type of production
- Percent acres managed that are certified organic
- Percent acres managed that are transitional
- Percent acres managed that are conventional
Fumigation
- General fumigation information
- Number of acres fumigated
- Cost per acre for fumigation
- Fumigation target pests
- Additional fumigation targets
- Information on specific fumigation targets
- Fumigation target (select from list of pest species)
- Percent intended target of fumigation
- Specific product(s) used
Pesticide application data
- Air
- Percent acres treated by air
- Average applications by air
- Average cost ($) per acre for a single aerial application (excluding application cost)
- Ground
- Percent acres treated by ground
- Average applications by ground
- Average cost ($) per acre for a single ground application (excluding application cost)
- Chemigation
- Percent acres treated by chemigation
- Average applications by chemigation
- Average cost ($) per acre for a single chemigation application (excluding application cost)
Pest losses due to specific insect pests
- Pest selection page
- Losses page
- Number of acres where pest was present
- Number of acres treated for pest
- Average percent yield loss due to pest on infested acres
- Number of applications used for pest
- Average cost of single application (including application cost)
Pest losses due to specific pathogens
- Pest selection page
- Losses page
- Number of acres where pest was present
- Number of acres treated for pest
- Average percent yield loss due to pest on infested acres
- Number of applications used for pest
- Average cost of single application (including application cost)
Pest losses due to specific weeds
- Pest selection page
- Losses page
- Number of acres where pest was present
- Number of acres treated for pest
- Average percent yield loss due to pest on infested acres
- Number of applications used for pest
- Average cost of single application (including application cost)
Insecticide application data
- Insecticide selection page
- Product use data page
- Number of acres treated per insecticide
- Average N=number of applications per insecticide
- Cost of product per acre
- Target pest
- Average rate of application (low, medium, max)
- Timing of application (early, midseason, late or a combination)
- Application method (ground, air, chemigation)
- Historic use of product
Fungicide application data
- Fungicide selection page
- Product use data page
- Number of acres treated per fungicide
- Average number of applications per fungicide
- Cost of product per acre
- Target pest
- Average rate of application (low, medium, max)
- Timing of application (early, midseason, late or a combination)
- Application method (ground, air, chemigation)
- Historic use of product
Herbicide application data
- Herbicide selection page
- Product use data page
- Number of acres treated per herbicide
- Average number of applications per herbicide
- Cost of product per acre
- Target pest
- Average rate of application (low, medium, max)
- Timing of application (early, midseason, late or a combination)
- Application method (ground, air, chemigation)
- Historic use of product
Nonchemical insect control practices
- Management action selection page
- Management action data page
- Number of acres where practice was utilized
- Estimated cost per acre
- Target insect
Nonchemical pathogen control practices
- Management action selection page
- Management action data page
- Number of acres where practice was utilized
- Estimated cost per acre
- Target insect
Nonchemical weed control practices
- Management action selection page
- Management action data page
- Number of acres where practice was utilized
- Estimated cost per acre
- Target insect
Appendix 3: Pest names
- Pathogens
- Black stem rot, Phoma strasseri
- Powdery mildew, Golovinomyces biocellatus
- Rust, Puccinia menthae
- Verticillium wilt, Verticillium dahliae
- Invertebrates
- Alfalfa looper, Autographa californica
- Aphid, Ovatus crataegarius
- Armyworm, Mamestra configurata
- Cabbage looper, Trichoplusia ni
- Cranefly, Tipula paludosa
- Cutworm, Heliothis phloxiphaga
- Garden symphylan, Scutigerella immaculata
- Grasshopper, Camnula pellucida
- Mint root borer, Fumibotys fumalis
- Cucumber beetle, Diabrotica undecimpunctata
- Spittle bug, Philaenus spumarius
- Redbacked cutworm, Euxoa ochrogaster
- Root weevil, Otiorhynchus spp.
- Gray field slug, Derocerus reticulatum
- Spider mite, Tetranychus urticae
- Thrips, Frankliniella spp.
- Wireworm, Limonius spp.
- Nematodes
- Nematodes, Root-lesion, Pratylenchus penetrans
- Nematodes, Root-knot, Meloidogyne hapla
- Weeds
- Annual bluegrass, Poa annua
- Annual sowthistle, Sonchus oleraceus
- Barnyardgrass, Echinochloa ssp.
- Canada thistle, Cirsium arvense
- Catchweed bedstraw, Galium aparine
- Common dandelion, Taraxacum officinale
- Common groundsel, Senecio vulgaris
- Common lambsquarters, Chenopodium album
- Field bindweed, Convolvulus arvensis
- Hairy nightshade, Solanum sarrachoides
- Italian ryegrass, Festuca perennis
- Kochia, Bassia scoparia
- Pineappleweed, Matricaria discoidea
- Prickly lettuce, Lactuca serriola
- Redroot pigweed, Amaranthus retroflexus
- Shepherdspurse, Capsella bursa-pastoris
- Witchgrass, Panicum capillare
- Yellow nutsedge, Cyperus esculentus
Use pesticides safely!
- Wear protective clothing and safety devices as recommended on the label. Bathe or shower after each use.
- Read the pesticide label—even if you’ve used the pesticide before. Follow closely the instructions on the label (and any other directions you have).
- Be cautious when you apply pesticides. Know your legal responsibility as a pesticide applicator. You may be liable for injury or damage resulting from pesticide use.
About the authors