Introduction
Surveys and maps are interrelated tools that help land managers understand property resources and make management decisions. In this publication, we describe surveying with an emphasis on the Public Land Survey System, which serves as the basis for describing property boundaries in the Pacific Northwest. We also discuss the various types of maps used in woodland management and the technology used to collect and analyze geographic data.
Survey types and uses
Land surveying is the process of gathering and analyzing information about the physical earth. It’s the science of determining relative positions of existing points on the earth’s surface or of establishing such points. People conduct surveys when they want to locate property boundaries, roads, structures, watercourses and other physical characteristics of the land. This work is carried out by licensed surveyors using specialized equipment and techniques. Surveyors are most commonly employed by landowners to mark or remark property boundaries, easements and other legally deeded features. Surveyors can also provide other services, such as flood mapping and new road layout. When surveyors work with property boundaries and other features described in your deed, they always work within the framework of the Public Land Survey System.
The Public Land Survey System
Most of the United States (outside the 13 original colonies, Kentucky, Tennessee and Texas) was surveyed using the Public Land Survey System. Survey work in the Pacific Northwest almost always references the PLSS, a rectangular survey system of public lands into townships of 36 square miles. The PLSS was first implemented in 1785 and became the standard for land patents and titles. It was implemented throughout the West as public lands were transferred to private ownership. Today, the Bureau of Land Management maintains records of land status, cadastral surveys (the process of creating, defining, marking and reestablishing the boundaries and subdivisions of public lands) and mining claims for Oregon, Washington and Idaho. When land leaves federal ownership, subsequent private title transfers, rights and restrictions are recorded by the appropriate county assessor’s office.
How the Public Land Survey System works
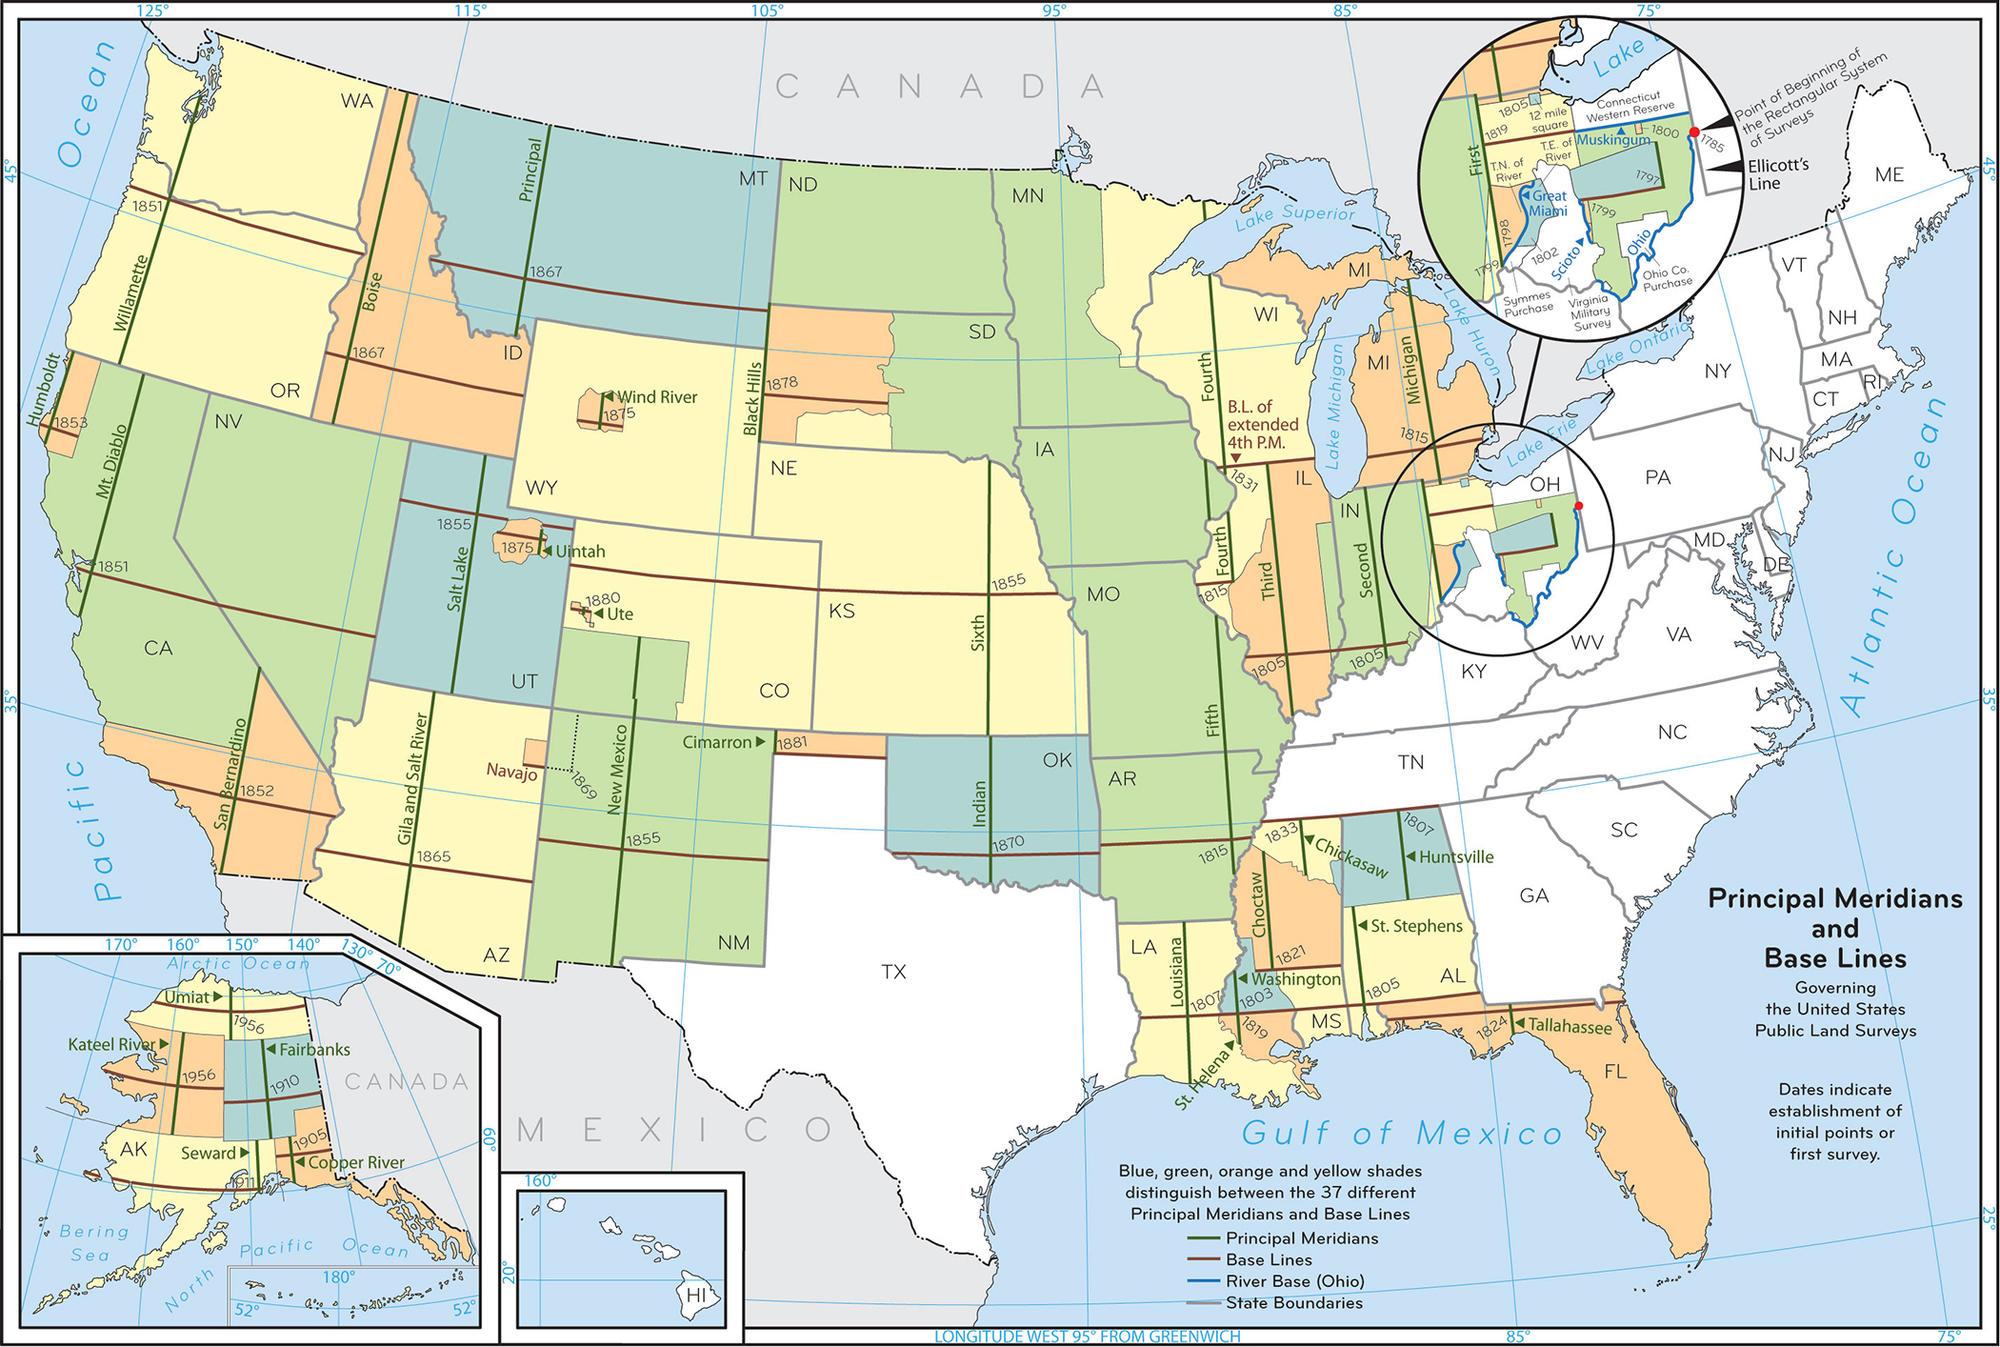
The PLSS uses a grid of approximately 1-mile-square sections (1 mile on a side). This rectangular survey system was built on a series of 37 points located throughout the United States. These points were precisely located through astronomical observations, and they never change. These 37 points serve as reference points for surveys anywhere in the areas of the continental United States covered by the PLSS (Figure 1). From each initial point, principal meridians run north and south, and baselines run east and west, creating the framework for the PLSS grid.
In Oregon and Washington, the rectangular survey system is referenced to the north-south Willamette Meridian and the east-west Willamette Baseline. These two lines cross at an initial point called the Willamette Stone, located in the west hills of Portland. In Idaho, the system is referenced to the Boise Meridian and Baseline, the initial point of which is in Meridian, Idaho.
From each initial point, a grid of townships is established north and south of the baseline and east and west of the principal meridian. Townships are approximately 6 miles on each side. They are numbered from the baseline, starting with Township 1 North (T1N) north to the Canadian border and Township 1 South (T1S) south to the California and Nevada state lines.
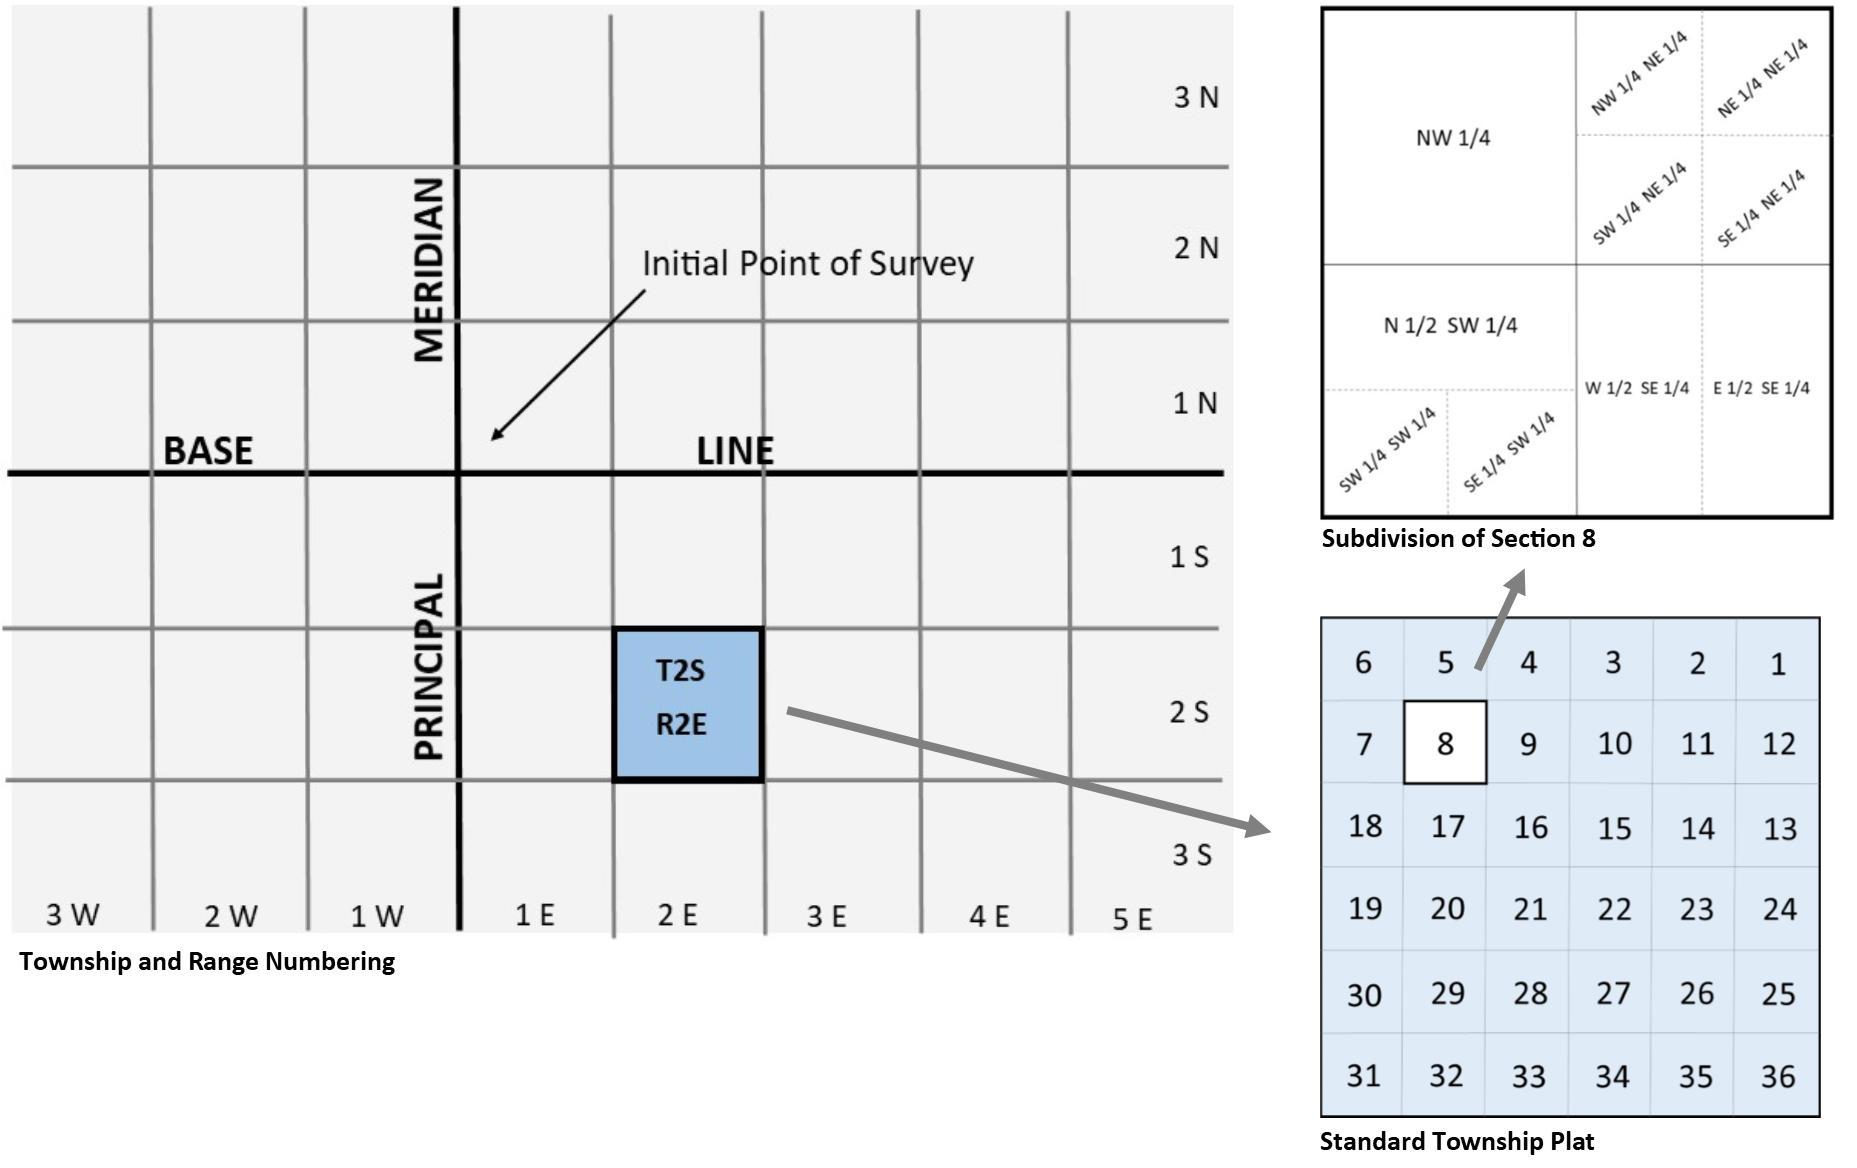
The east-west positions of a township are designated by its range. Ranges are numbered from the meridian west (for example, R1W) and east (for example, R1E). Thus, a township that is two grid locations south of the baseline and two grid locations east of the principal meridian would be designated as T2S, R2E (Figure 2).
Normal townships contain 36 sections. Each section is approximately 1-mile square and contains 640 acres. All townships use the same system for numbering the sections within them. Sections are numbered beginning with number 1 in the northeast corner, going west to number 6, then south to 7, east to 12, south to 13, and so on (Figure 2).
Every section has four quarter corners, which usually are the midpoint on each of the lines forming the boundaries of the section. Sections can be divided into quarters and halves by connecting these points. With a line drawn north-south or east-west through the center of a section to connect two quarter corners, the section is divided into halves. Each half is identified by its location in the section (north half, south half, east half or west half).
With lines drawn north-south and east-west through the center of a section to connect all four quarter corners, the section is divided into quarters (Figure 2). Again, each quarter is identified by its location in the section (northeast quarter, southeast quarter, northwest quarter or southwest quarter).
Halves and quarters can be subdivided further, often into quarter-quarter (sixteenth) sections. Thus, a 40-acre block might be identified as the southwest quarter of the northwest quarter of Section 14, Township 2 South, Range 3 West, Willamette Meridian. A legal description then follows in parentheses. The legal description for small ownerships often includes a parcel identification number that may not match the quarters of a section. When these parcels deviate in shape from the usual subdivisions mentioned above, a licensed surveyor must tie the property lines into previously established section corners or quarter-corners.
Sometimes the grid isn’t perfect. For example, although every section is basically square and has four corners, these corners may not be shared with the adjoining section. And although each section should be 1 square mile and there are 640 acres in a square mile, not all sections have 640 acres. These discrepancies are a result of occasional measurement errors that were inevitable given the challenges of surveying vast areas. Also, because the Public Land Survey System uses plane surveying, which doesn’t take into account the curvature of the earth, surveyors would sometimes offset corners to avoid overlapping ownership. The result is sections that don’t have exactly 640 acres. Because of the process surveyors used to lay out townships initially, odd-shaped sections are generally along the western edges of townships.
Working with paper maps
Maps are used for many purposes and can be created using different survey methods. This section describes some features common to all paper maps and also discusses the types of maps commonly used.
Features of a map
Map scales and distances
A scale is a relationship between the distance on a map and the distance on the ground. A scale can be found on paper maps, allowing you to accurately estimate ground distances from the map. Map scales are written either as a ratio (1:12,000) or a representation (1 inch = 1 mile). In the first case, 1 inch on the map represents 12,000 inches (1,000 feet) on the ground. In the second case, 1 inch on the map represents 1 mile on the ground. In either case, you can find the distance on the ground between two points on the map by measuring with a ruler and multiplying by the map scale.
To use the map scale to calculate distance on the ground, select two points on a map. Measure the map distance using a ruler that shows inches and fractions of inches (most commonly twelfths or tenths of inches). Now multiply the measured distance by the map ratio. Convert inches to feet. You’ve calculated the horizontal ground distance between the two points! Note that on steep ground, the horizontal distance calculated from a map will underestimate the slope distance, which is the actual distance you would travel on the ground (see sidebar, ‘‘Accounting for Slope”).
Several websites allow users to print maps to a specified scale (Table 1). Enlarging paper maps using a photocopier is another option, although distortion can be a problem. For example, a 1:24,000-scale U.S. Geological Survey topographic (topo) map can be enlarged 200% to a 1:12,000-scale topo map.
Direction
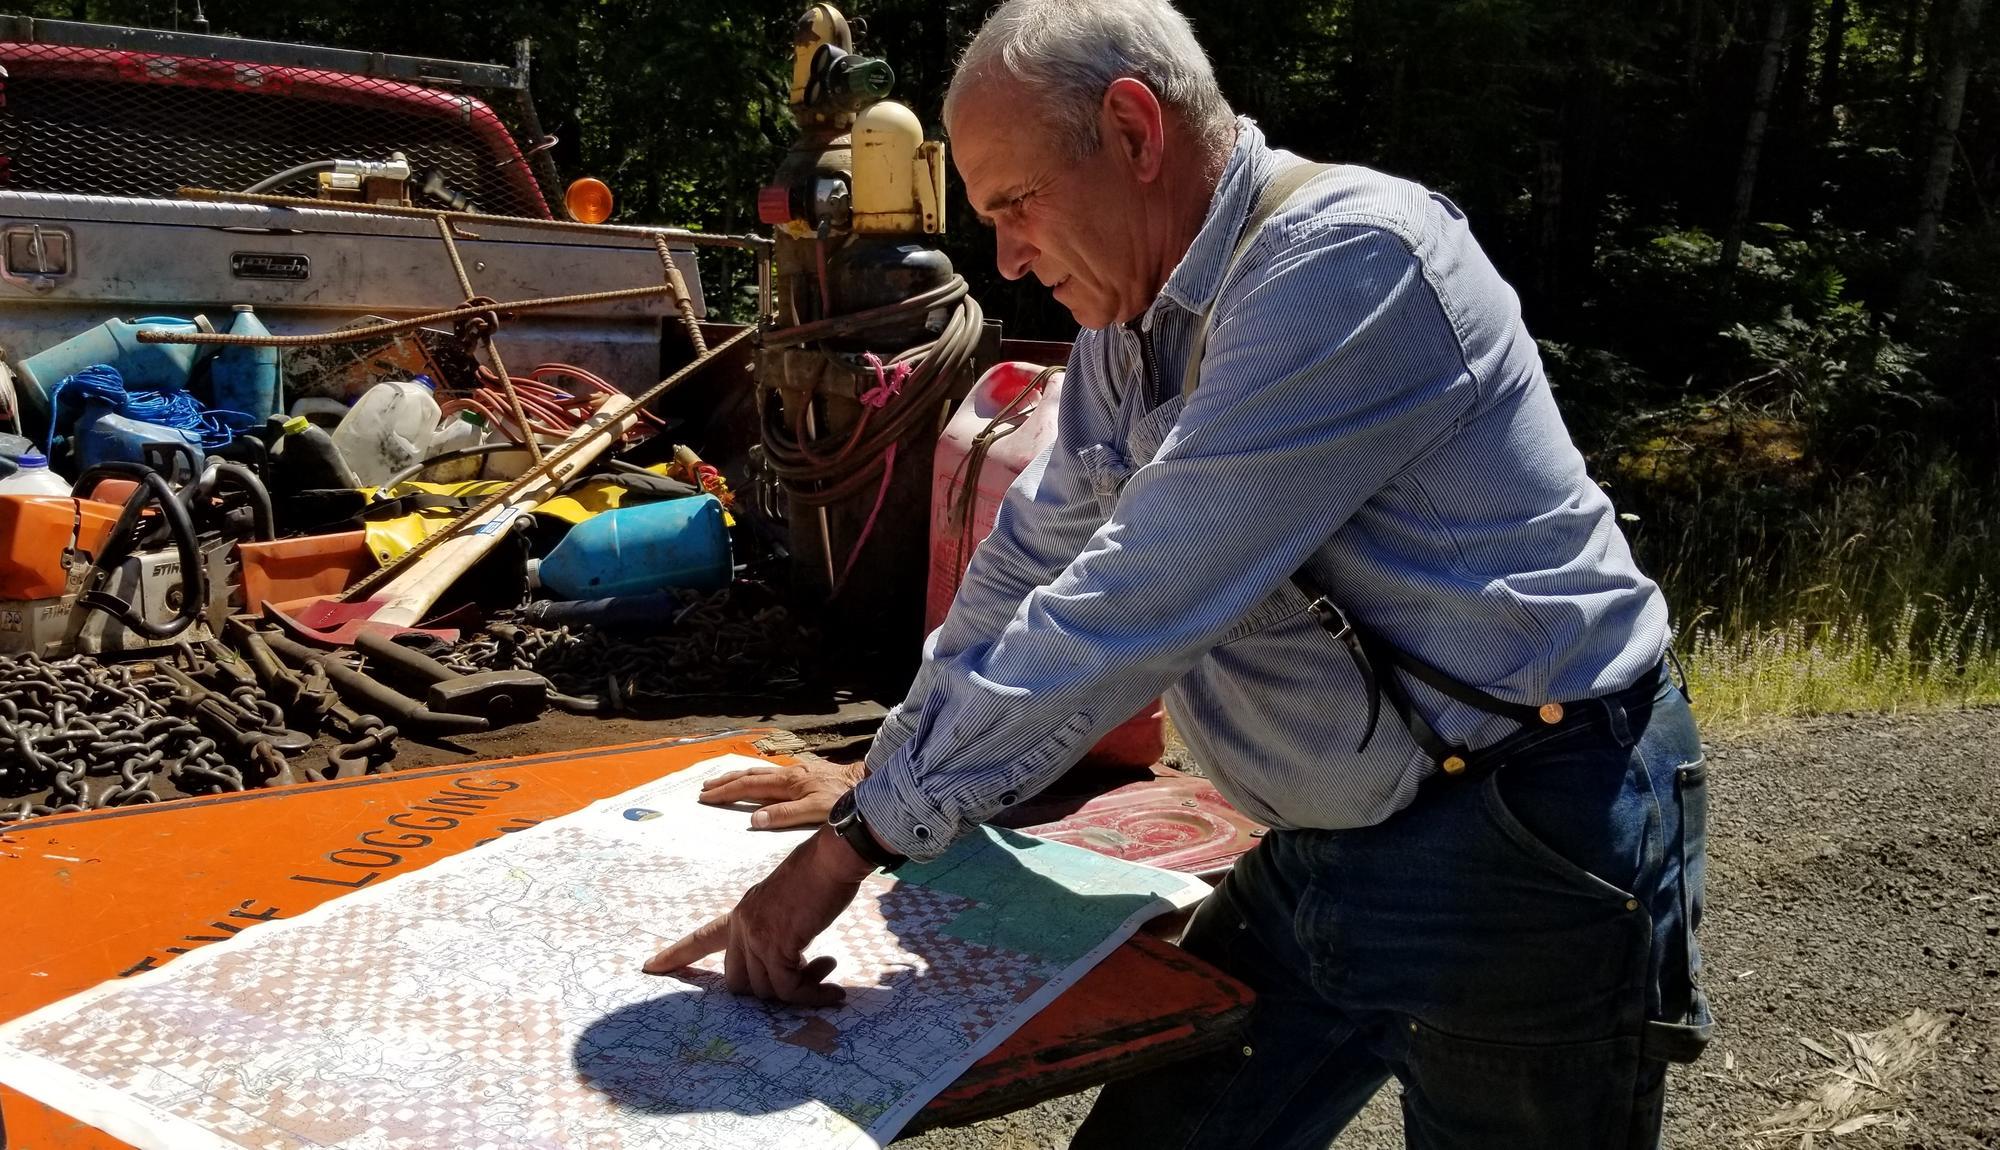
Maps are made with direction in mind, and the top of a map is usually oriented to true north (see “Magnetic Declination”). If you know how to read the direction between two points on a map, then you can use a compass to find the same direction on the ground and move from point to point (Figure 3).
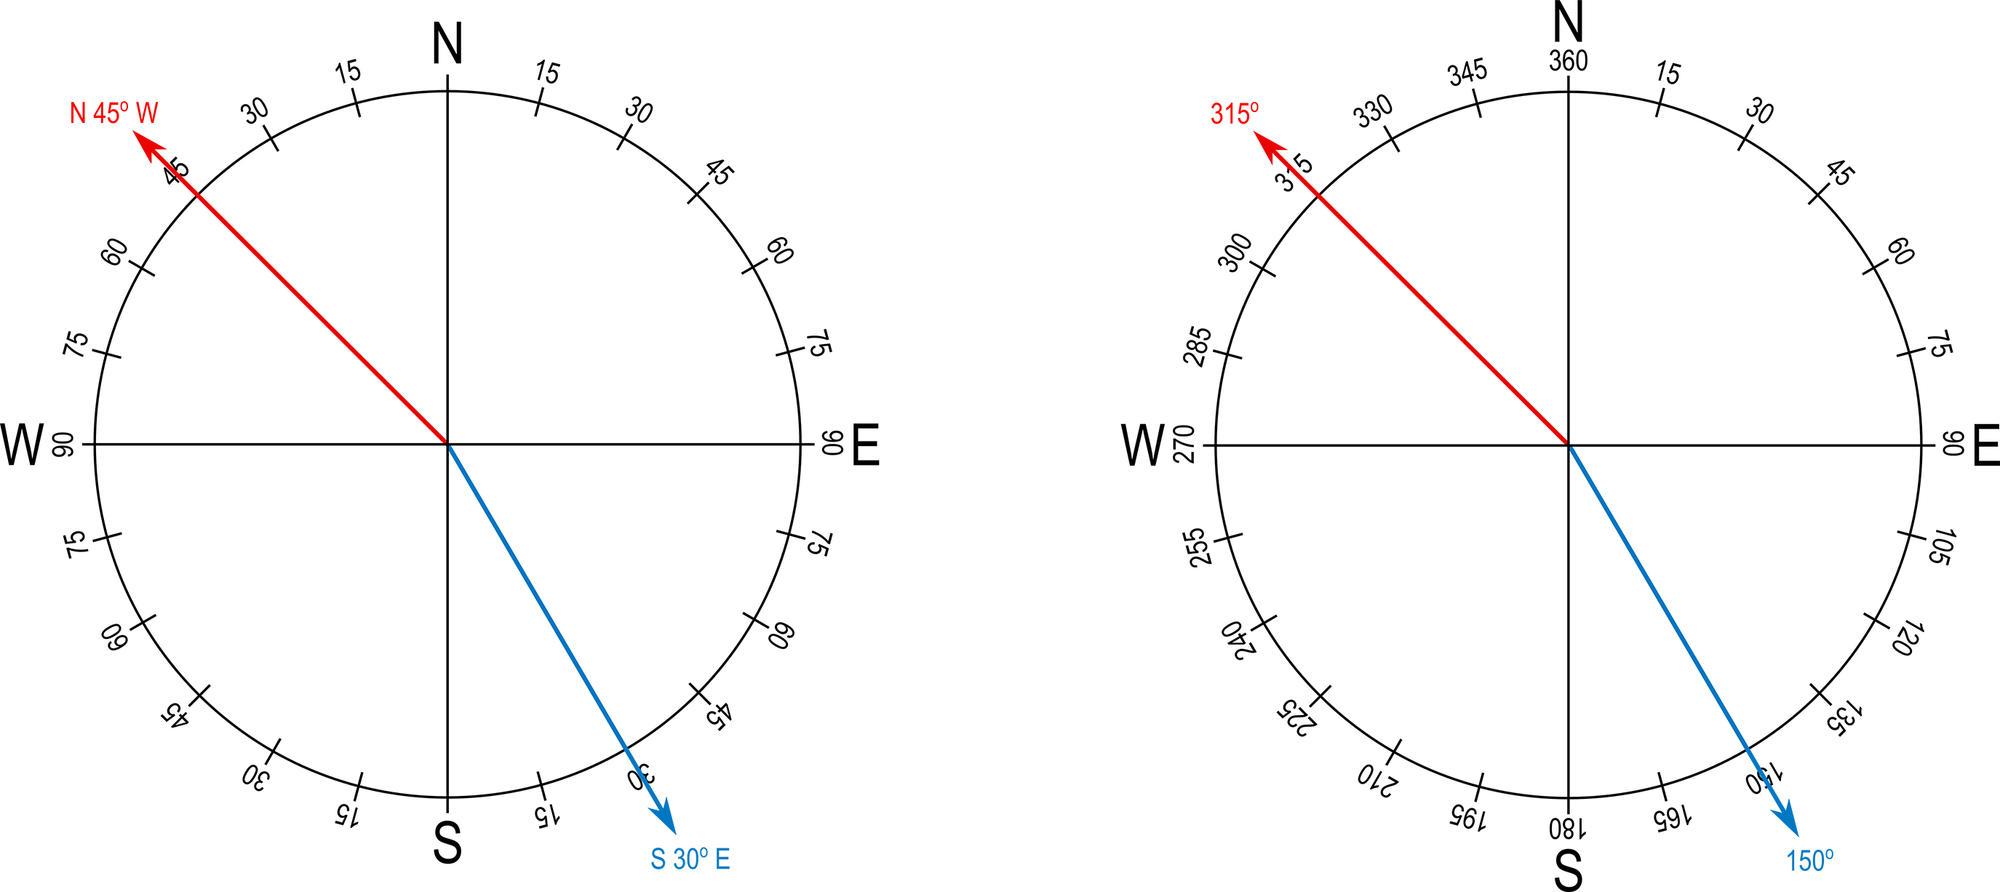
Direction is expressed as an azimuth or bearing. Azimuth is based on the 360 degrees of a compass. Due-north is located at zero or 360 degrees (they are one and the same). Azimuth is always read clockwise from north, so due-east is 90 degrees, due-south is 180 degrees, and due-west is 270 degrees. Bearings, however, are based on four 90-degree quadrants. Beginning from a north-south line, bearings are read from north to either east or west or from south to either east or west. For example, a bearing of “N 45 degrees W” is the same as an azimuth of 315 degrees, and a bearing of “S 30 degrees E” is the same as an azimuth of 150 degrees (Figure 4). Bearings are no more than 90 degrees since each quadrant contains only 90 degrees.
Map work is most often done using azimuths rather than bearings because azimuths are easier to read on a map when using a 360-degree protractor. Select two points on a map and draw a line running true north to south through one of the points and a line between the two points. Lay the protractor oriented north-south on the north-south line with the center of the protractor on the point. Where the line crosses the edge of the protractor, read the true azimuth from point to point.
Commonly used maps and imagery
Many types of maps and imagery are available to us today. Some of those most commonly used by forestland owners include transportation, topographic, legal boundaries and aerial imagery. Historically printed on paper (and still available as such), many of these resources are now available in digital formats (see “Working with Digital Maps”). Even if you rely on digital maps, it is wise to carry a backup paper map when traveling or navigating in unfamiliar terrain.
Transportation maps
Although a transportation map (Figure 5) typically covers a large area, such as an entire state or county, it can be used to help describe the location of your property. Transportation maps vary in design depending on who owns the land. Each government agency usually uses a consistent design, but there’s little consistency among agencies and even less between maps of private and public lands. Forest Service maps typically concentrate on roads on National Forest lands and might not show other connecting roads. BLM maps do the same for BLM lands. This inconsistency can be a problem if you’re working in an area with checkerboard ownership. Forest Service and BLM transportation maps are available at National Forest and BLM district offices. State departments of transportation often produce maps at the state and county levels.
Topographic maps
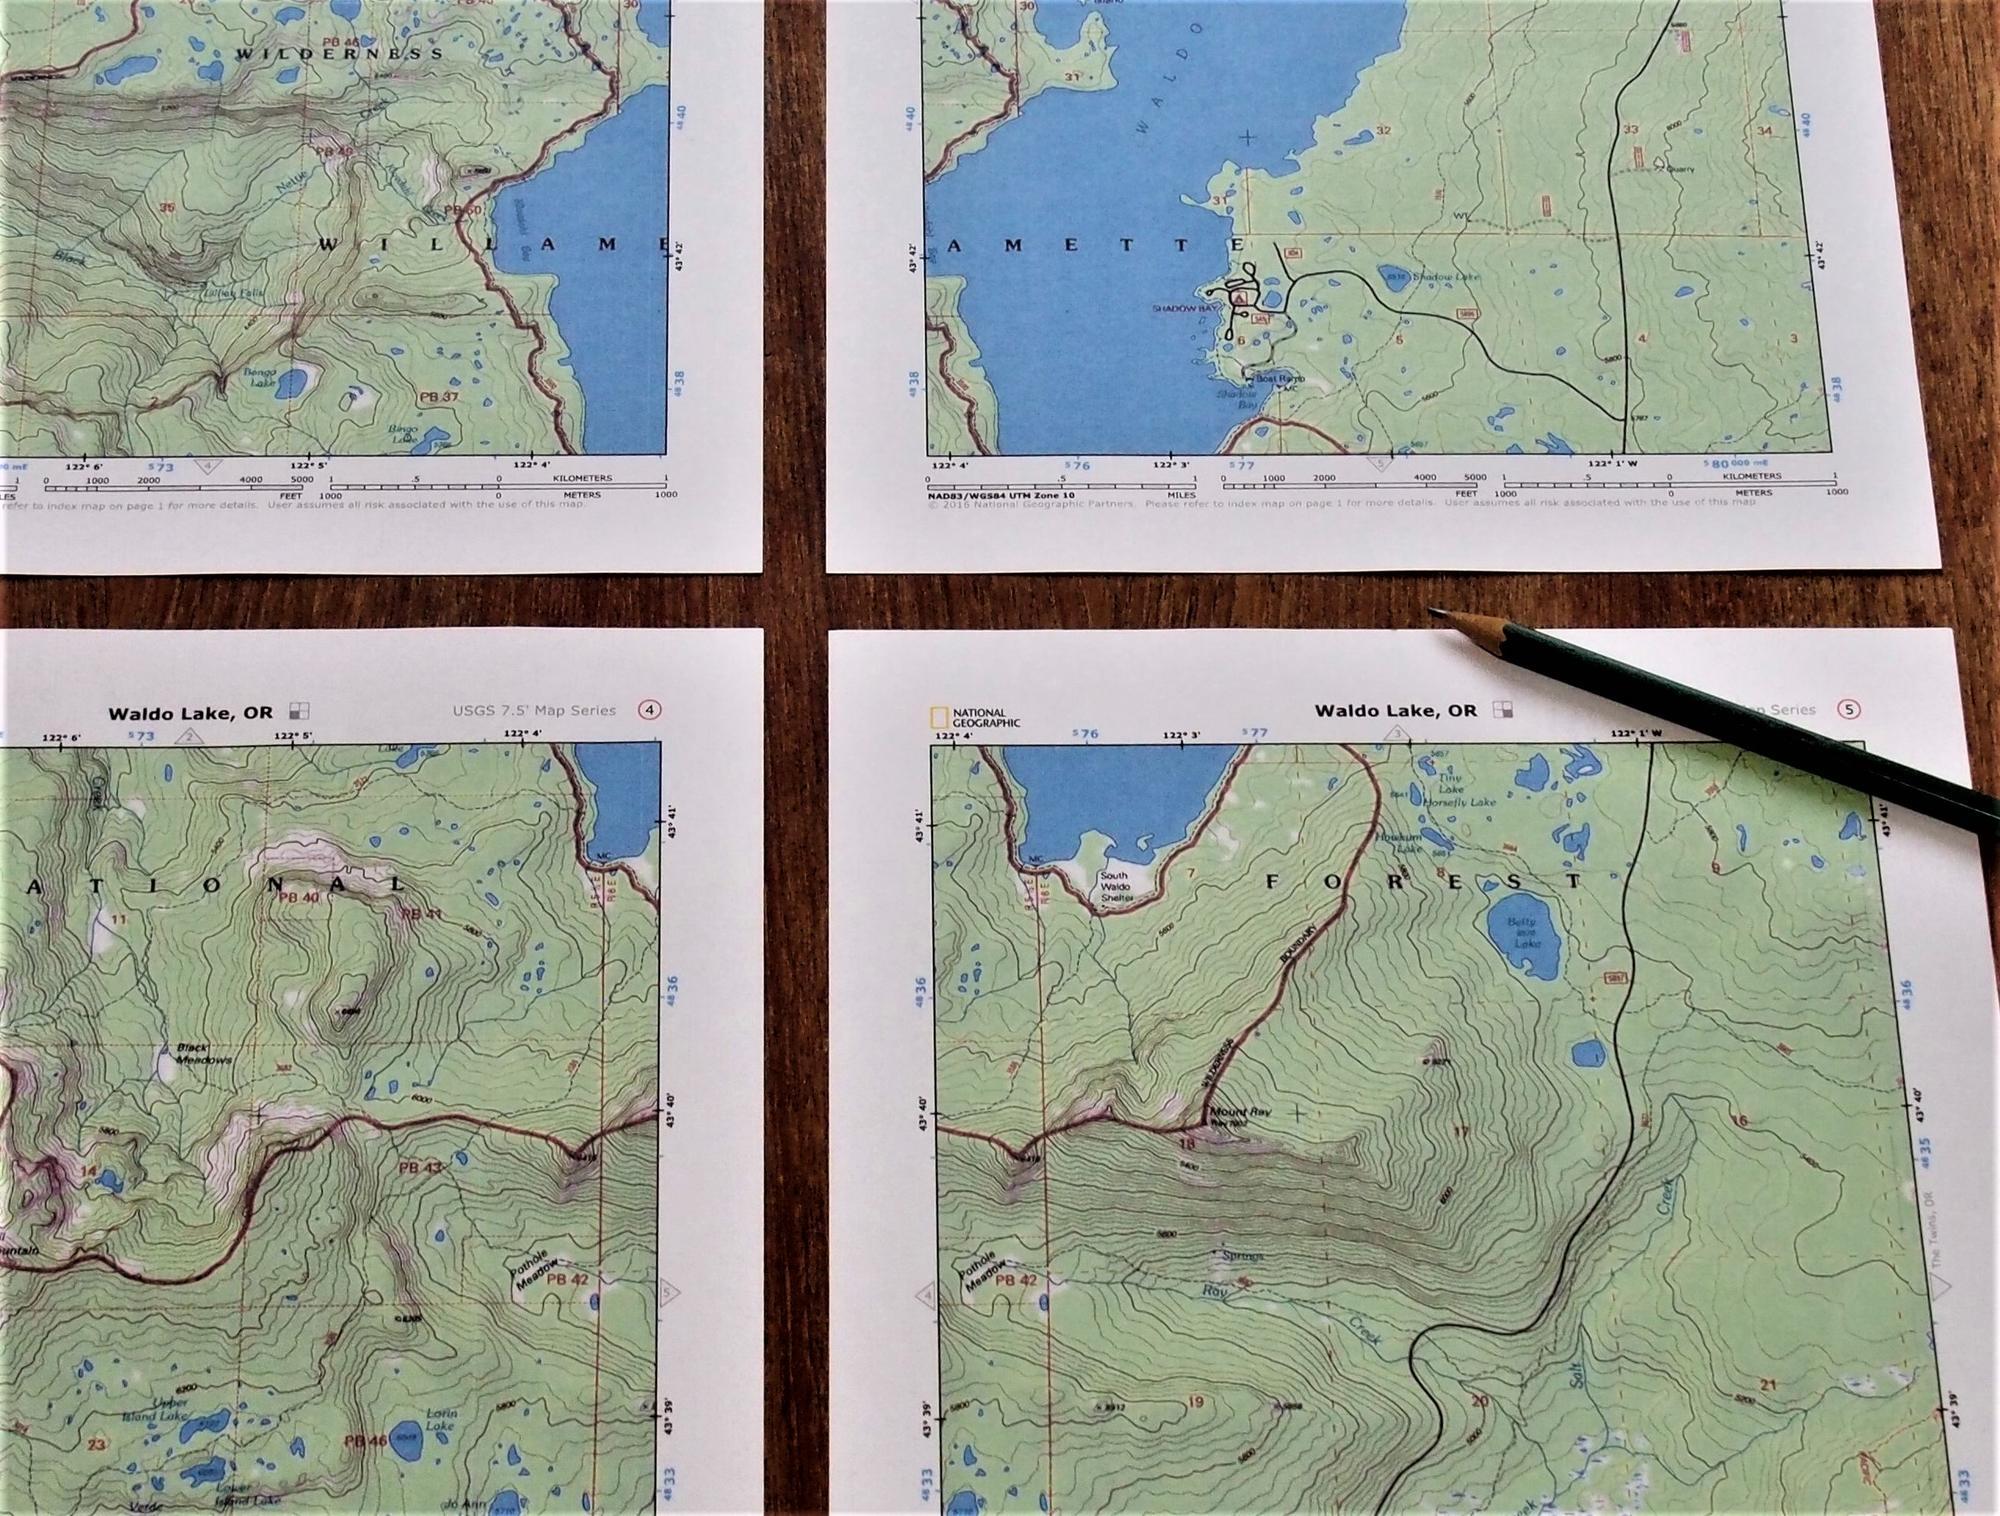
The U.S. Geological Survey produces topographic (topo) maps that show hydrology, vegetation, geologic features and human-made structures. Topo maps also contain contour lines that depict the lay of the land and can be used to estimate an area’s slope (Figure 6). Older USGS topo maps are available with a scale of 1:48,000 (1 inch on the map represents 48,000 inches or 4,000 feet on the ground), and newer 7.5-minute USGS topo maps are available with a scale of 1:24,000 (1 inch on the map represents 24,000 inches or 2,000 feet on the ground). Historical and new USGS topo maps are available online (Table 1).
Plat maps
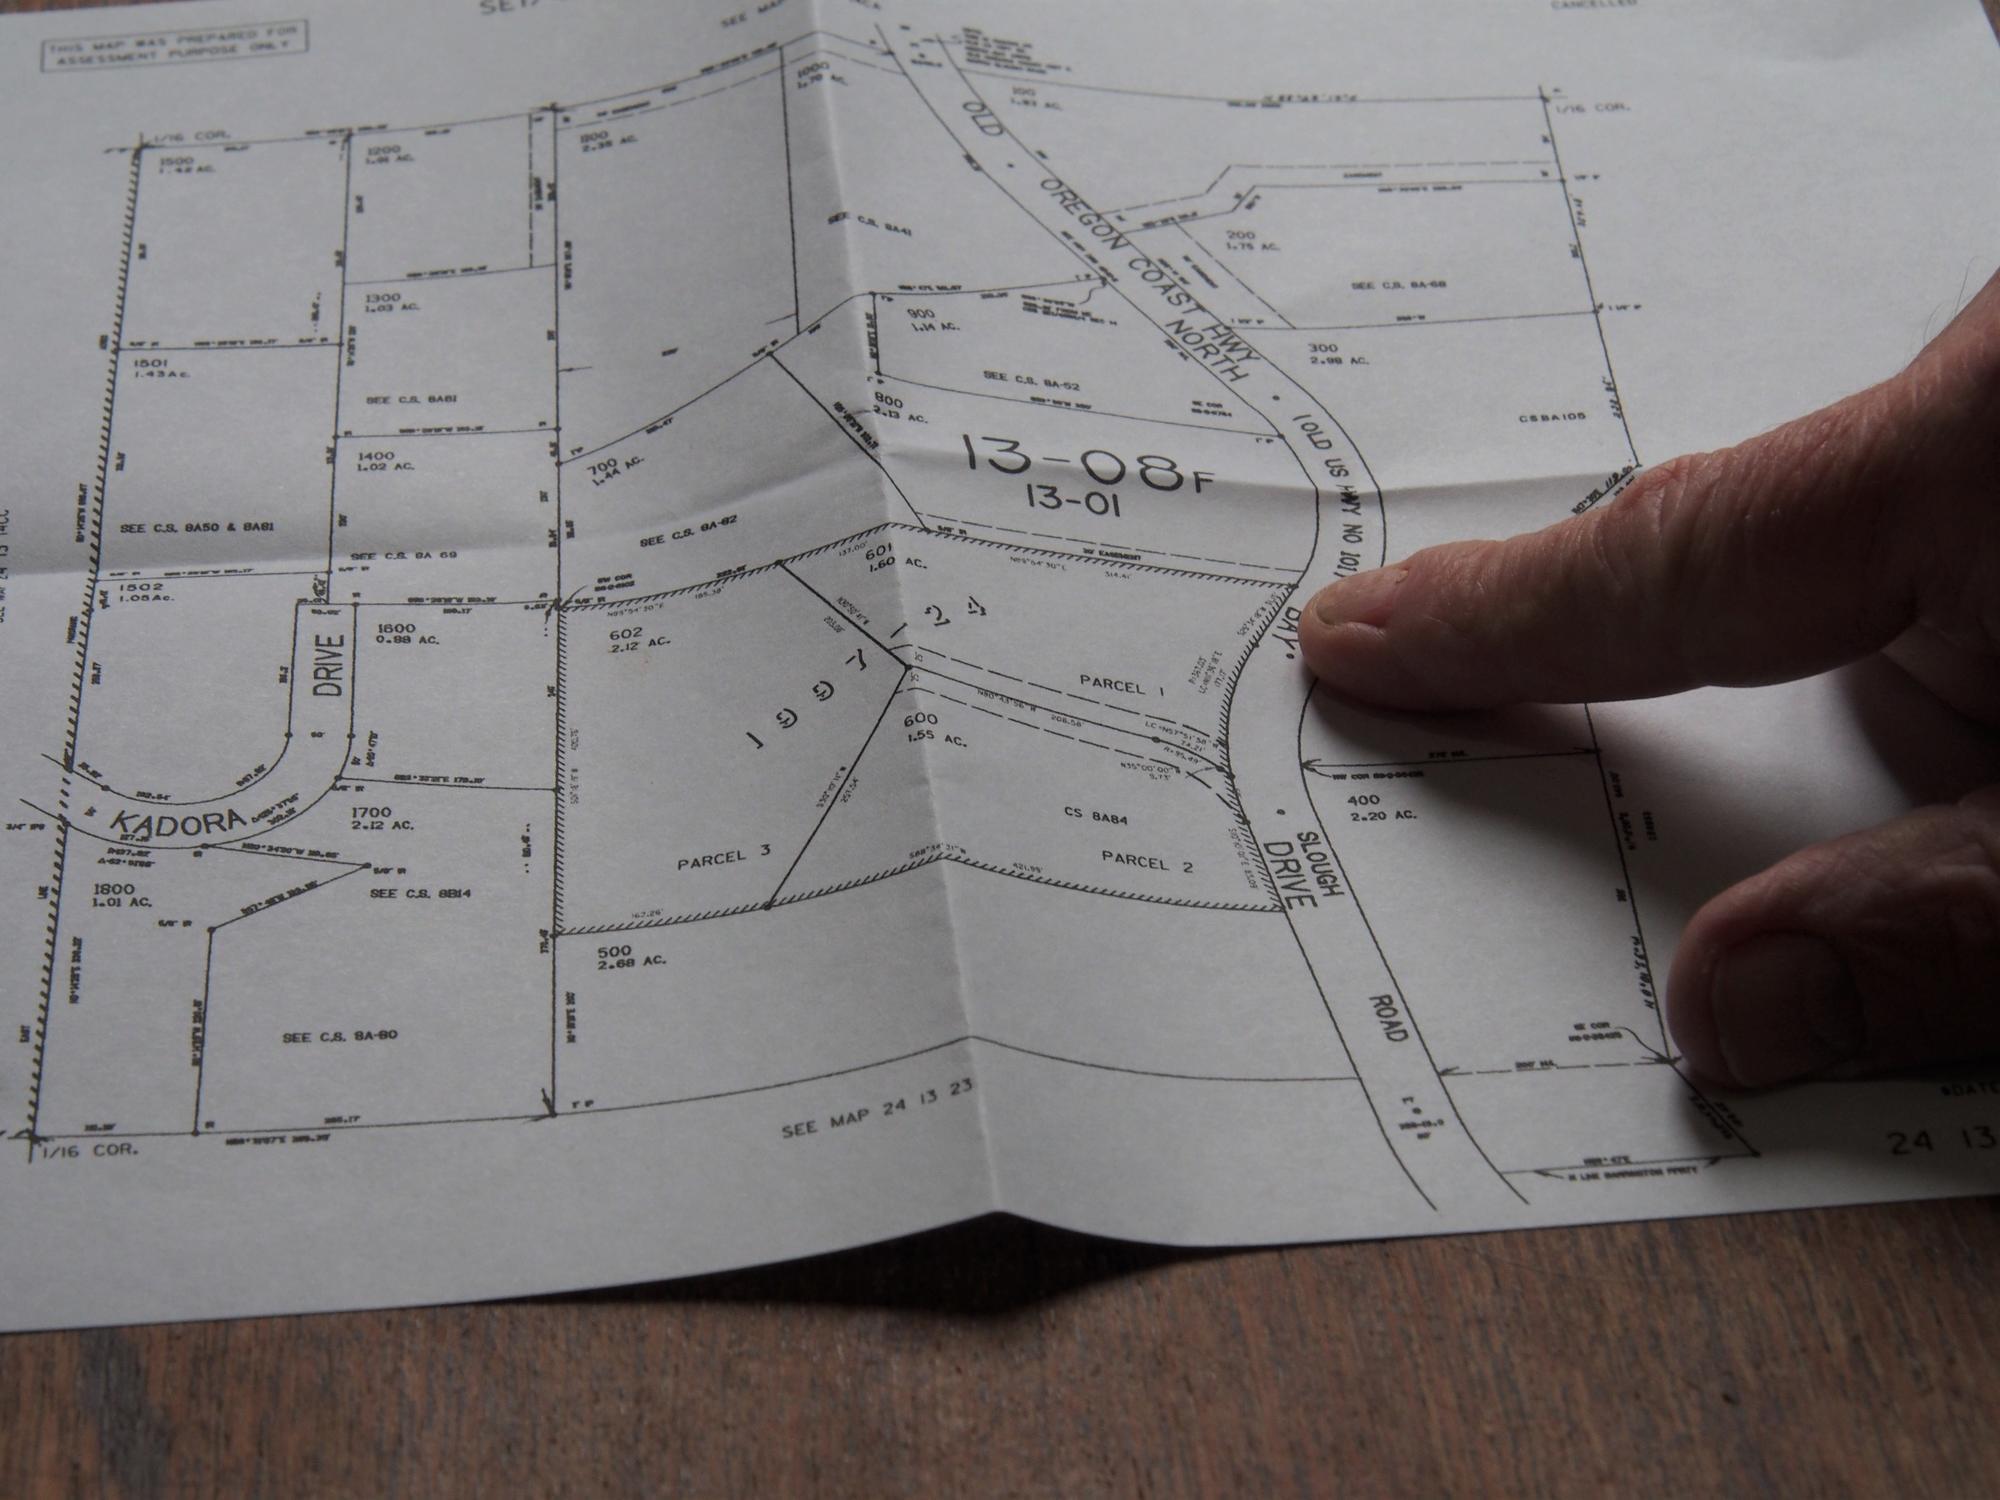
Plat maps display the legal boundaries of one or more properties (Figure 7). These maps typically cover a single section, although they may be larger or smaller depending on the number of subdivisions. Property lines are described by their length and direction and include some physical features and roads. A landowner skilled with a compass can use a plat to approximate property lines on the ground, but they should always employ a surveyor to accurately locate property boundaries. Plat maps are available in your county assessor’s office. Many assessor’s offices offer them online. Phone apps display simplified versions showing property ownership.
Aerial photographs
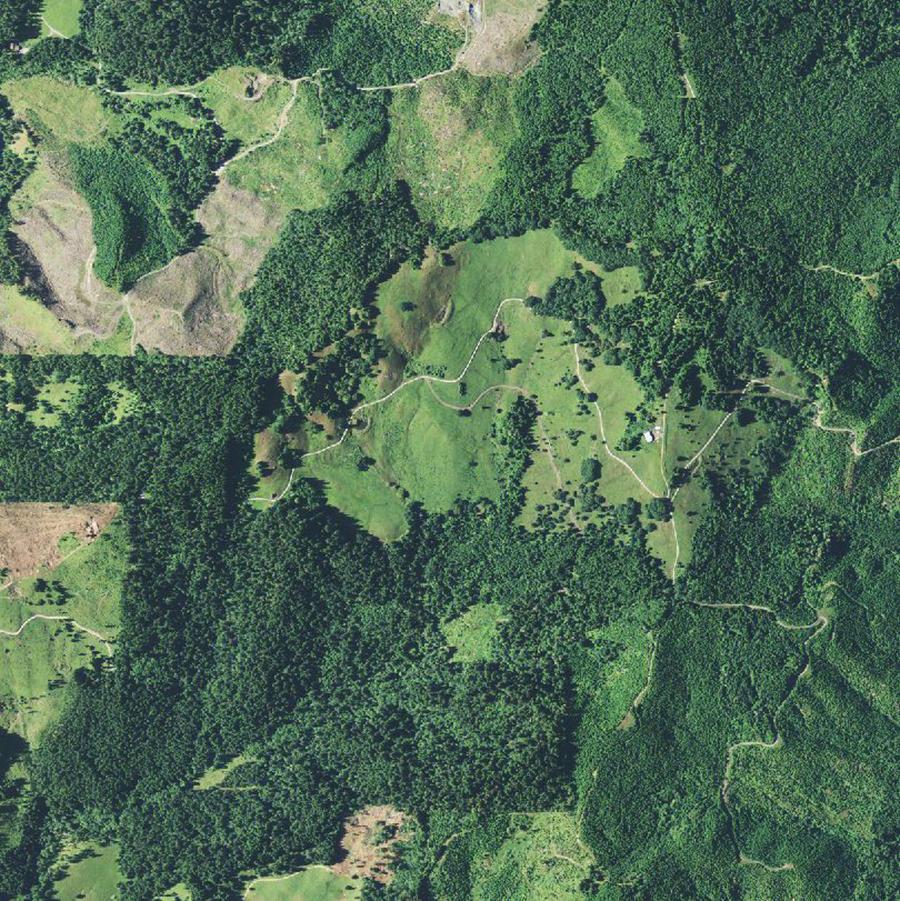
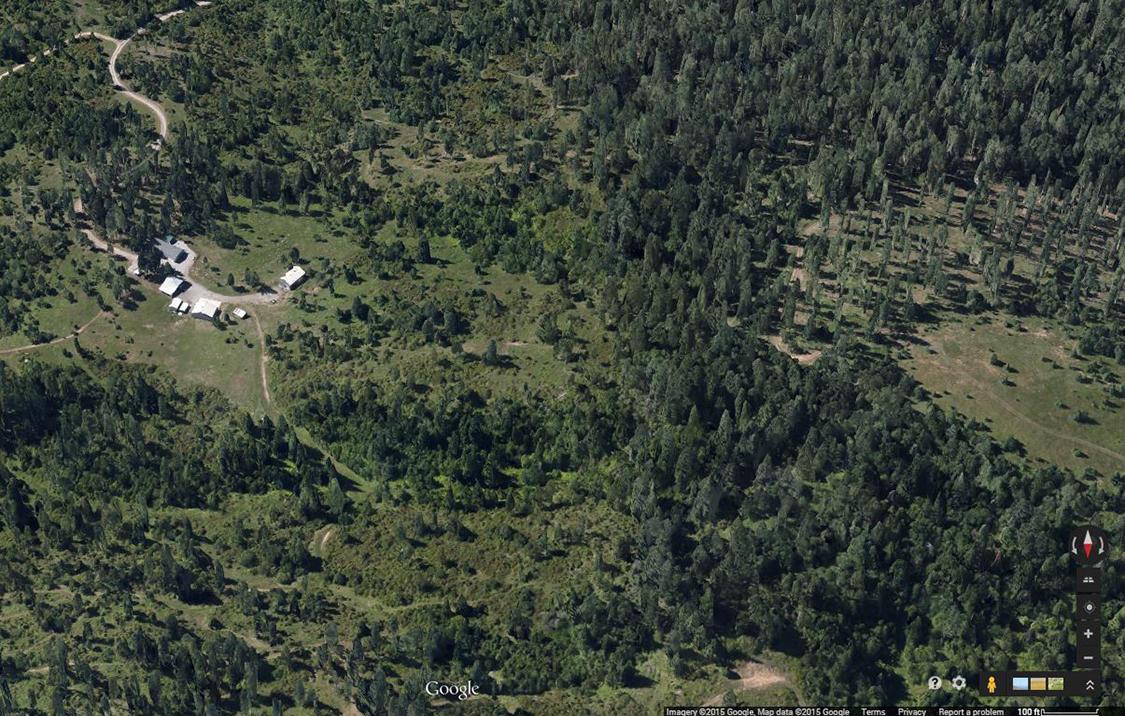
Aerial photographs (Figure 8) are not maps but can be used for many of the same purposes. They are generally produced and printed at a 1:12,000 scale. Older aerial photos might be distorted, making azimuths and distances difficult to measure. However, almost all newer digital photos have been geometrically corrected (orthorectified) to account for distortions. Orthophotos can be used to calculate distances and azimuths.
Digital mapping technology
Advances in digital mapping technology have increased the types of available map data and the way users interact with maps. This section describes some common digital technology used to collect data for mapping.
Remote sensing
Digital maps are commonly produced from remote sensing data. Remote sensing is the process of collecting data about the earth using satellites, aircraft and unmanned aerial vehicles. Aerial photographs are the most familiar product of remote sensing, but images are also collected by satellites orbiting earth. Additional remote sensing products include digital elevation models and LiDAR.
Digital elevation models
Digital elevation models use surface data from remote sensing or topographic maps to produce terrain maps. These terrain maps are generally shaded to highlight topographic relief or represented as a 3D map. Some 3D map applications allow the user to view the landscape from different aspects (Figure 9). However, features in 3D visualizations can appear exaggerated or overly steep and do not always accurately depict topographic features.
Light Detection and Ranging
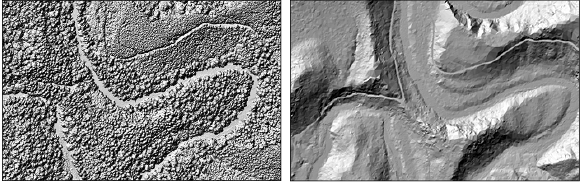
Light Detection and Ranging is a special form of remote sensing that uses lasers to detect distances. A LiDAR sensor flown over a forest can produce a digital elevation model and a detailed, three-dimensional representation of vegetation. LiDAR terrain maps are detailed enough to reveal old stream channels, roadbeds and landslide sites. Since vegetation is also detected with LiDAR, the heights of trees can be used to delineate different stands in a forest (Figure 10). LiDAR imagery, when available, can be downloaded into a Geographic Information System or viewed online. The Oregon Department of Geology and Mineral Industries has free downloadable LiDAR for portions of the state as well as a map viewer for viewing online (Table 1).
Global Positioning System
The Global Positioning System is a network of satellites orbiting earth, transmitting precise time and position data day and night. Satellite signals are broadcast to hand-held units on the ground. When the hand-held device receives signals from three or more satellites, it determines the user’s position on earth. Hand-held units vary in cost from as little as $100 for consumer-grade receivers up to tens of thousands of dollars for survey-grade instruments. Many mobile devices such as smartphones and tablets have built-in GPS receivers that are accurate within 3–4 meters.
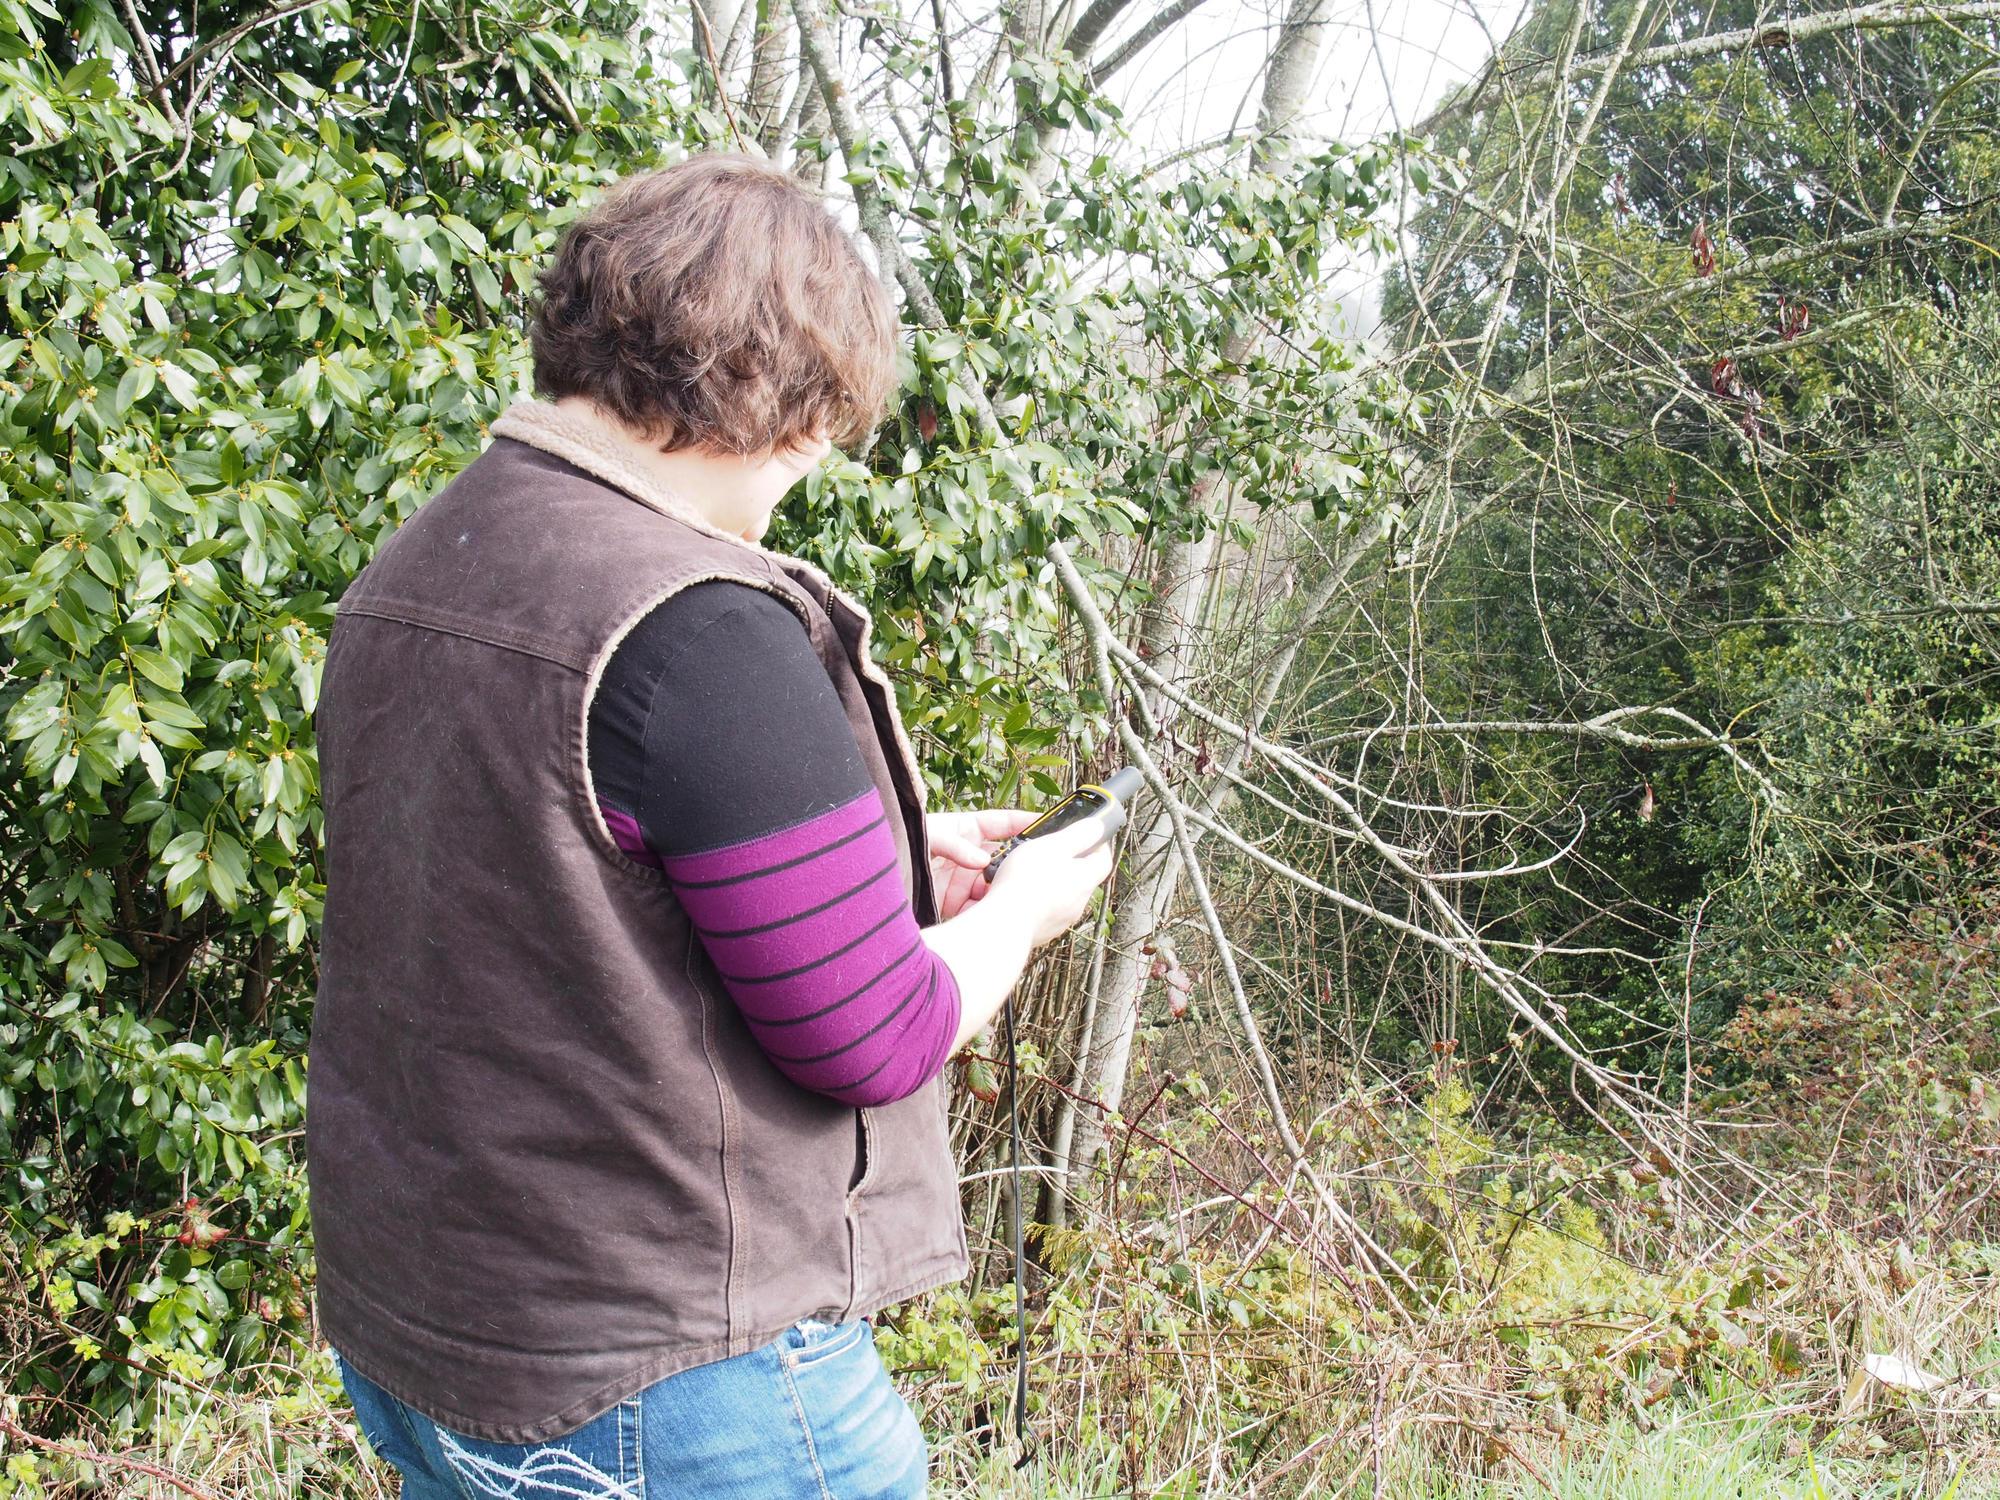
The accuracy of inexpensive GPS receivers and smartphones can be low, especially when trees or other obstacles don’t allow a clear view of satellites. However, they can still be useful for making rough estimations or for navigation in the field (Figure 11).
Devices equipped with GPS can be used to estimate areas, distances and elevations, and they can also be used to collect data for Geographic Information Systems. Alternatively, features from a map or GIS (such as property lines or points of interest) can be uploaded to a mobile device. This allows for easy navigation to those features on the ground.
Unmanned aerial vehicles
Unmanned aerial vehicles
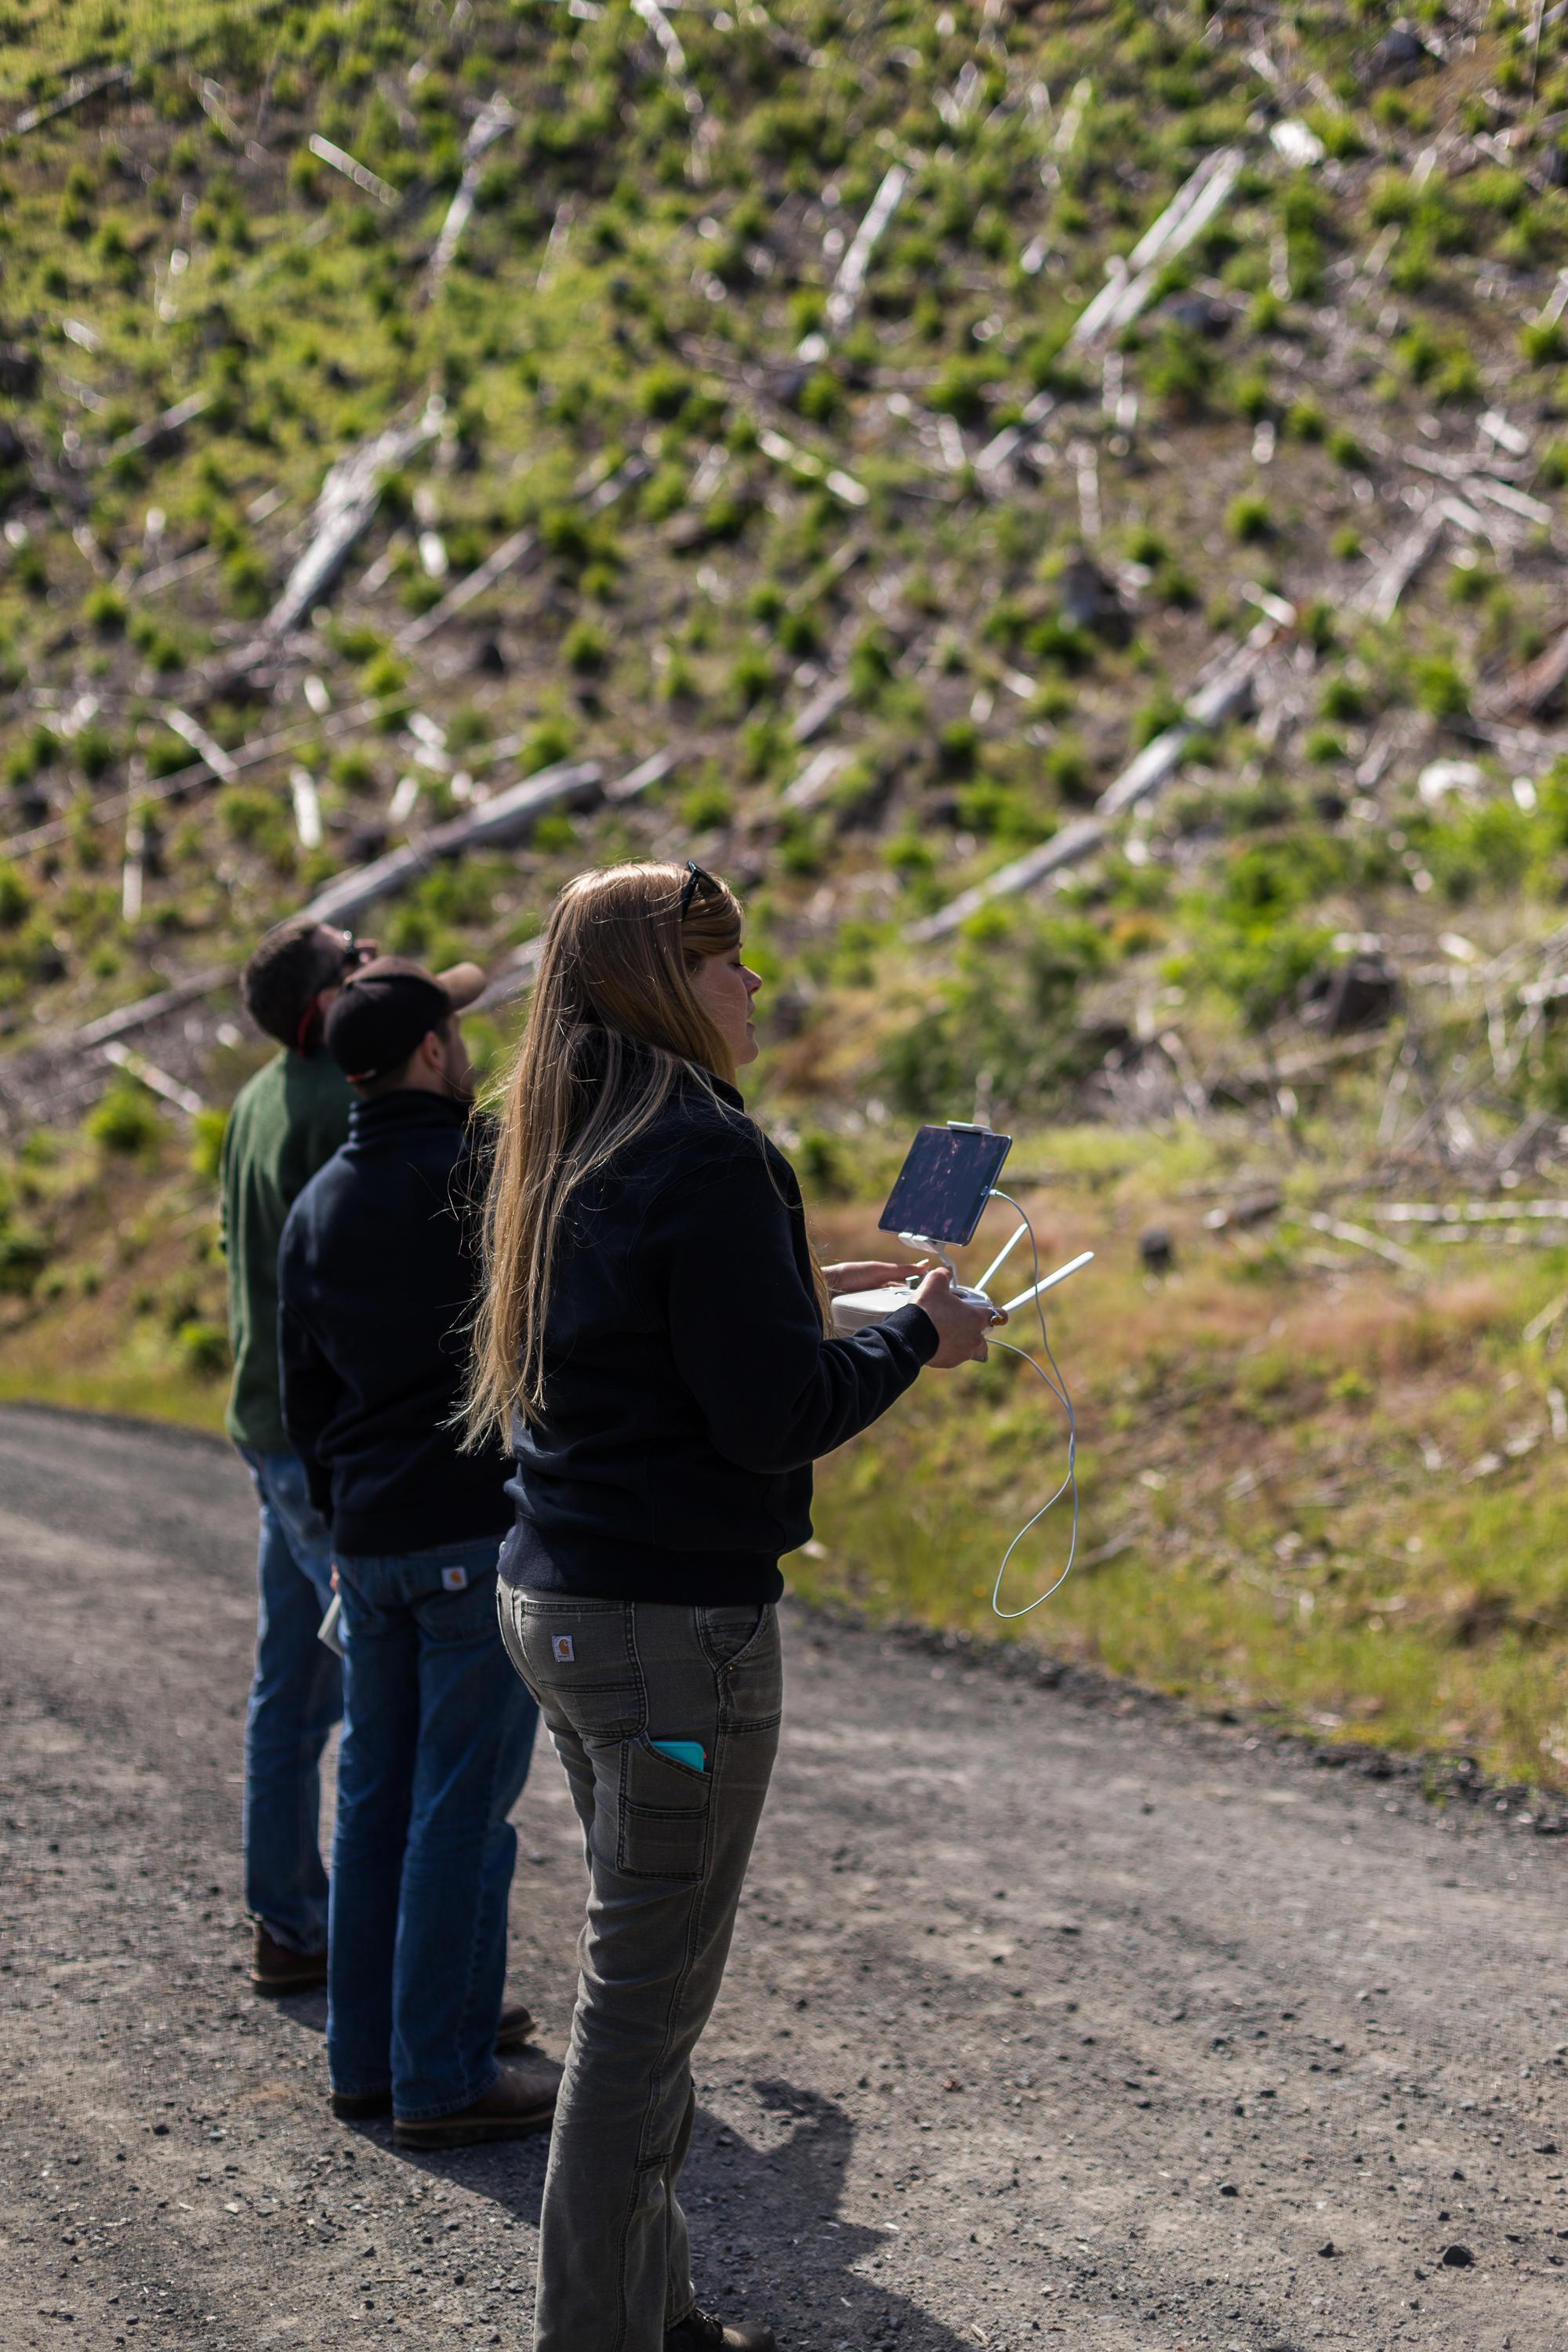
Unmanned aerial vehicles, also called drones, can take aerial photographs over small properties. This allows for relatively inexpensive remote sensing. Drones produce high-resolution aerial photographs, LiDAR and thermal sensing data that are immediately available for use and analysis. Landowners and foresters use them for insect or disease surveys, forest inventory, map harvest units, wildlife monitoring and fire detection (Figures 12 and 13). Many professional consultants use aerial mapping drone technology. Ask to see examples of the types of products they can produce to see if they will fit your needs. If you purchase your own drone for aerial photographs, follow all local and Federal Aviation Administration regulations and licensing requirements.
Working with digital maps
Digital maps have a tremendous range in capabilities including:
- Static maps you can view, print or download.
- Searchable maps with data.
- Map interfaces with digital drawing or measuring tools.
This section includes types of features that can be found on digital maps and websites.
Digital map features
Web-based resources offer free, easy access to high-quality aerial photographs and geographic data. The functions and capabilities of digital maps vary by site. Some sites have tools for mapping and simple geographic measurements and analyses. Other sites are repositories or libraries for digital maps and data. It is a good practice to take a look at the source of the data, the date it was created and the general accuracy or precision of the data.
Map resolution
The resolution of a digital aerial photo depends on the camera used. An aerial digital image is made up of pixels. The pixel size in a digital aerial photo represents a distance on the ground. For example a photo taken at a 1-meter resolution has pixels that represent a 1-meter distance on the ground. This allows you to differentiate objects in the image that are 1 meter or larger. The higher the resolution, the more detailed the imagery. Low-resolution imagery can seem grainy or blurry when zooming into the photo. Zooming in on a high-resolution aerial photo provides detailed views of features on the ground.
Scale
Some digital map interfaces show a scale that adjusts as you zoom in and out of the map. The Web Soil Survey allows you to calibrate the map scale to your computer’s screen resolution, allowing you to select and use a specific map scale. When printing out a digital map, measure the scale bar with a ruler to ensure the image is printed to the correct scale.
Georeferenced maps and photos
Georeferenced digital maps have features that are associated with a geographic coordinate system. This allows you to view the ground coordinates of map features and to use the map in digital mobile applications (apps) and GIS. Georeferenced topo maps can be downloaded from the USGS TopoView site (Table 1) or other providers.
Photos taken with a smartphone or a digital camera are also typically georeferenced (also referred to as geotagging) to the ground coordinates where the photo is taken. Georeferenced photos can be linked to digital maps using a variety of software and programs, including Google Earth and Avenza Maps (Table 1). Linking georeferenced photos to a digital map can be a useful way to keep track of management activities on your property.
Map layers, data and tools
Investigate the functions offered by the different digital map websites. Some websites have map viewer applications that allow the user to select map data layers to overlay on a base map or view tables of associated data. Other possible functions include tools to measure distance, calculate area or draw shapes. These tools are typically accessed with a menu bar and often have a help directory where you can learn more about the capabilities of the application.
Commonly used digital maps and websites
Digital map resources include aerial imagery, tax lots, roads, boundaries of counties and government land ownerships, topographic maps, LiDAR, soils and vegetation cover. Historical maps are a great resource to find old place names, locations of homesteads and other historical features. In addition to USGS map sources, scanned historical maps are often available in university digital archives.
Google Earth
Google Earth is a web-based geographic browser that accesses satellite and aerial imagery to produce a 3D interactive globe. It is available for free for both basic and advanced versions. Google Earth allows the user to search for specific addresses or coordinates and see points of interest from various angles. The program has many functions that allow the user to learn about specific places of interest. These “layers” can include photo and video, allowing the user to interact with various recorded locations.
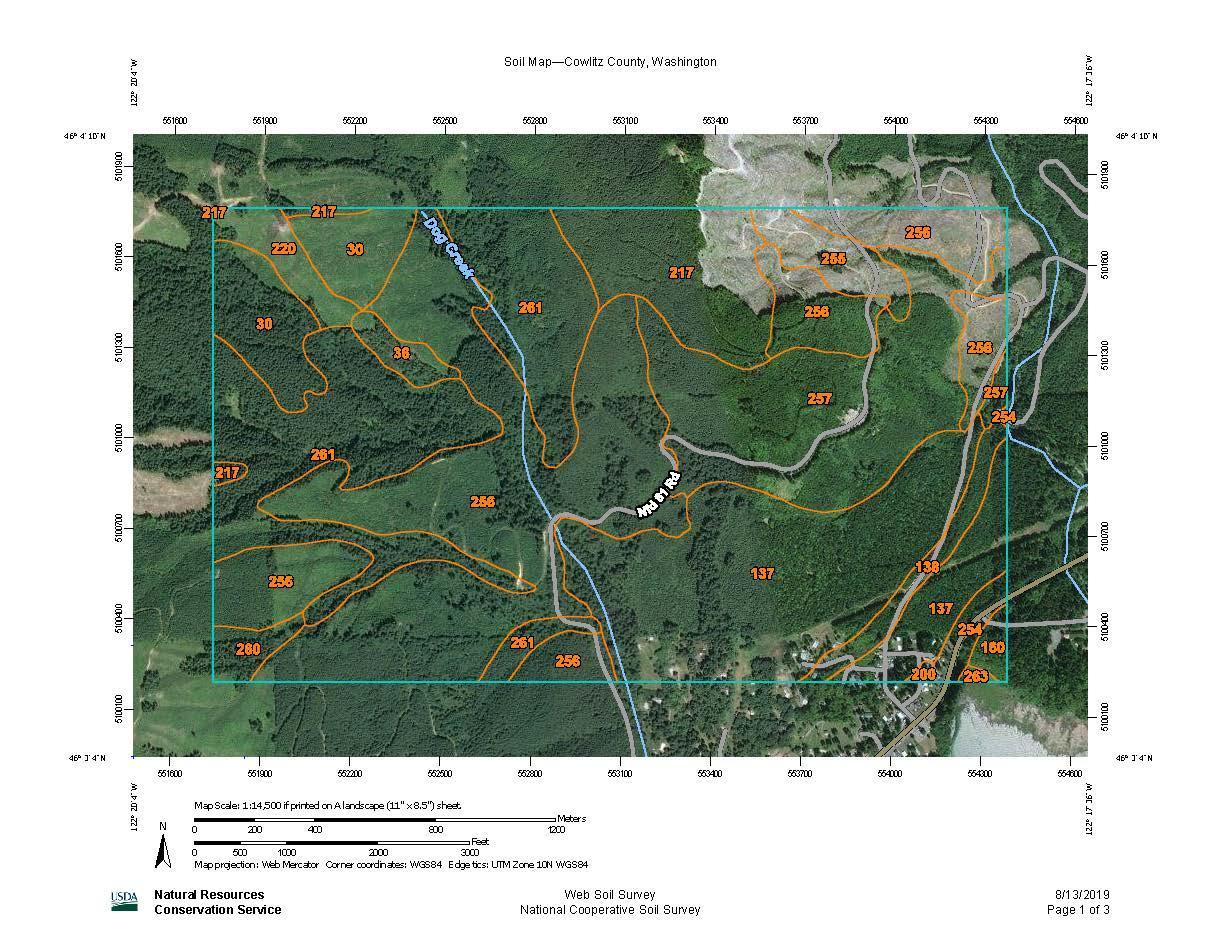
Web Soil Survey
The online Web Soil Survey, produced by the National Cooperative Soil Survey and operated by the USDA Natural Resources Conservation Service, allows you to view soil data and associated information (Table 1). Soil surveys provide users with information on soil type, properties, qualities and limitations for use (Figure 14). Users can use downloaded soil reports as references for land management activities.
County tax lots
County tax lot maps are useful for mapping, property analysis and planning purposes. Some counties have map viewer applications for viewing tax lot information, plats and additional county planning data. Investigate your county tax assessor site (Table 1) to see what digital map resources your county provides. For specific information regarding individual tax lots, contact your county assessor.
Digital libraries and data sets
Digital libraries and data sets are compilations of digital map data for a specific region or theme. These sites often provide a variety of additional features, including map viewer applications that allow you to take simple measurements and view multiple layers and linked resource data. Examples include Oregon Explorer, Atlas of the Pacific Northwest, Inside Idaho, Washington Geospatial Open Data, USGS National Map Viewer, USGS TopoView and CalTopo. The National Geographic Trail Maps website has downloadable USGS 7.5-minute topo maps that can be printed out to scale on four letter-size (8.5-by-11-inch) sheets of paper (Table 1). The CalTopo website allows you to select mapping layers and download the file as a georeferenced PDF that can then be uploaded to mapping apps for use offline in the field (Table 1).
Ecotrust Forest Planner
Ecotrust Forest Planner is a web-based tool used for forest management and scenario planning for landowners in Oregon and Washington. This tool provides a variety of resource layers and tools to help landowners explore forest management alternatives (Table 1).
Geographic Information System
A Geographic Information System links information collected about the earth’s features and resources to a digital base map. Information on each type of resource is stored as a mapping layer, like layers of acetate laid over one another (Figure 15). Resource layers commonly include the Public Land Survey System, topography, transportation, water, vegetation, geology and land ownership. Digital aerial photographs are also commonly used in a GIS. The layering of different features allows for complex analyses and modeling as well as detailed, efficient mapmaking.
GIS is generally used by owners of large properties, but some small woodland owners find it useful. However, commercially available programs with a licensing fee might be out of reach for small woodland owners. You might consider a variety of free applications now available.
Apps
Several apps are available for users to download onto mobile devices, such as smartphones and tablets. A user will interact with these apps to accomplish a task in the field, such as mapping a property boundary, inventorying a stand of trees, inputting data, referencing data or georeferencing photos. Not all apps are free. Prices vary, so be sure to read the fine print regarding subscription services or any extra costs for downloading maps or data.
All smartphones and tablets have a basic map app preloaded onto the device. Most of these basic map apps, such as Google Maps, perform basic functions such as navigation and saving points of interest. For a more detailed map experience, an app such as Avenza Maps (Table 1) can be downloaded. This app allows the user to download maps for offline use (no cell service required), use the device’s built-in GPS to track your location on any map, plot locations and photos, measure distance and area, and more.
To perform a forest inventory, an app such as Plot Hound can be useful. This app allows the user to download cruises and plots to their device, navigate to each plot with their phone’s built-in GPS and compass, and enter data collected in the field.
For soils information, an app such as SoilWeb can be a great tool (Table 1). This app is based on the USDA’s National Cooperative Soil Survey and provides GPS-based soil information for your current location. This app can be used in the field where cell coverage is available to better understand the soil types and how to optimally use the soil.
For more information
Textbooks
- Paine, D.P. and J.D. Kiser. 2012. Aerial Photography and Image Interpretation. New York. John Wiley Inc.
- Kiser, J.D. 2010. Surveying for Forestry and the Natural Resources. Corvallis, OR: John Bell and Assoc.
Publications
- Unmanned Aerial Vehicles (Drones): How they operate and their potential for improving your forest and rangeland management (EM9190).
Sidebars
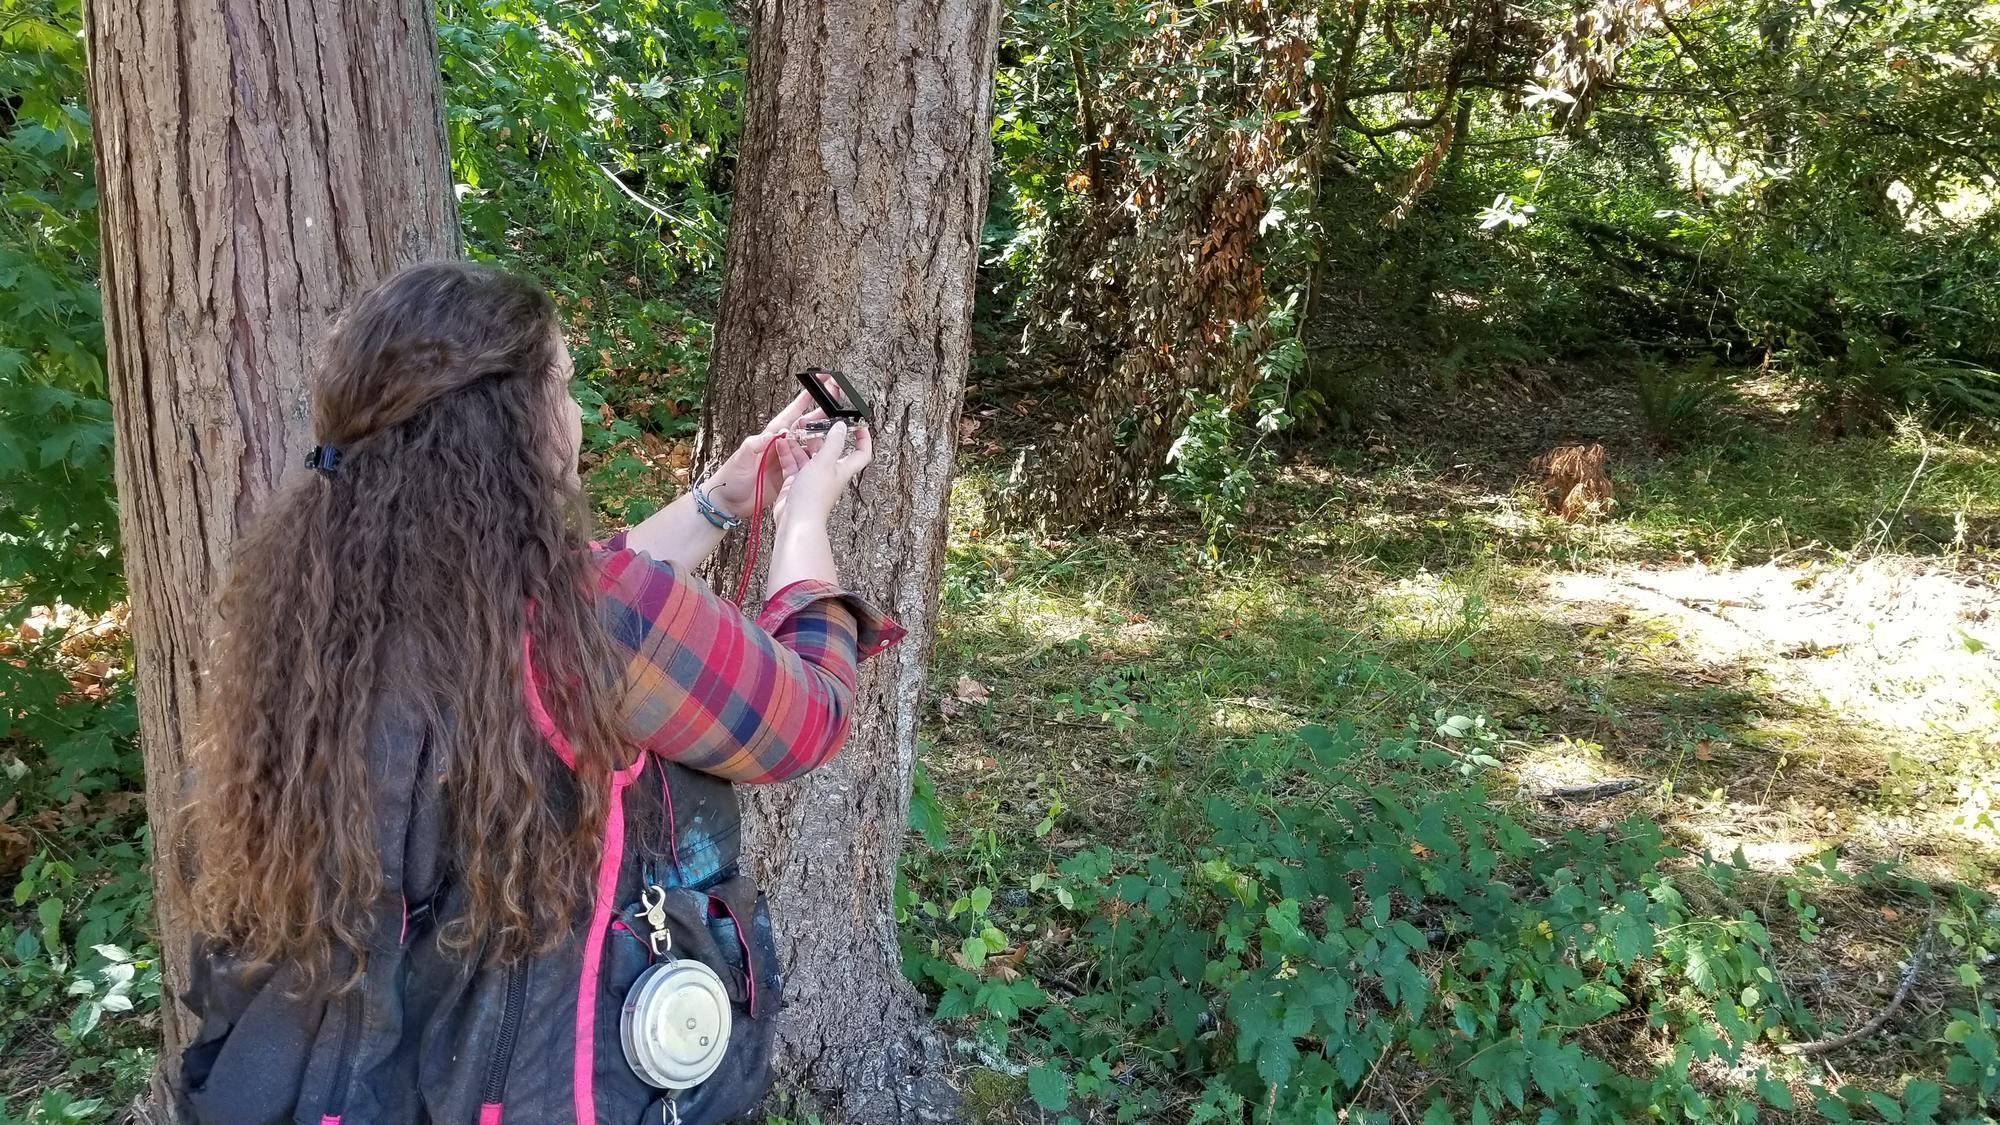
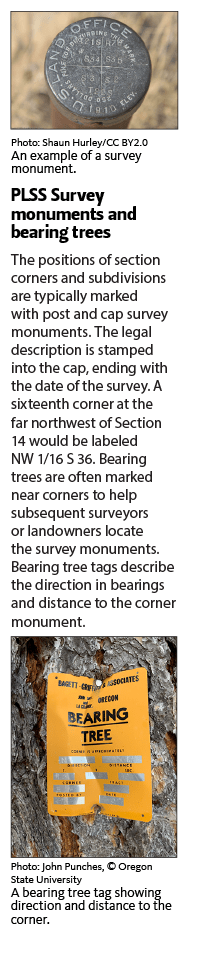
PLSS Survey monuments and bearing trees
The positions of section corners and subdivisions are typically marked with post and cap survey monuments. The legal description is stamped into the cap, ending with the date of the survey. A sixteenth corner at the far northwest of Section 14 would be labeled NW 1/16 S 36. Bearing trees are often marked near corners to help subsequent surveyors or landowners locate the survey monuments. Bearing tree tags describe the direction in bearings and distance to the corner monument.

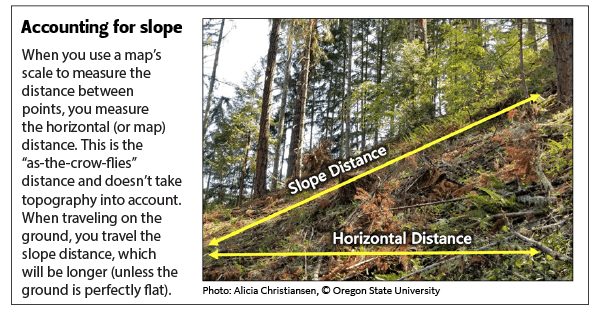
Accounting for slope
When you use a map’s scale to measure the distance between points, you measure the horizontal (or map) distance. This is the “as-the-crow-flies” distance and doesn’t take topography into account. When traveling on the ground, you travel the slope distance, which will be longer (unless the ground is perfectly flat).
Magnetic declination
Earth’s magnetic field doesn’t align perfectly with the North and South poles. Because of this offset, there is a true north (the direction to the North Pole) and magnetic north (the way a magnetic compass will point). Maps are usually oriented with true north straight up, so to navigate using a magnetic compass you need to account for the offset between true north and magnetic north. This compass adjustment is called magnetic declination. Magnetic declination shifts over time and will vary depending on your physical location on the earth. In the Pacific Northwest, declination ranges from 12 degrees east in eastern Idaho to 17 degrees east in northwest Washington. You can find the precise declination for your area by visiting the National Oceanic and Atmospheric Administration’s National Center for Environmental Information.
Table 1: Online resources
Commonly used digital maps, websites, libraries, datasets and apps
Digital data with special features and links
Satellite and aerial imagery; 3D images; searchable, historic photos;, measure distances and area; drawing tools.
Soil data and associated information. Download soils reports, set and print maps to scale. Aerial photo base map imagery.
(see App version below):
County tax Lots
Tax lot parcel and planning data. Search for tax lots using street address or latitude and longitude coordinates. Some counties provide a mapping interface with a variety of planning data layers. Availability of features varies by county.
Oregon tax lots
Washington tax lots
Idaho tax lots
Digital libraries and data sets
The following sites provide a variety of aerial imagery, topographic maps and additional data and features.
Aerial imagery, geographic data, map viewer.
Oregon Geospatial Enterprise Office
Links to free spatial data.
University of Oregon map collection
Oregon Department of Geology and Mineral Industries
LiDAR coverage where available.
Atlas of the Pacific Northwest
Geographic data and historical maps for Oregon, Washington and Idaho.
Aerial imagery, geographic data and topographic maps.
Links to free spatial data.
University of Idaho map collection
Washington Geospatial Open Data
Aerial imagery, geographic data and topographic maps.
University of Washington map collection
Aerial imagery, geographic data and topographic maps. Map viewer allows users to draw and measure distance and area, and obtain topographic profile data.
Topographic map database with several file formats including a GeoTIFF format that is georeferenced for use with GIS and true scale for printing.
National Geographic Trail Maps
Downloadable USGS 7.5-minute quad maps. Print out a map to scale on four letter-sized sheets of paper.
Downloadable topographic terrain and imagery, among other mapping layers. Download georeferenced PDF format for use in mapping apps such as Avenza Maps.
Provides a range of imagery, topographic and data resource layers on a map viewer that allows the user to draw and save stands and explore forest management alternatives. Requires users to create an account.
Applications (apps) for smartphones and tablets
This is a short list of commonly used apps for mapping. We recommend that users upload maps from a trusted app store or website.
Available as a default on many smartphones.
Download maps, aerial photos and link georeferenced photos.
Design and download cruise, navigate to plots, enter data.
GPS-based soil information for the location of the user created by the USDA’s Natural Resource Conservation Service and the University of California, Davis Soil Resource Laboratory.
About the authors


© 2020 Published and distributed in furtherance of the Acts of Congress of May 8 and June 30, 1914, by the Oregon State University Extension Service, Washington State University Extension, University of Idaho Extension and the U.S. Department of Agriculture cooperating. The three participating Extension services offer educational programs, activities and materials without discrimination on the basis of race, color, national origin, religion, sex, gender identity (including gender expression), sexual orientation, disability, age, marital status, familial/ parental status, income derived from a public assistance program, political beliefs, genetic information, veteran’s status, reprisal or retaliation for prior civil rights activity. (Not all prohibited bases apply to all programs.)