Contents
- Cranberry production statistics
- Methods
- Overall crop yield losses
- Acreage infested and treated, by pest
- Costs of chemical management by pest species
- Costs of other pest management activities
- Pesticide use
- Overall economic impacts
- Appendix 1. Equations
- Appendix 2. Cranberry pest species included in the survey
- Appendix 3. Survey question outline
This report presents data from Oregon State University’s Crop Pest Losses Impact Assessment program, a collaboration between Oregon State University’s Oregon IPM Center, the University of Arizona’s Arizona Pest Management Center, the Western IPM Center and industry partners. The program facilitates the collection of real-world data on the impacts of invertebrates, diseases, weeds and other pests on a crop production system.
Improving our understanding of crop yield losses and the factors that contribute to them is critical to improving agricultural production and increasing food security. Quantitative data on pest impacts are limited, and estimating crop losses is challenging. However, quantifiable measurements of pest pressure, pesticide use, costs, yield and quality losses due to pests are our most objective tools for assessing integrated pest management status, and general progress in agriculture. These data are also valuable in supporting IPM evaluation and needs assessment, in setting priorities, in education and for informing federal decision-making, including the US Environmental Protection Agency’s pesticide registration and review process. In particular, assessments of crop losses that occur despite all of the crop protection strategies deployed are critical for identifying research and Extension needs, and improving pest management decision-making.
We have designed a detailed survey based on multidisciplinary expertise in our centers, using methods perfected over decades of research at the University of Arizona. This instrument aims to capture information from commodity group pest managers (generally crop consultants) and growers on the impacts of pests, including yield losses and pest management costs, across a number of key Oregon and Washington commodities. In this case, the crop is cranberries in Oregon and Washington. We hope that these data can inform pest-management decision-making and IPM advances, especially when collected regularly over time.
This report summarizes data collected for Oregon and Washington cranberries. It is targeted at cranberry researchers, Extension workers and crop consultants, and others interested in crop losses, and in the development and deployment of IPM.
Cranberry production statistics
According to the National Agricultural Statistics Service, Oregon and Washington accounted for 10.6% of the acreage planted with cranberries in the United States. Of the 4,400 cranberry acres harvested in this region, approximately 2,800 were in Oregon, and 1,600 were in Washington. The annual value of the 2016 cranberry crop in Oregon and Washington combined was $18.2 million. In 2016, an average of 140.7 barrels per acre were produced in Oregon, with $26.50 received per barrel. An average of 109.4 barrels per acre were produced in Washington, with $44.20 received per barrel. (Note: One barrel of cranberries is equivalent to 100 pounds).
Methods
Materials
The data in this report are based on a survey conducted in March 2017 with seven crop consultants reporting on 2016 cranberry production. The Oregon IPM Center generated data using a spreadsheet-based survey tool modeled after the Arizona Cotton Insect Losses survey that allows for multiple levels of response validation. Respondents completed surveys at an in-person group session. Respondents used iPads provided by Oregon State University to complete the survey, which took approximately two hours.
The survey was divided into multiple sections relating to both pests and pest management (Appendix 3). In the first section of the survey, respondents estimated the price received per pound of cranberries, their actual yields in pounds and their maximum attainable yields. This initial estimate measures overall yield loss (the difference between the reported actual yield vs. the maximum attainable yield). Respondents were then asked to attribute yield loss to various general categories, both biotic and abiotic.
In subsequent parts of the survey, respondents refined yield loss estimates for specific pests and pest-by-pest information on acreage where the pest was present. Respondents chose specific pests from a predetermined list (Appendix 2) and were given the option to write in pests that were not represented. They also approximated costs of management. Finally, respondents estimated pesticide use by active ingredient (acreage, number of applications and costs), as well as utilization and costs of nonchemical management methods. See Appendix 3 for a more detailed outline of survey questions.
Respondents
Seven respondents representing 2,988 acres, or 68% of the 4,400 cranberry acres in Oregon and Washington, completed the survey in March 2017, reporting on the 2016 season. All respondents were cranberry growers and crop scientists, recruited with the help of the local grower associations, and both Washington State University and Oregon State University faculty. Their role in crop production ranged from advising on pest management to managing and gaining profit or salary from the represented acres. The share of total survey acreage under an individual respondent’s management ranged from 0.2% to 23% of the surveyed acres. This report only covers conventionally grown cranberries, and includes no data or analysis on organically grown cranberries.
Design
This is descriptive research that seeks to understand and quantitatively describe the impacts of pests and their management on cranberry production in Oregon and Washington. It is intended to be part of a sequence of annual surveys that can reveal trends and responses to change over time.
Analysis
Respondent data were analyzed using specific formulae that allowed us to investigate the information gathered and derive output useful for crop management decision-makers. The analytical formulae are detailed in Appendix 1. While we could perform many possible analyses on these data, we focused on those that would shed light on the impacts of pests, and on the effectiveness and costs of management.
Overall crop yield losses
Actual yield, maximum attainable yield and price
In the first part of the survey, respondents were asked to estimate the average price received per pound of cranberries, and the average actual yield from their managed acreage. They were also asked to estimate the “maximum attainable yield” per acre by estimating the highest possible yield. This assumes ideal growing conditions and no pest pressure, within the general constraints of varieties grown, weather and local geography.
Table 1. Average price received per pound of cranberry per acre, average actual yield in pounds per acre, and average maximum attainable yield in pounds per acre
Actual yield and maximum attainable yield are expressed as weighted averages (Equation 2, Appendix 1). Based on reported data from all seven respondents.
- Actual yield: 11,904 lb/acre
- Maximum attainable yield: 18,970 lb/acre
- Yield loss estimates: 37%
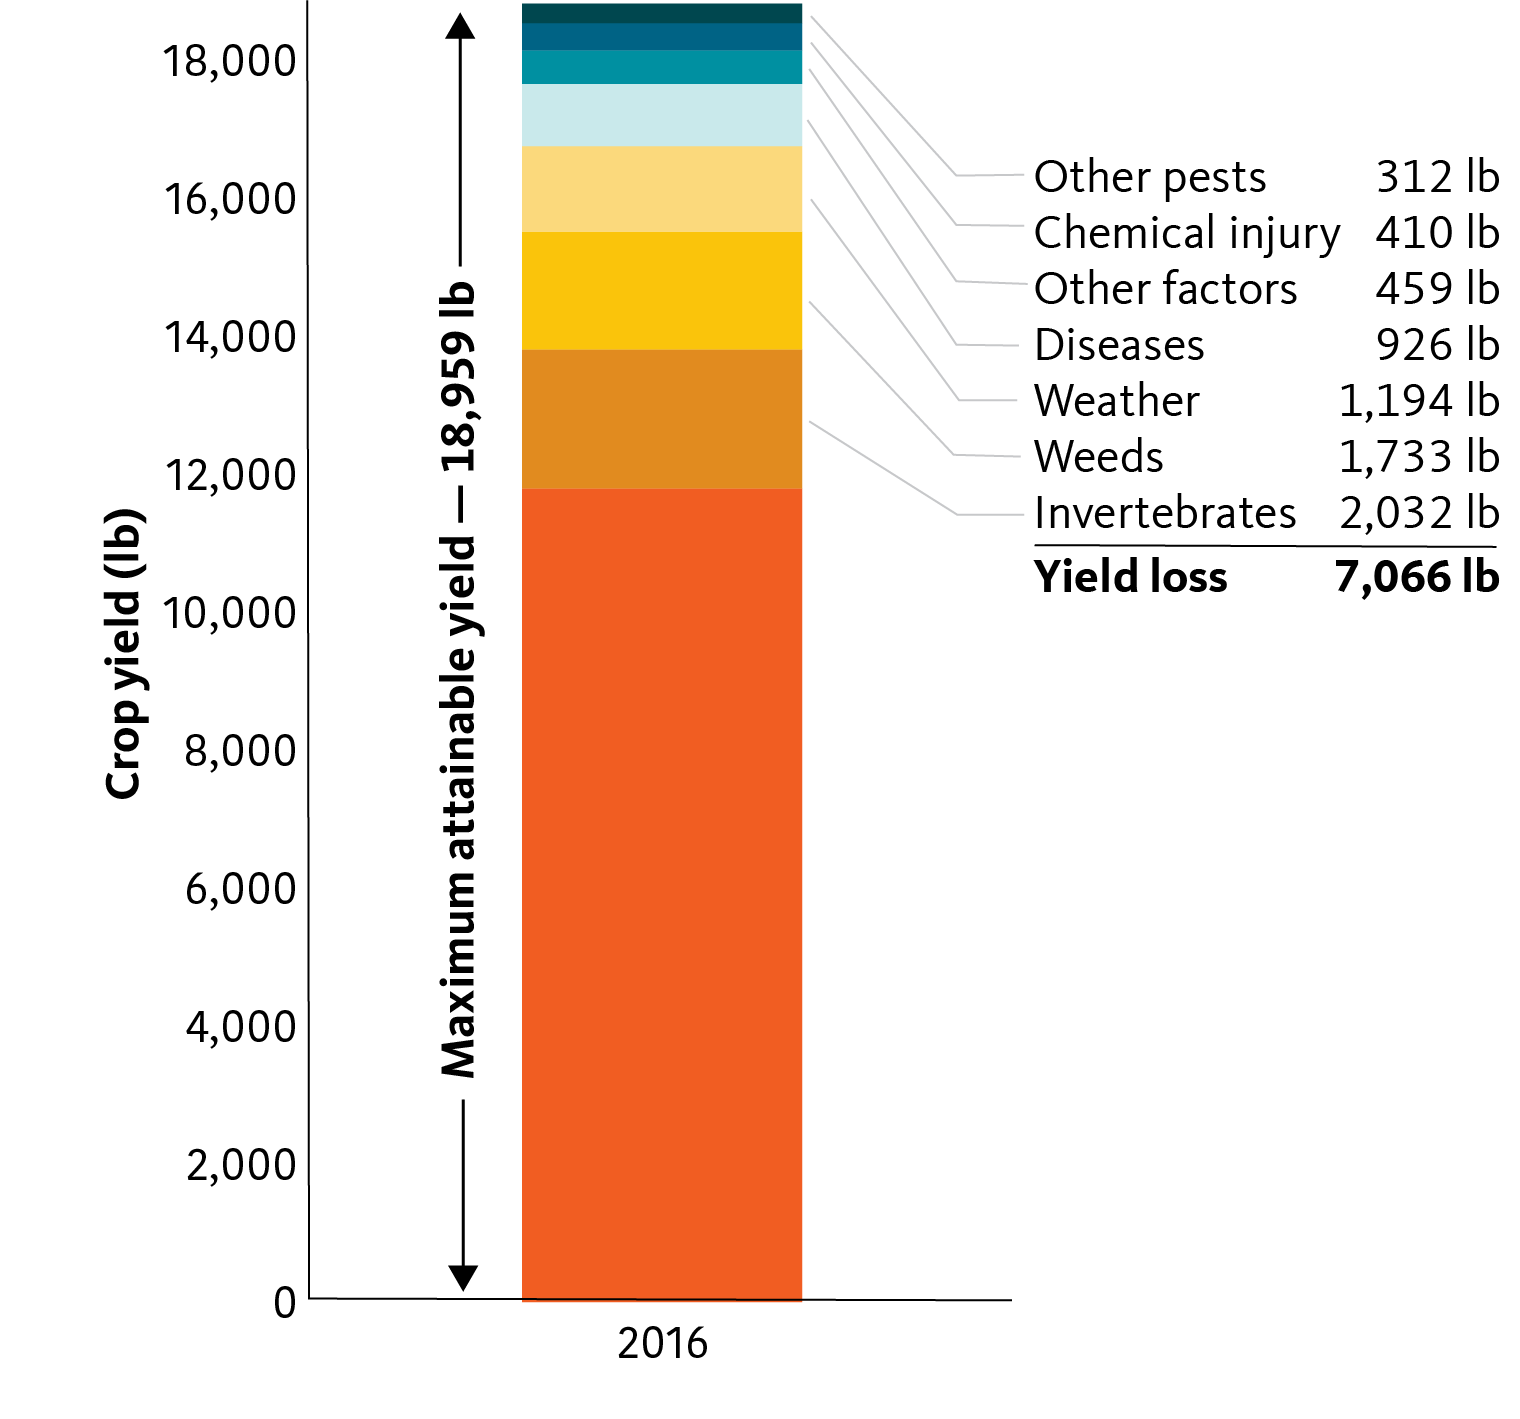
Our respondents estimated that the average acre of cranberries in Oregon and Washington can generate 18,970 lb, or 189.7 barrels (Table 1). Using these 2016 prices, we multiplied this estimate by the average price received per lb ($0.34) to estimate that an acre of cranberries can generate $6,449 under ideal growing conditions, perfect management, and zero pest pressure. The actual yield was 11,904 lb/acre, on average — a 7,066 lb ($2,401) difference.
The difference between respondent estimates of actual and maximum attainable yields represents the overall yield loss experienced. Using this estimation method, the average rate of yield loss estimated across surveyed cranberry acres was 37% (Table 1).
Impact categories
Crop yield losses can be attributed to a combination of factors, including pest pressure, management issues and environmental conditions.
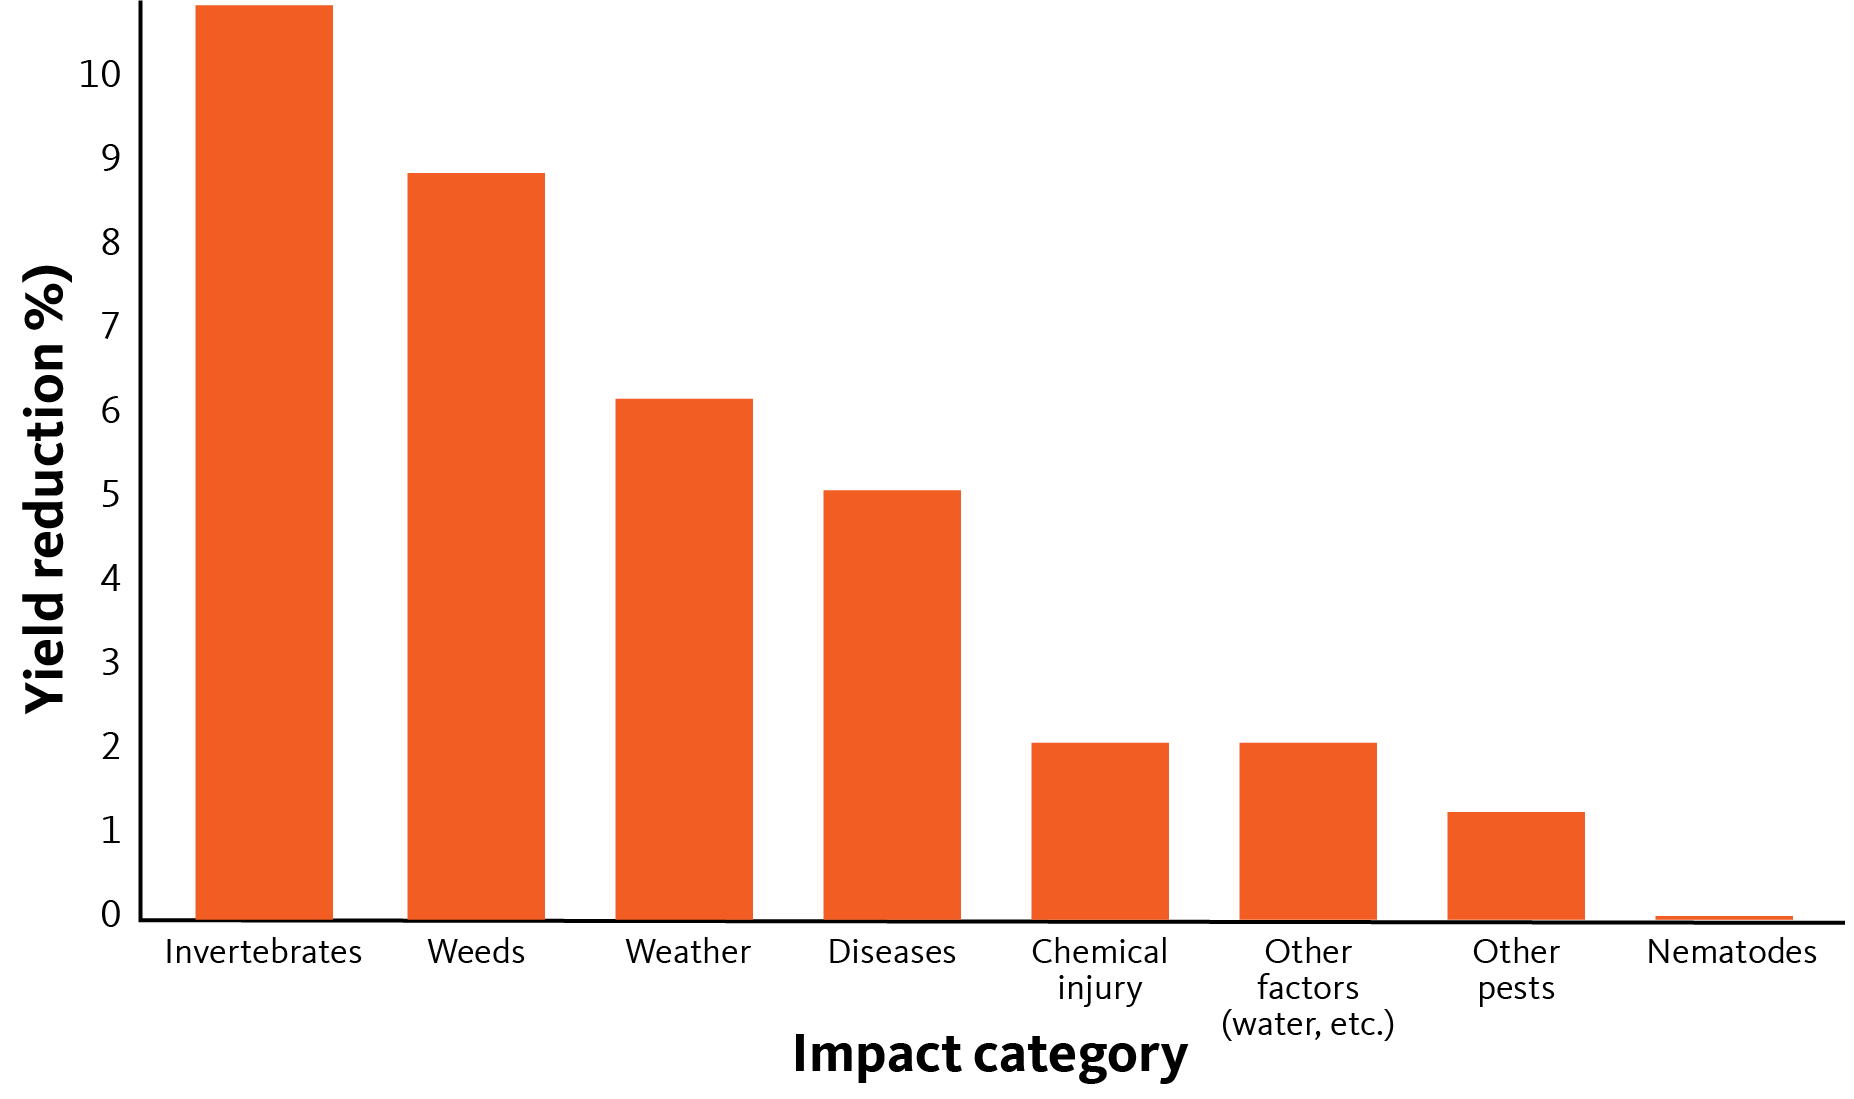
In the second part of the survey, respondents were asked to attribute their estimated overall yield loss to a list of biotic and abiotic yield loss categories, including damage from invertebrates, diseases and weeds, as well as impacts from weather, irrigation and other management inefficiencies. Using this estimation method, overall yield loss was estimated to be 7,066 lb/acre on average. Invertebrate pests caused the largest decline in yield at 10%, or 2,032 lb/acre, followed by weeds (1,733 lb, or 9%), weather (1,194 lb, or 6%) and diseases (926 lb, or 5%) (Figures 1 and 2).
Note: Not all survey respondents experience all possible pests, which leads to variation in “n” throughout some of the figures in this report. Averages for acreage where the pest was present include, for example, only the data for those respondents who reported specific pests, pesticides or management actions. Our averages across all survey acreage include all responses, including those with nothing to report for certain pests or management, whose response is assumed to be zero (in terms of yield losses and management costs).
Yield loss and economic value by pest species
Within the biotic yield loss categories of invertebrate pests, diseases and weeds, respondents were asked to break down their estimates even further, by reporting average percent yield losses by pest species on acreage where the pest was present.
Growers experience these yield losses as economic losses. We can assign a dollar value to the reported losses using the average estimated price per pound reported by our survey respondents.
The following figures reveal the most economically damaging cranberry pests, overall and within each pest category (invertebrates, diseases and weeds). Within an agricultural system, this type of data can highlight priority pest issues for targeted research and education. These data can also inform the regulatory system when decisions are made about the tools available for management.
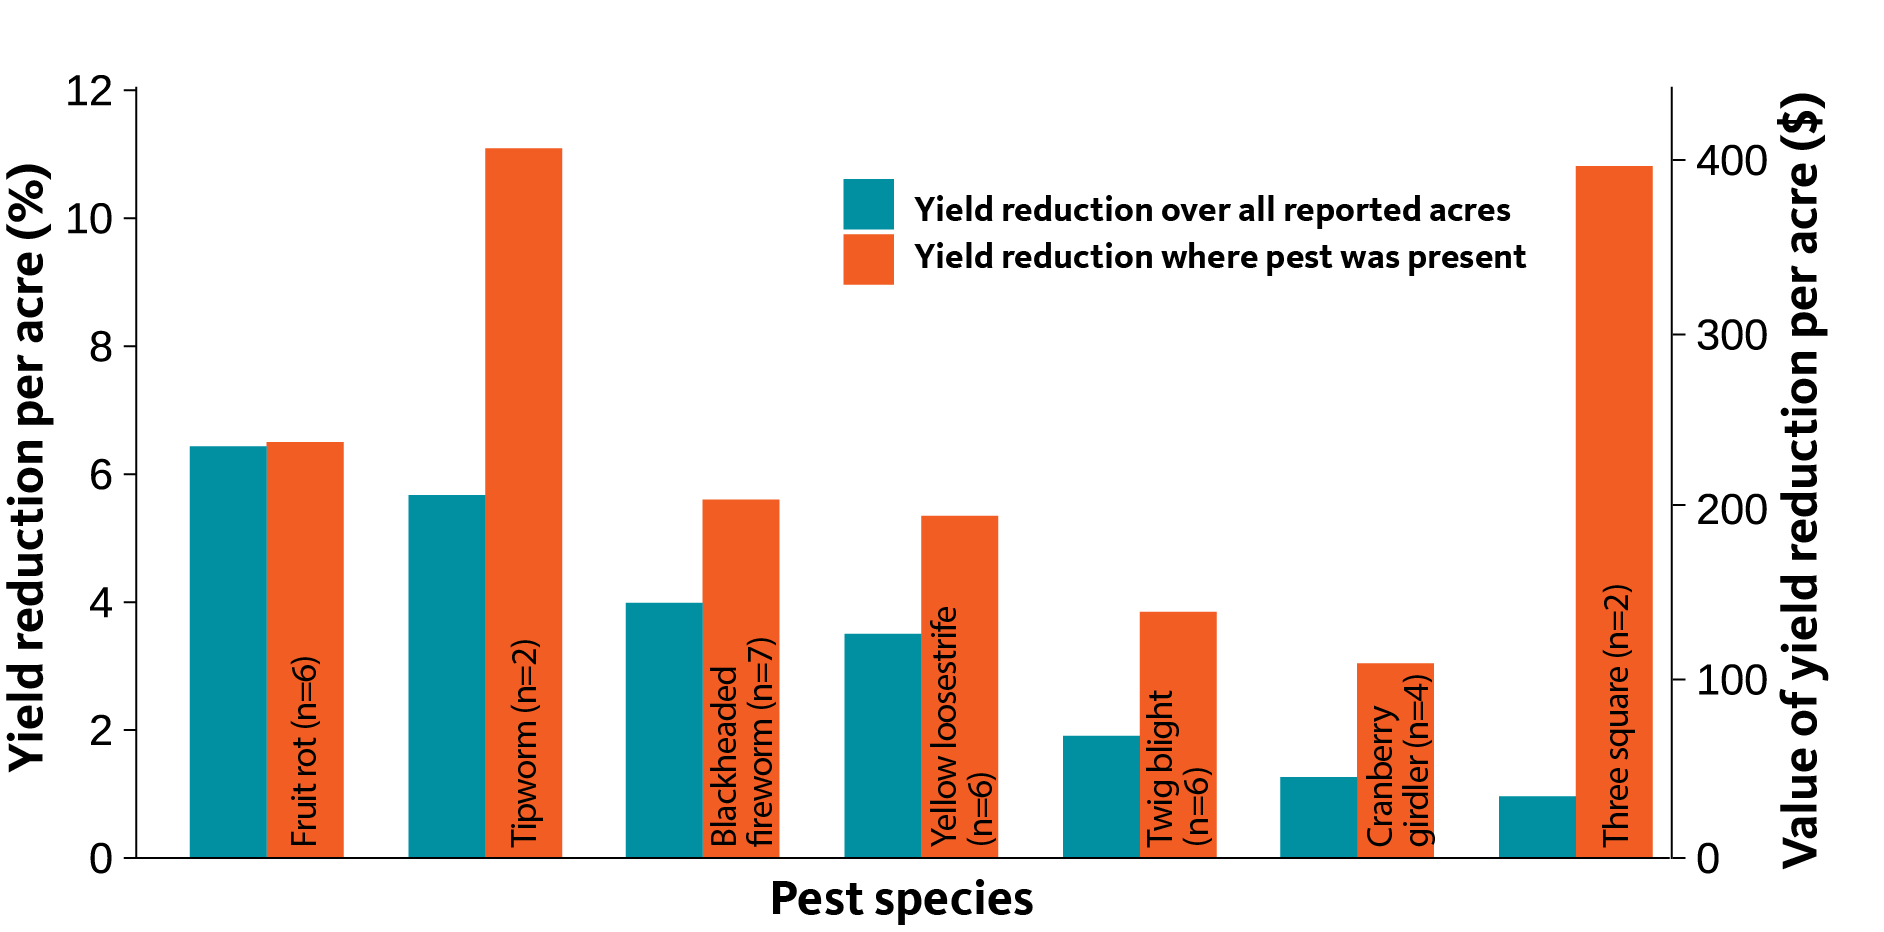
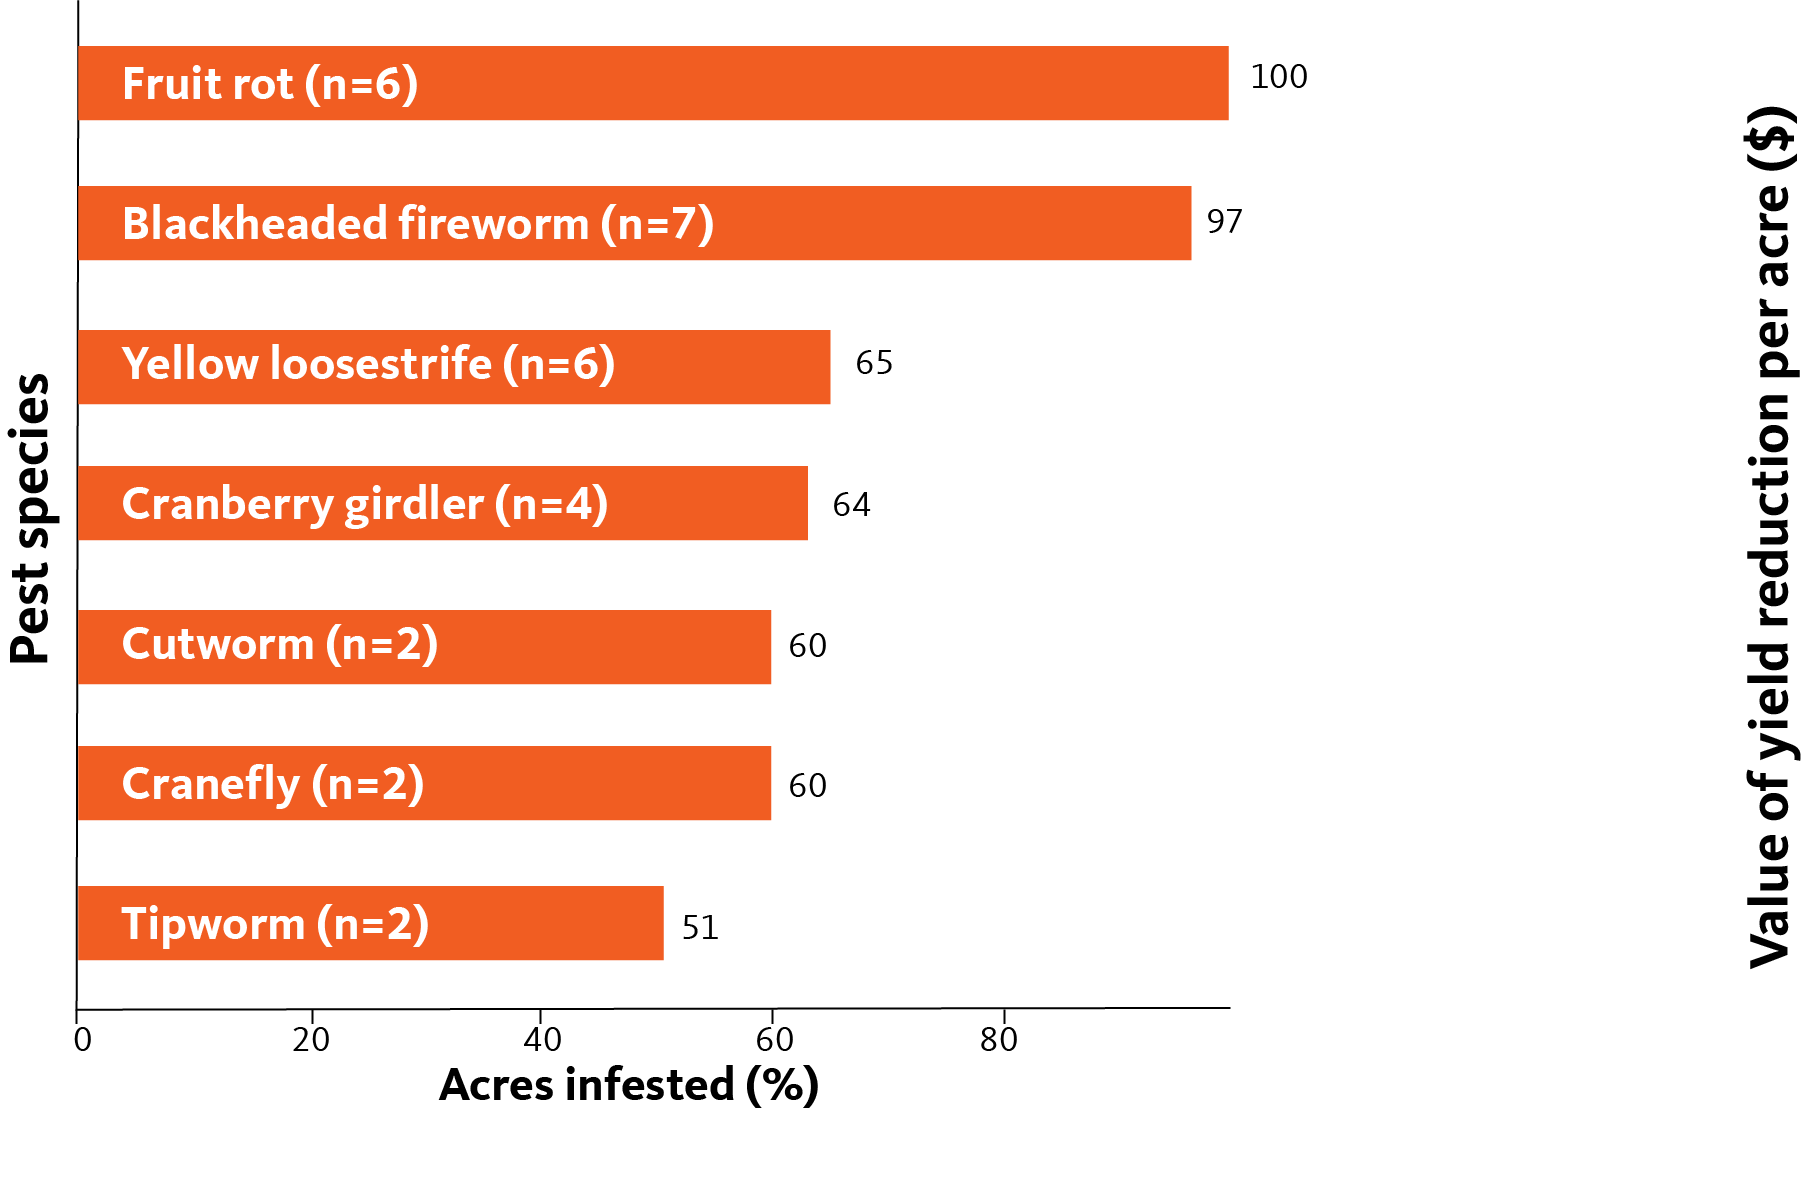
The pest reported as causing the most damage across all surveyed acreage was fruit rot, followed closely by cranberry tipworm and blackheaded fireworm (Figure 3). Any pest's economic impact may be lessened if it is not widespread. For instance, the weed three-square (Schoenoplectus americanus) is reported to have caused over 6% yield loss on acreage where it was present, but because it was not widespread, was responsible for only about 1% yield loss surveywide.
Single species assessments of yield reduction
We analyzed reported impacts to yield losses pest by pest, both on acreage where the pest was present and across all reported acreage. As with the top pests above, these two scenarios differ based on the extent of infestation.
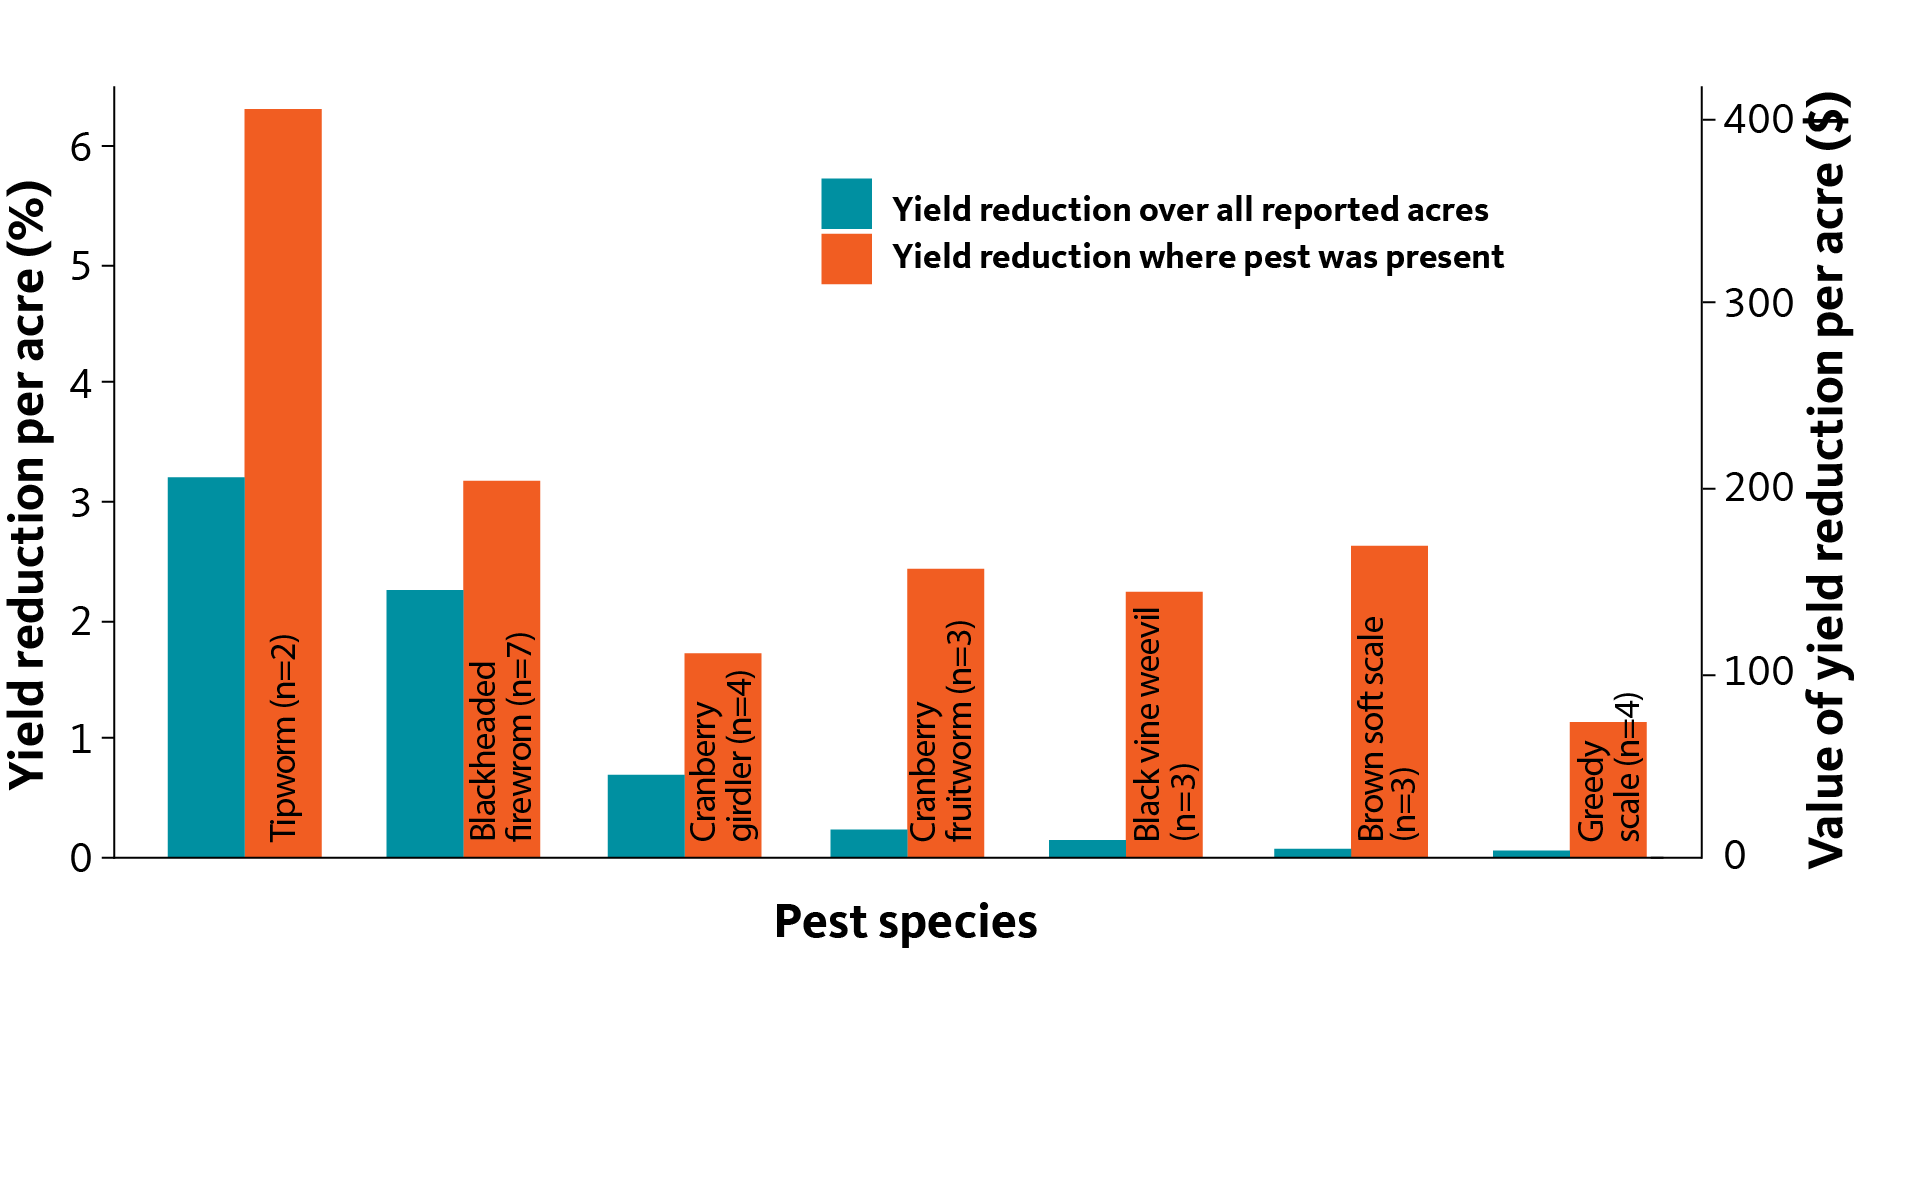
On acreage where the pest was present, cranberry tipworm was the invertebrate pest causing the highest impact to yield, but was only reported by two respondents (Figure 4).
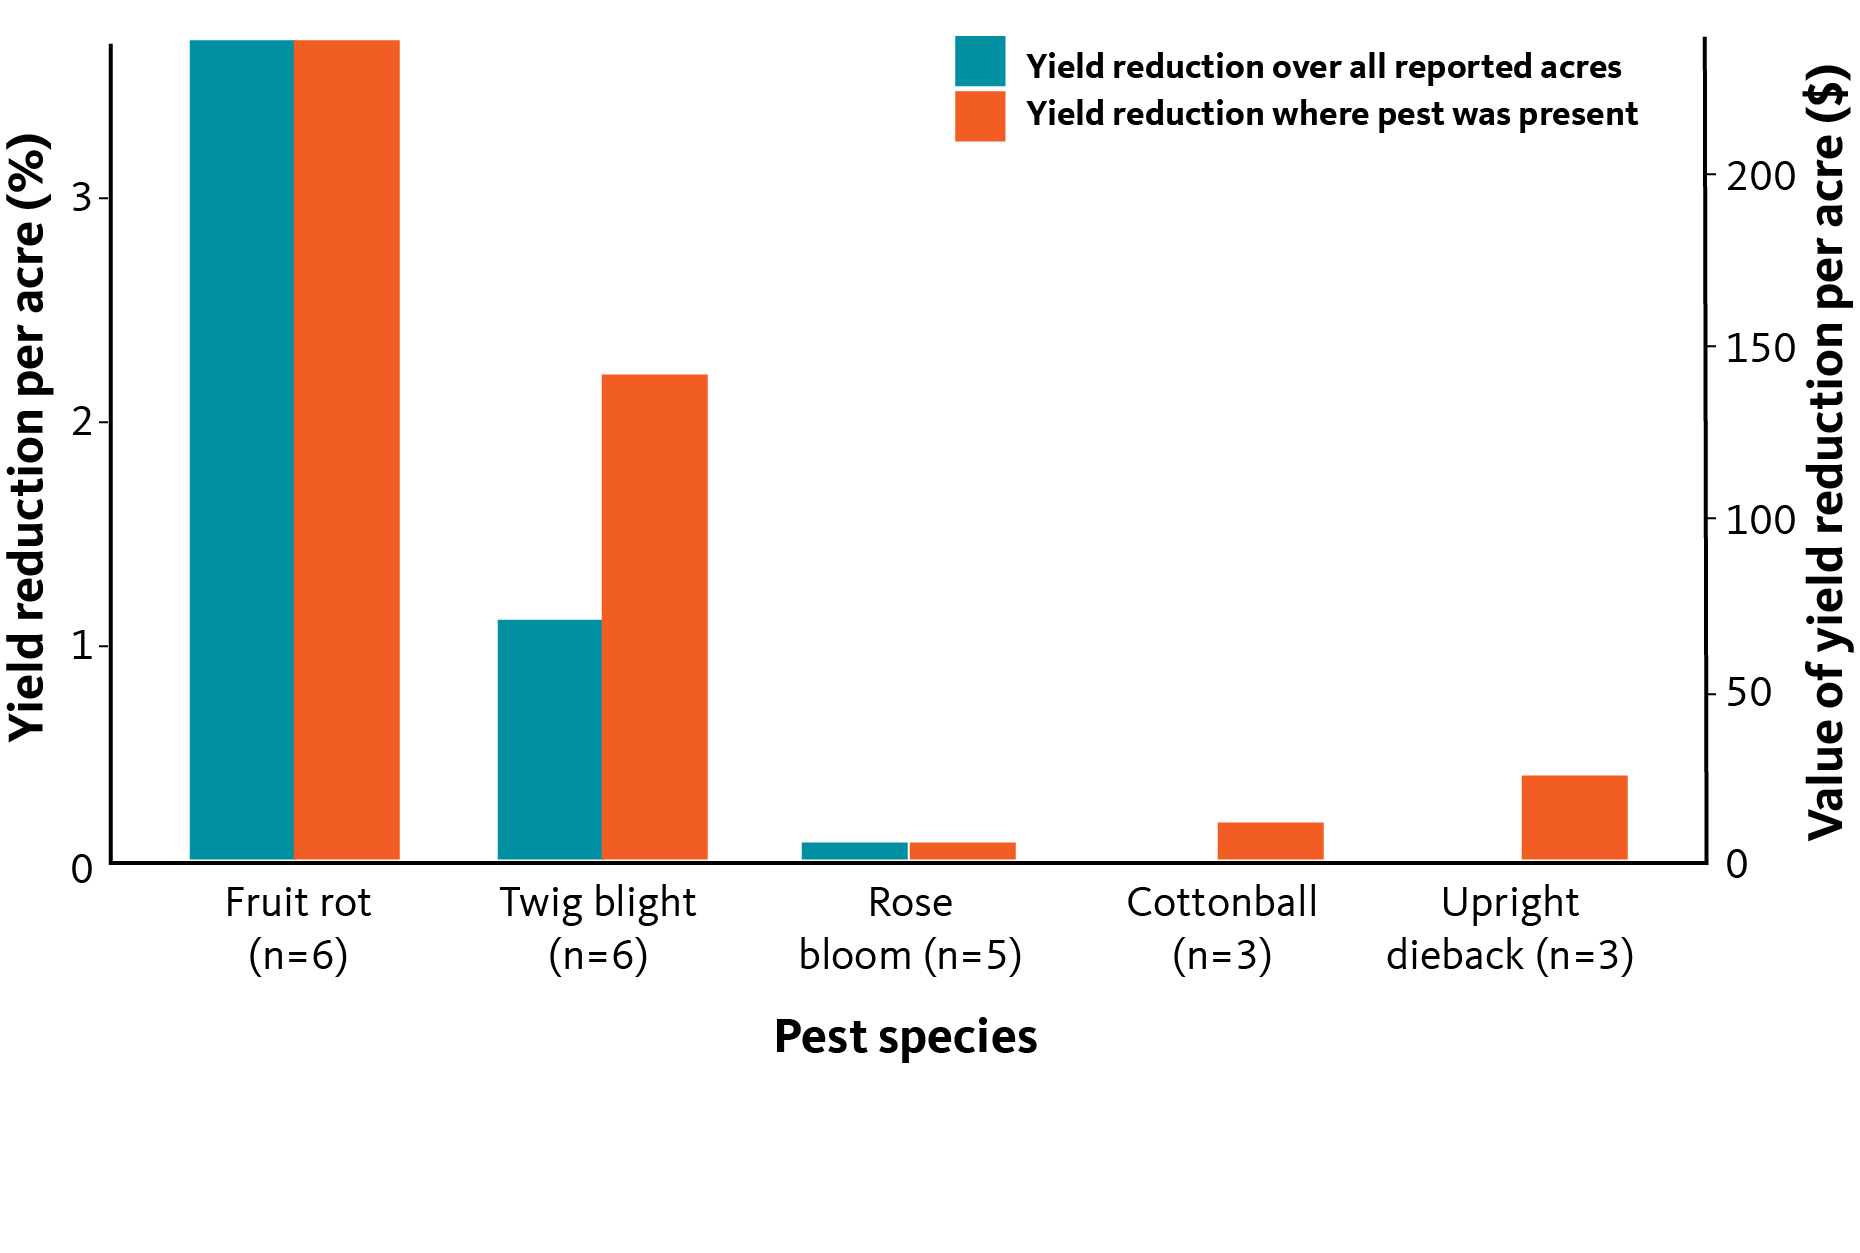
We see similar differences when analyzing losses to diseases. Fruit rot is a key pest for the Oregon and Washington cranberry industries, with respondents reporting widespread yield losses over 3% across all surveyed acreage. This is true, particularly in Washington, where growers sell fresh, dry-harvested fruit. Cranberry growers also reported yield losses of over 2% on acreage infested with twig blight (Figure 5).
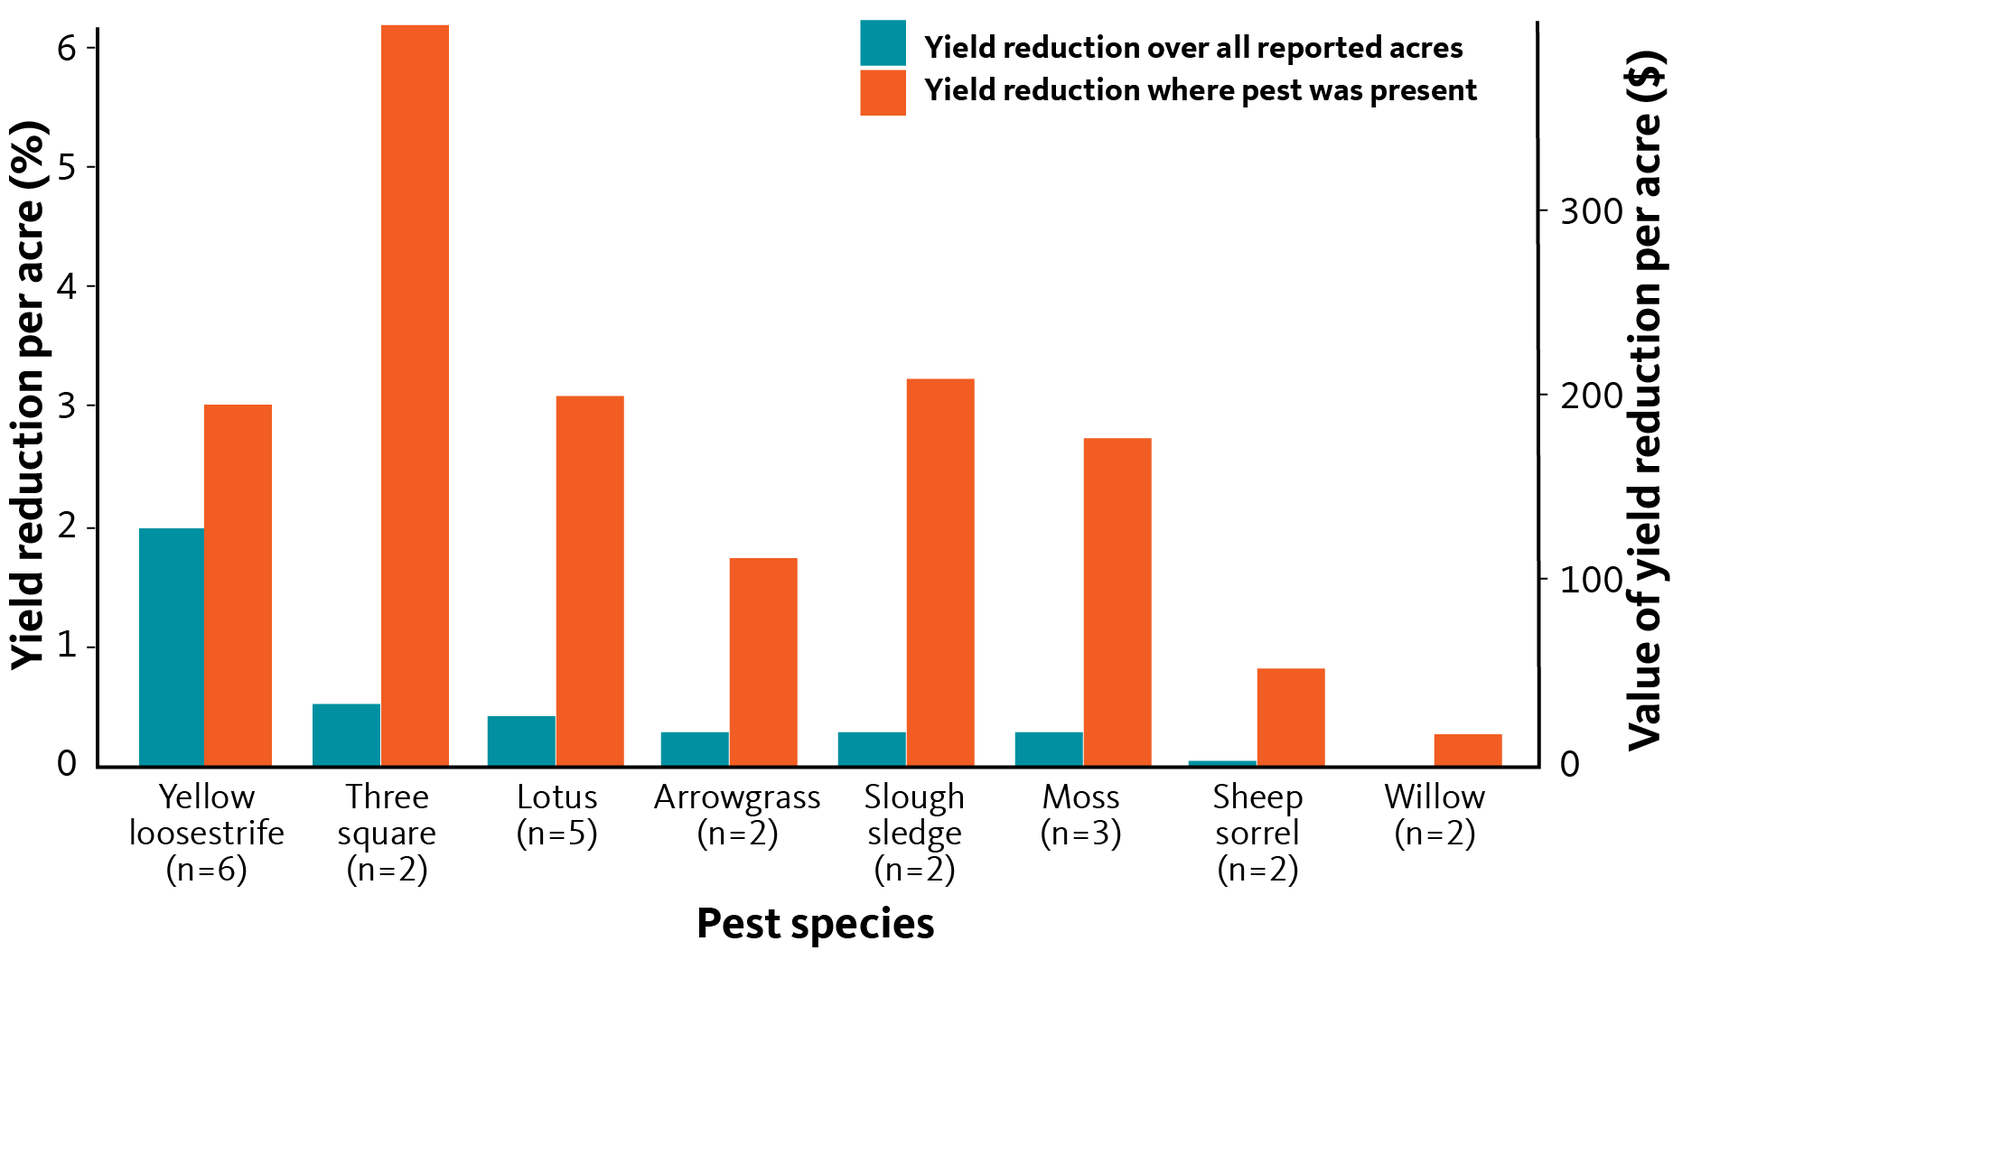
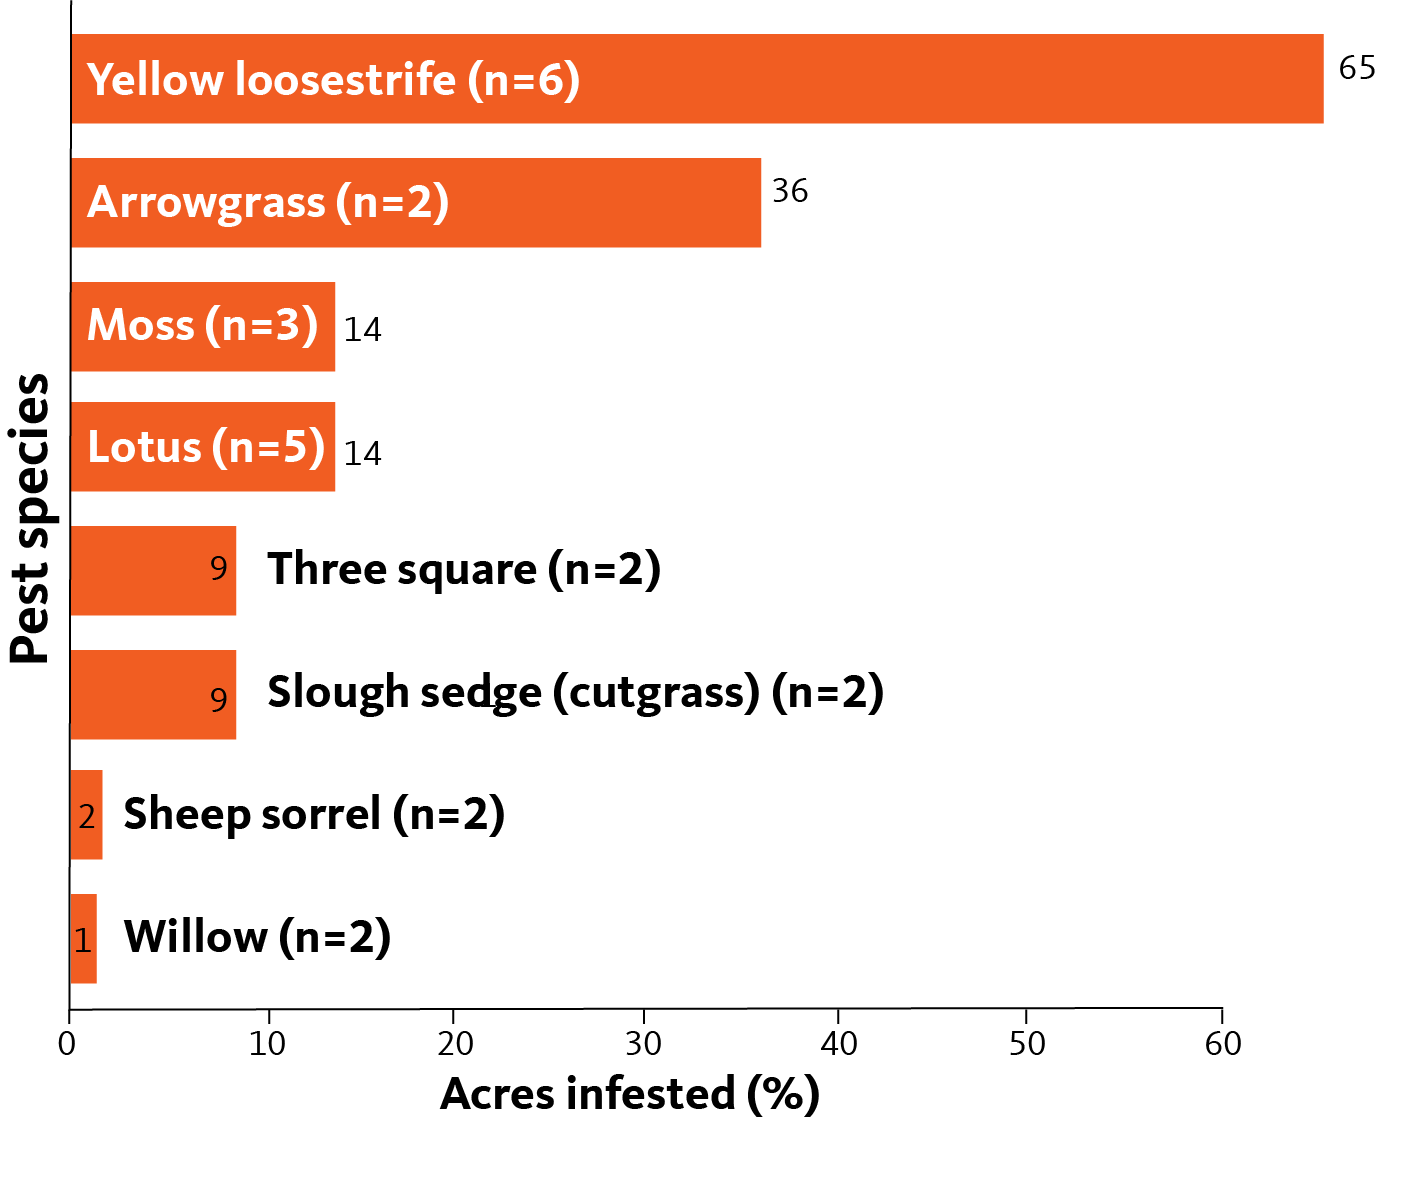
Specific yield losses caused by different weed species are more difficult to estimate. However, based on our data, yellow loosestrife (Lysimachia punctata) appears to be a key pest for the cranberry industry in Washington and Oregon because it was reported by six out of seven respondents and resulted in the highest surveywide yield loss among all weed species (Figure 6). Additional problematic weed species include three-square (Schoenoplectus americanus), lotus (Lotus corniculatus) and arrowgrass (Triglochin sp.).
Acreage infested and treated, by pest
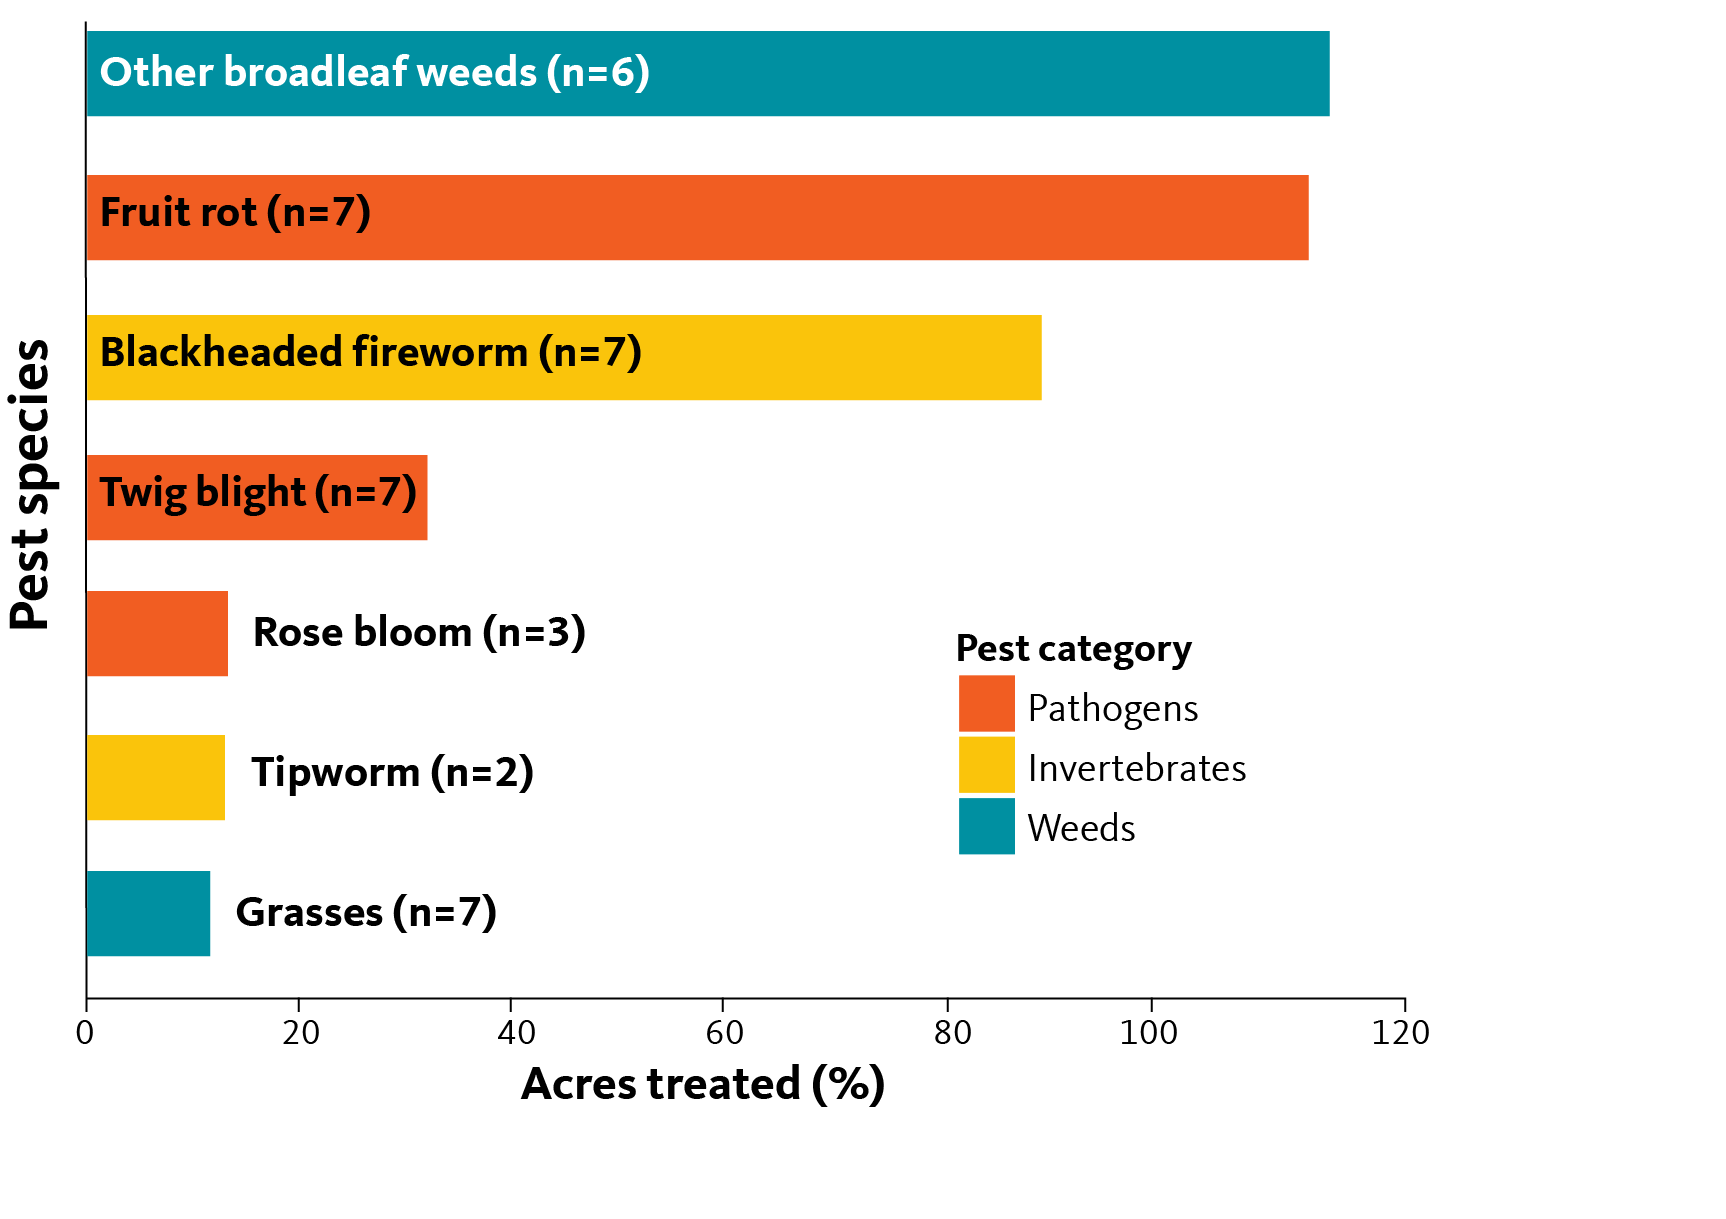
The potential for any given pest to have a significant impact across the industry depends on the yield loss it causes where it is present and the infestation level across the industry as a whole. The figures below present pests infesting over 50% of the cranberry acreage we surveyed, followed by figures showing infestation levels by all invertebrates, diseases and weeds, respectively.
At least seven pests infested more than half of the cranberry acres we surveyed, many of which caused significant losses in yield.
Pests infesting more than 50% of cranberry acreage surveyed
The figures below for invertebrates, diseases and weeds represent a more detailed presentation of these data by pest group.
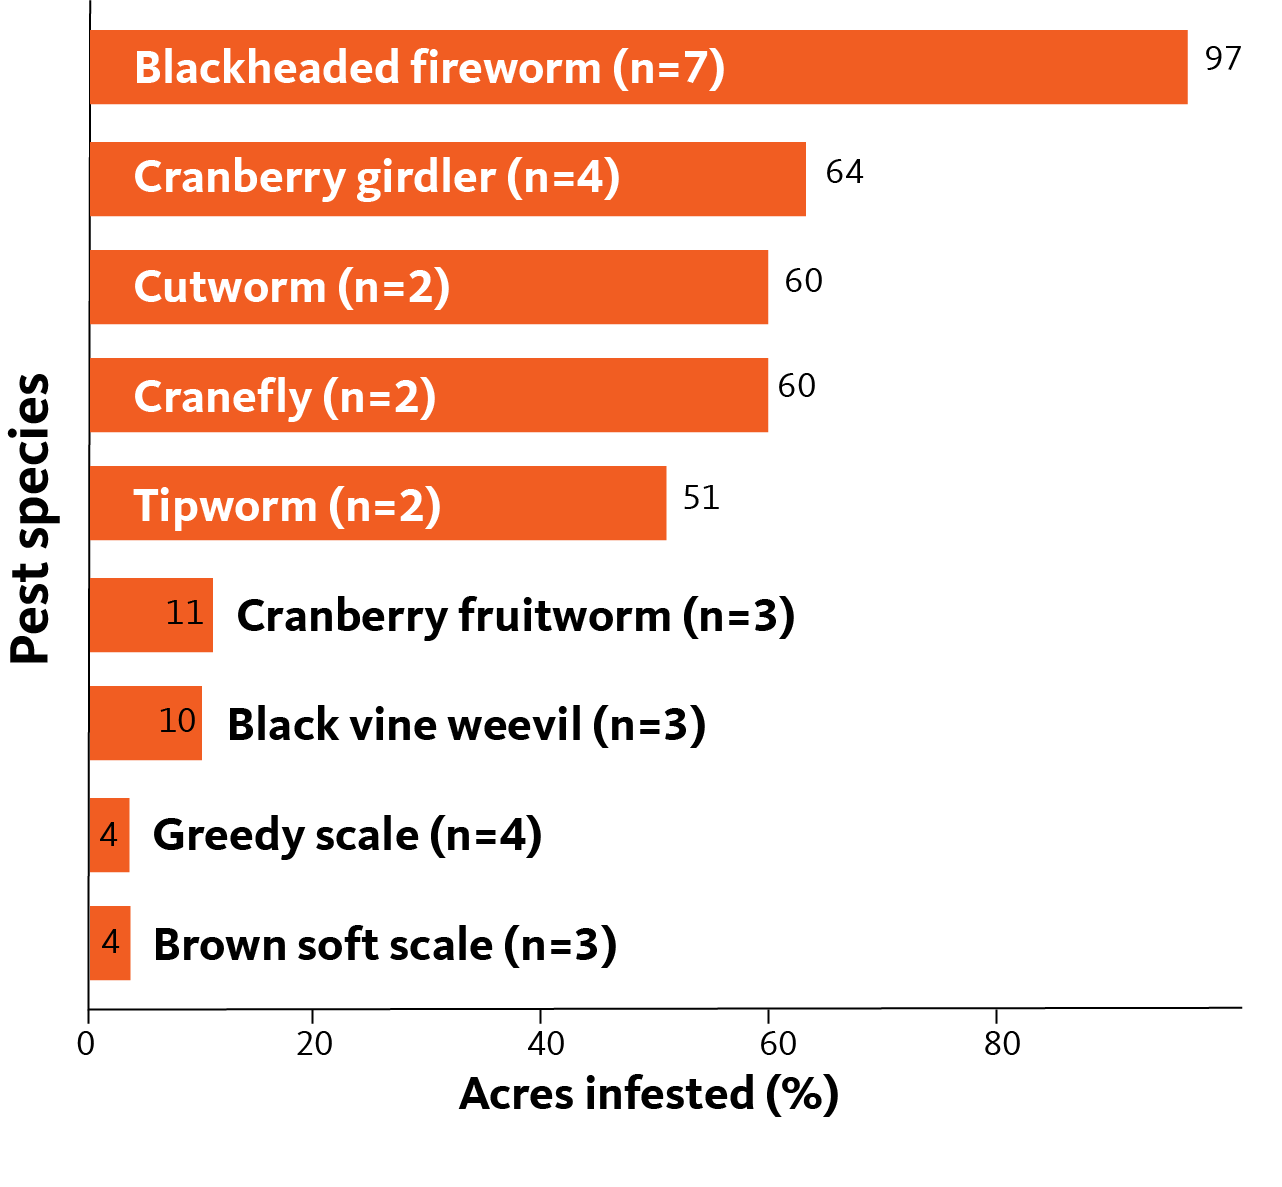
Infestation by invertebrate pests
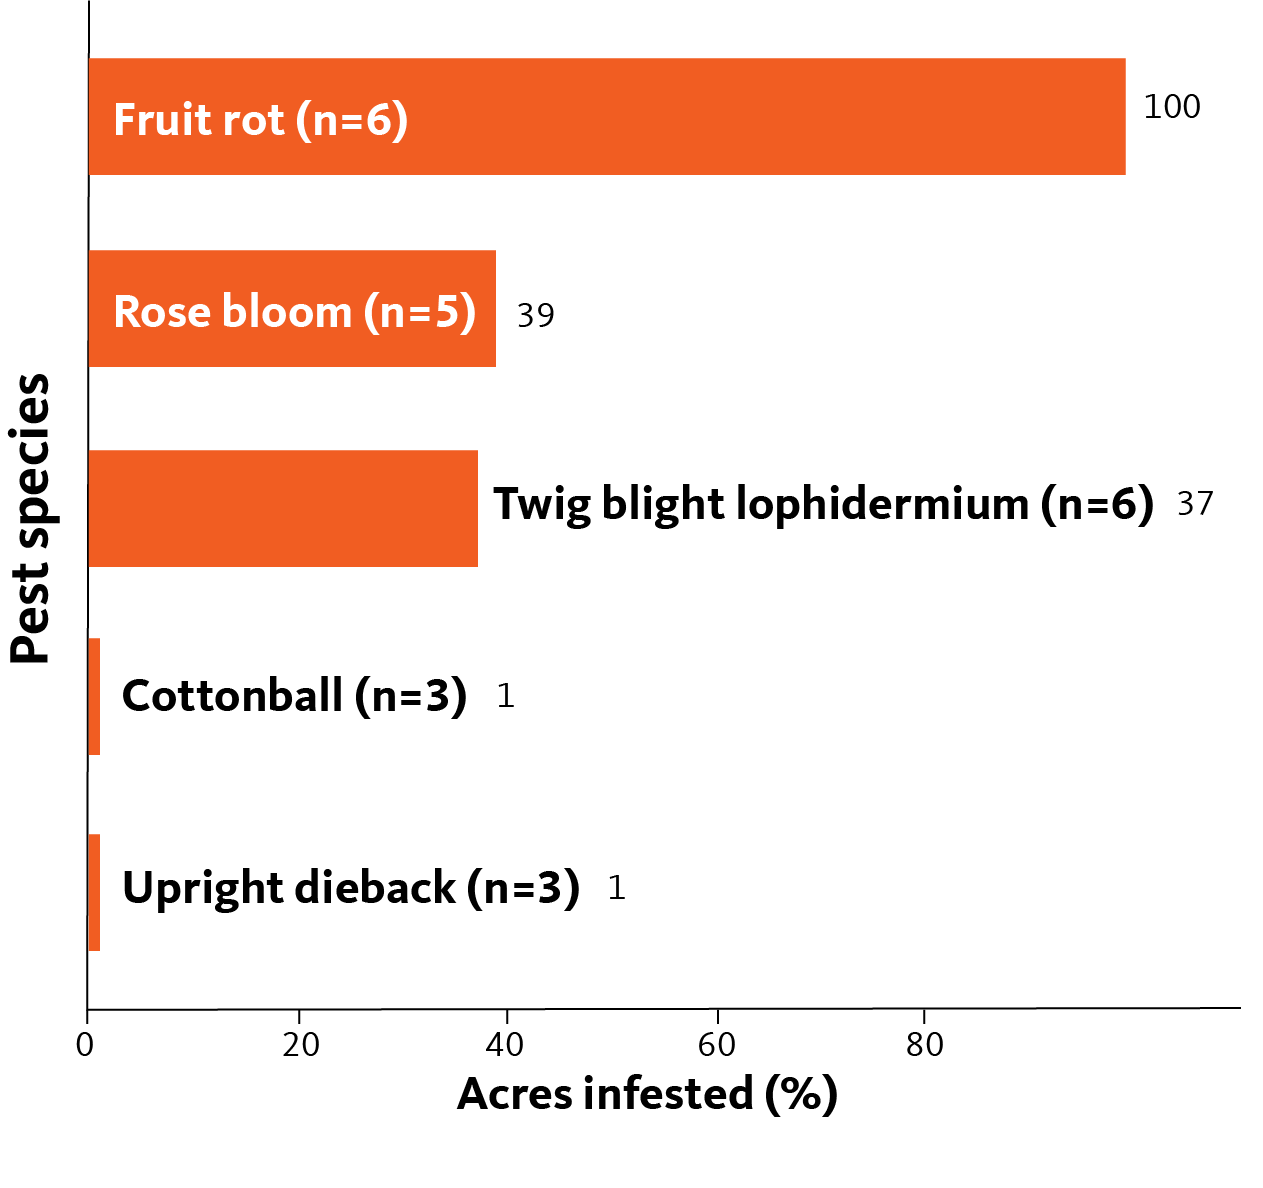
Infestation by diseases
Infestation by weeds
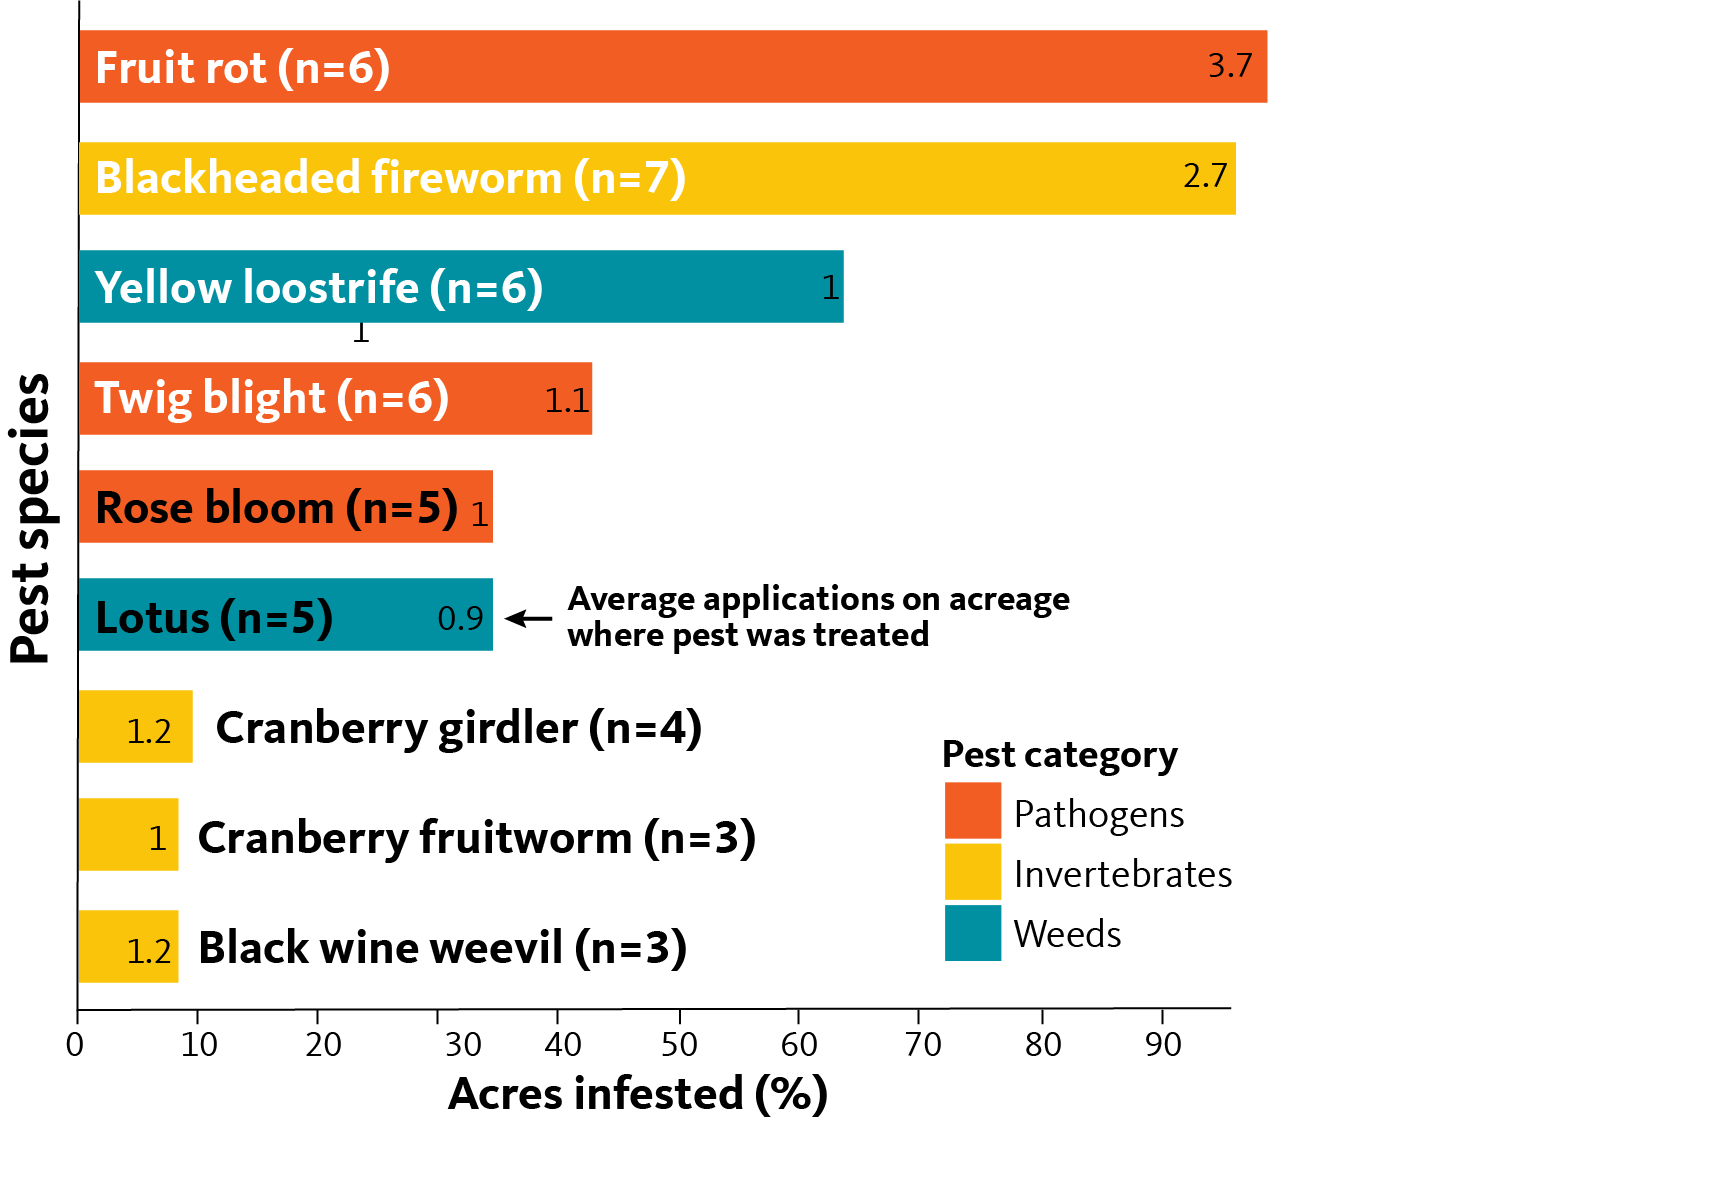
Acres treated and average number of pesticide applications on treated acres
The yield losses our respondents reported for the 2016 field season were experienced despite the management applied to help mitigate losses and manage pests. For each pest species, respondents estimated the average number of pesticide treatments used to manage the pest, as well as the average number of acres on which treatments were applied.
Figure 11 depicts the pests requiring pesticide treatment on more than 25% of survey acreage. We also include the average number of pesticide applications on these acres. These two numbers, taken together, reveal the extent of management required for a given pest, which can be calculated as “acre-treatments.” Application estimates include pesticide applications in the form of chemigation and ground applications.
These data highlight the pests requiring higher levels of input and those which drive management programs. Producers need more targeted research and Extension support to improve management efforts to control these pests, protect crops and advance IPM.
Acres treated and average number of pesticide applications targeting invertebrate pests
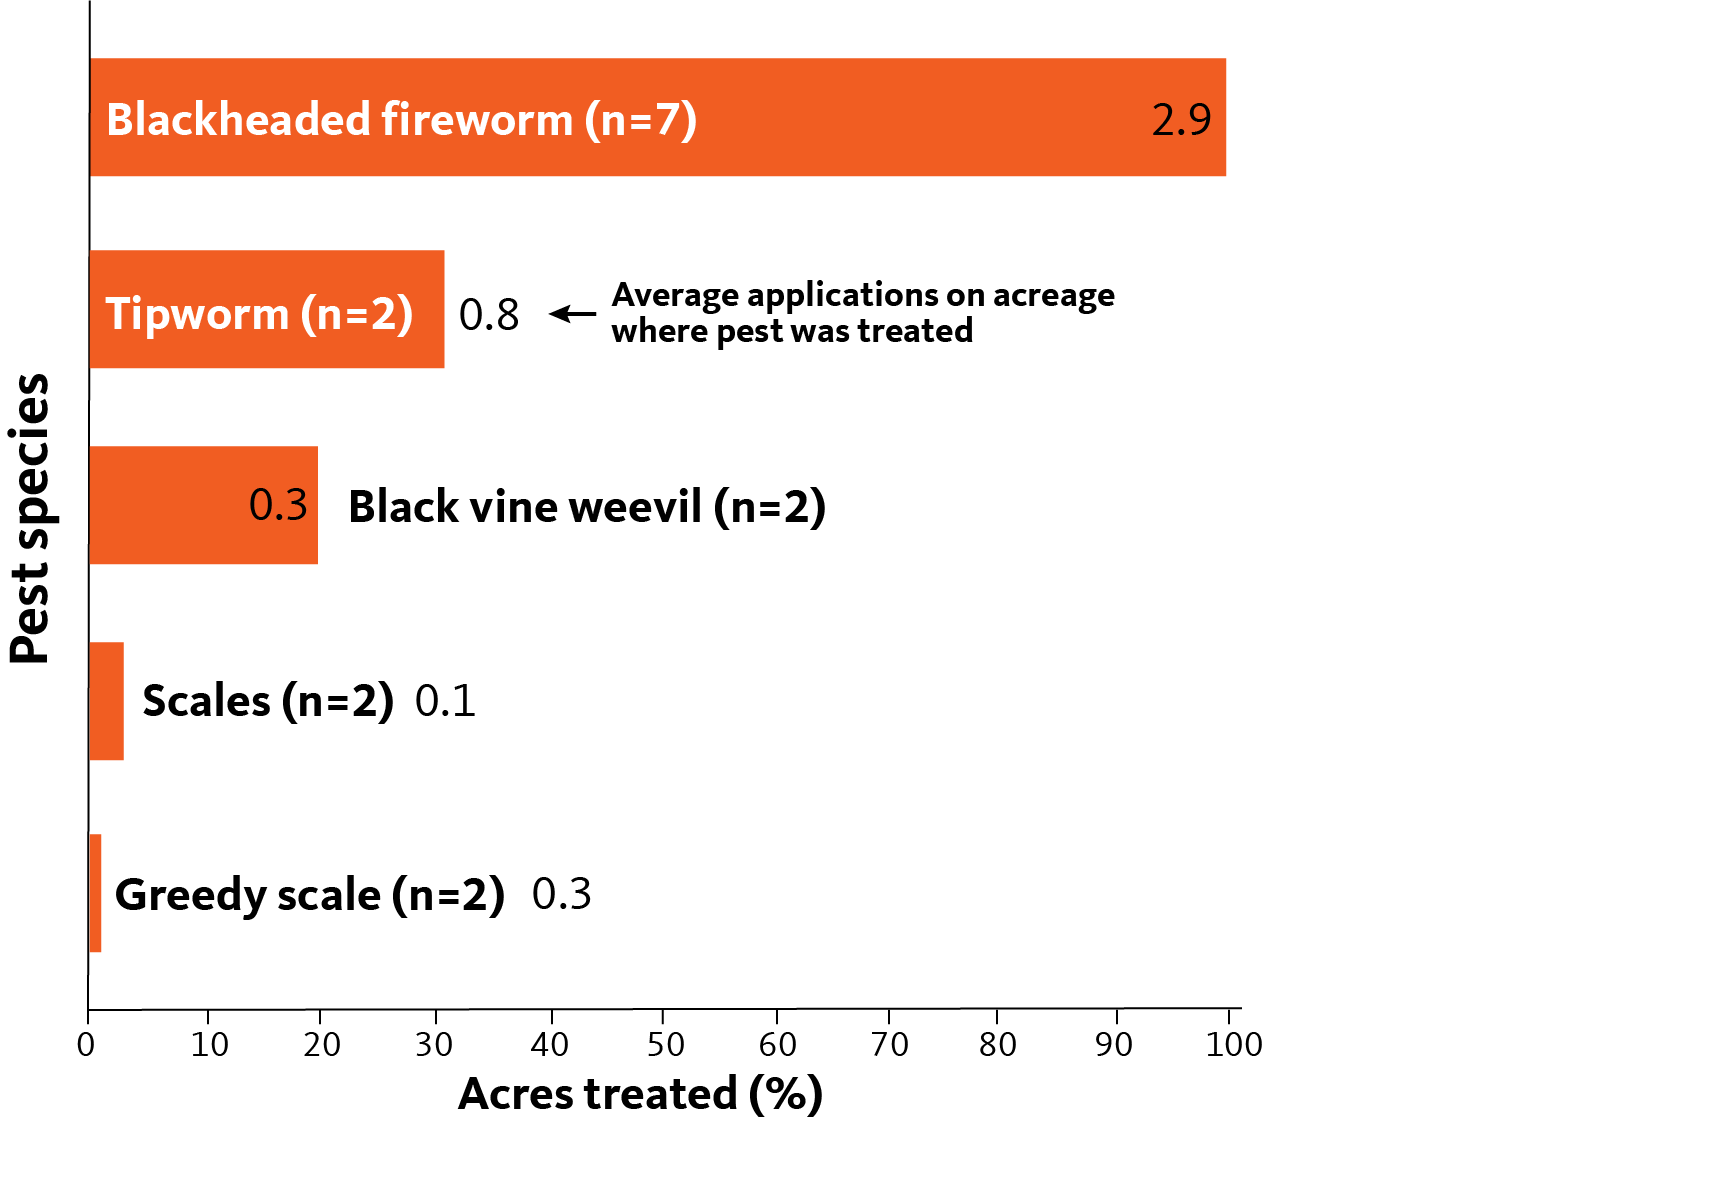
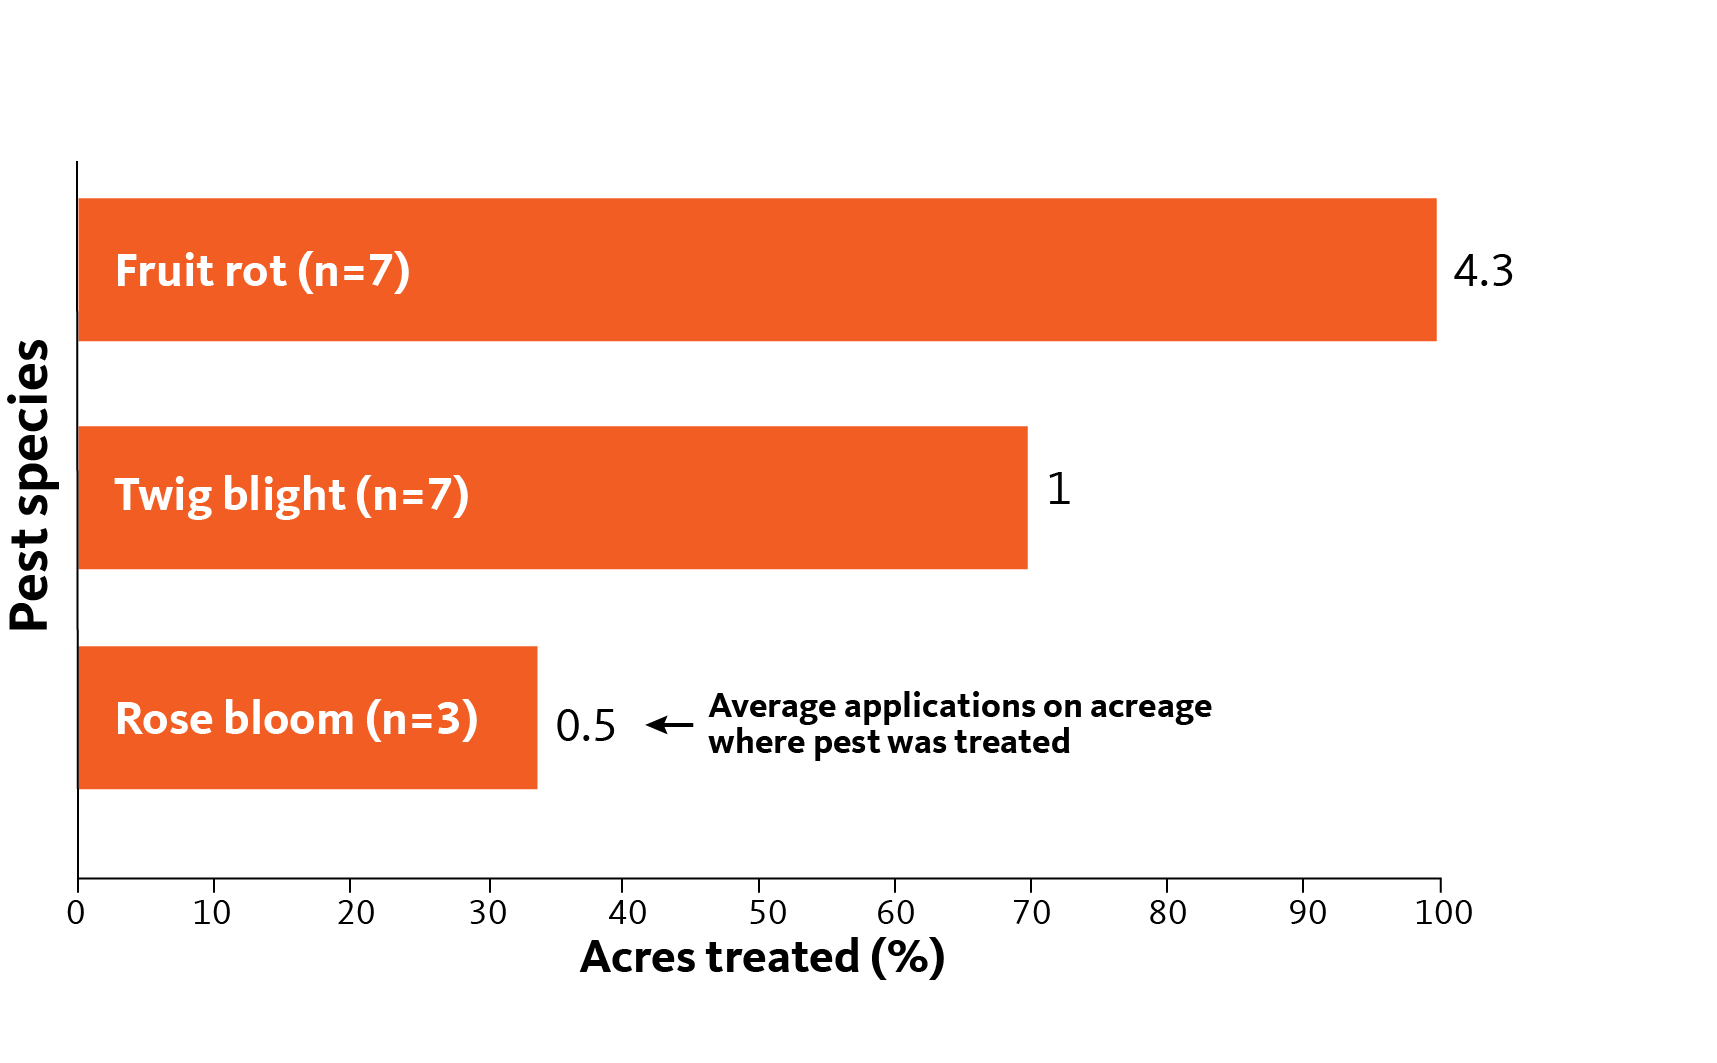
Acres treated and average number of pesticide applications targeting diseases
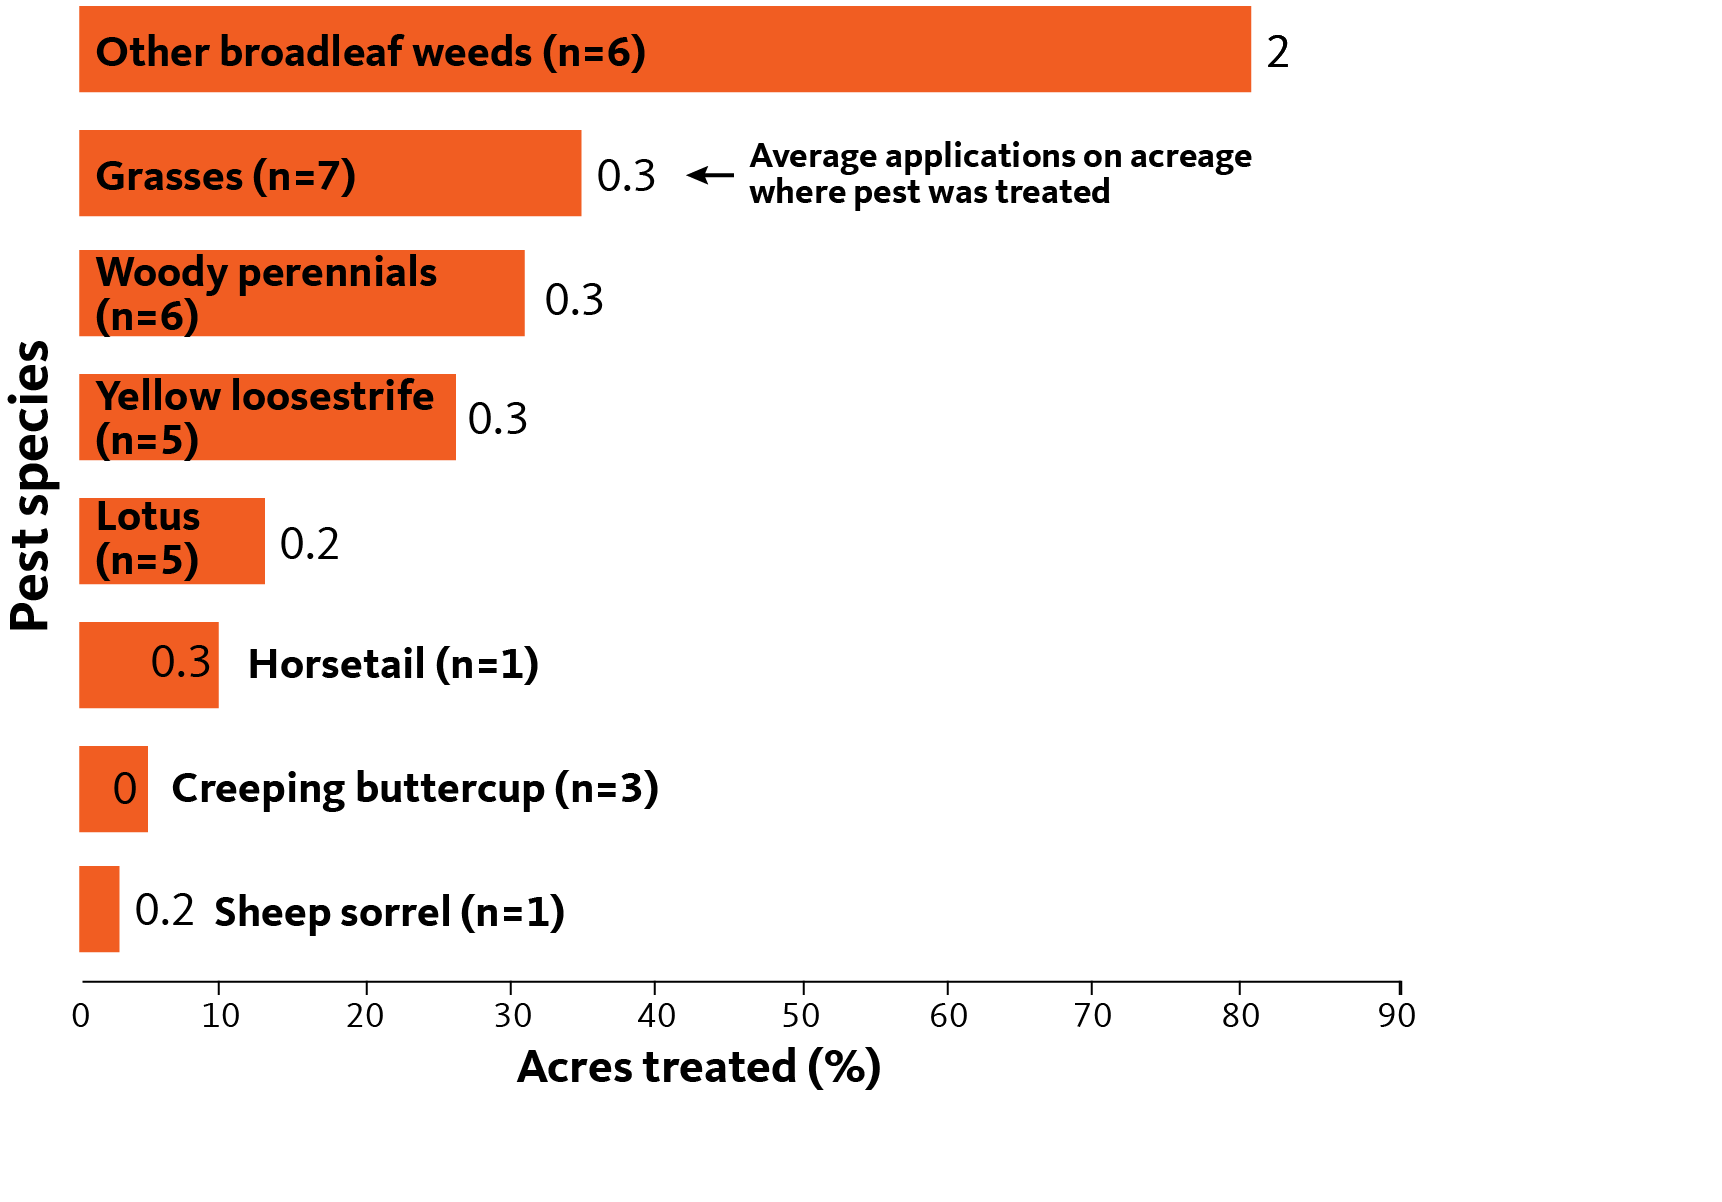
Acres treated and average number of pesticide applications targeting weeds
Acre-treatments per pest species
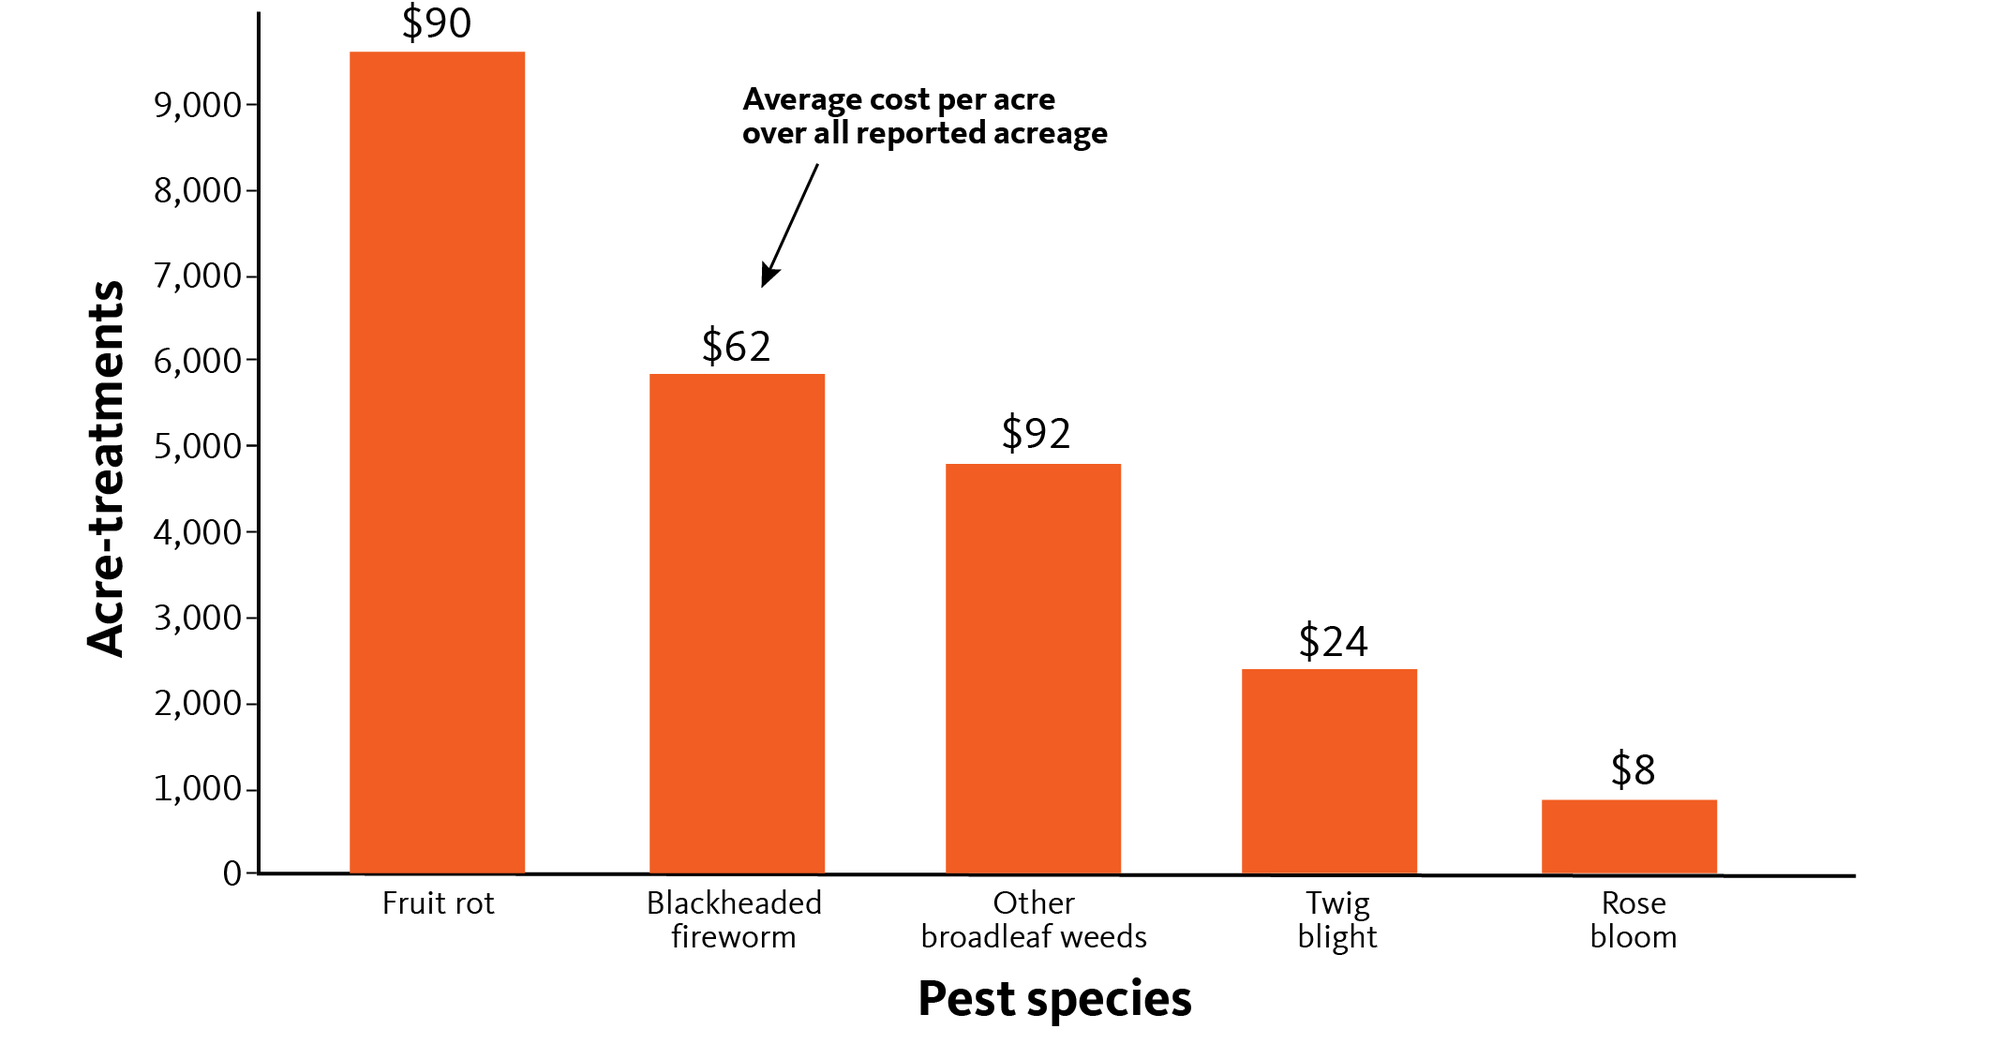
By multiplying the number of acres treated for a given pest by the average number of applications used to manage it, we obtain the “acre-treatments” metric. This number represents the total number of acres receiving treatment for a given pest. The number of acre-treatments can exceed the number of acres surveyed when acres receive multiple applications (in this case, multiple products or applications of the same product).
This is another way to demonstrate the level of management required for various pests. The figures below reveal the cranberry pests requiring the greatest amounts of chemical management in terms of “acre-treatments,” along with the average cost of treatment per acre. Acre-treatment estimates include pesticide applications in the form of seed treatments, fumigation, chemigation, ground applications and aerial applications.
Pests with highest acre-treatments
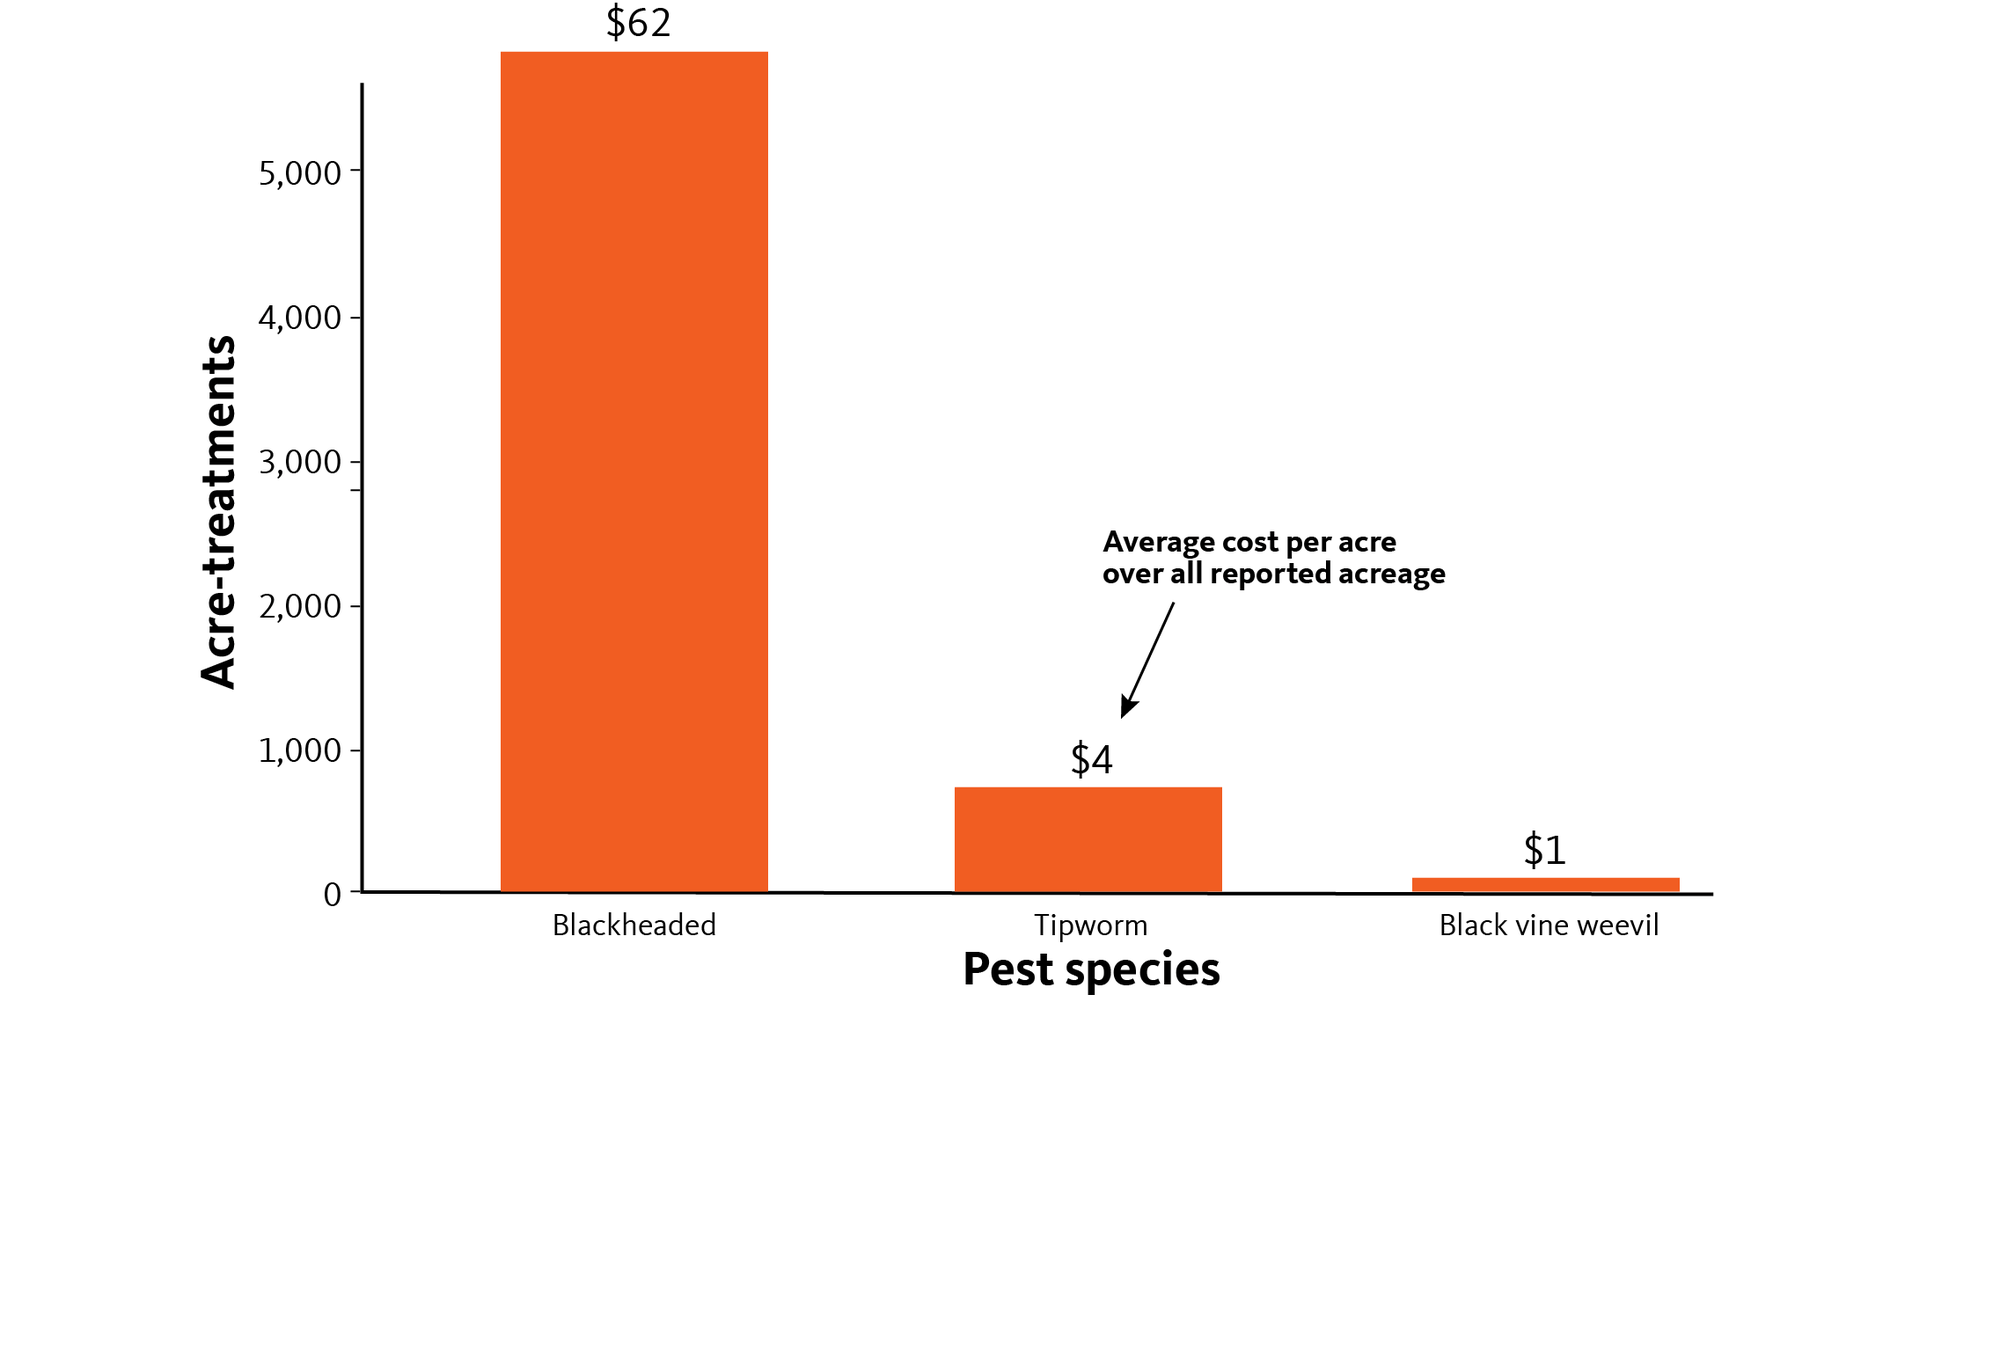
Acre-treatments for invertebrate pests
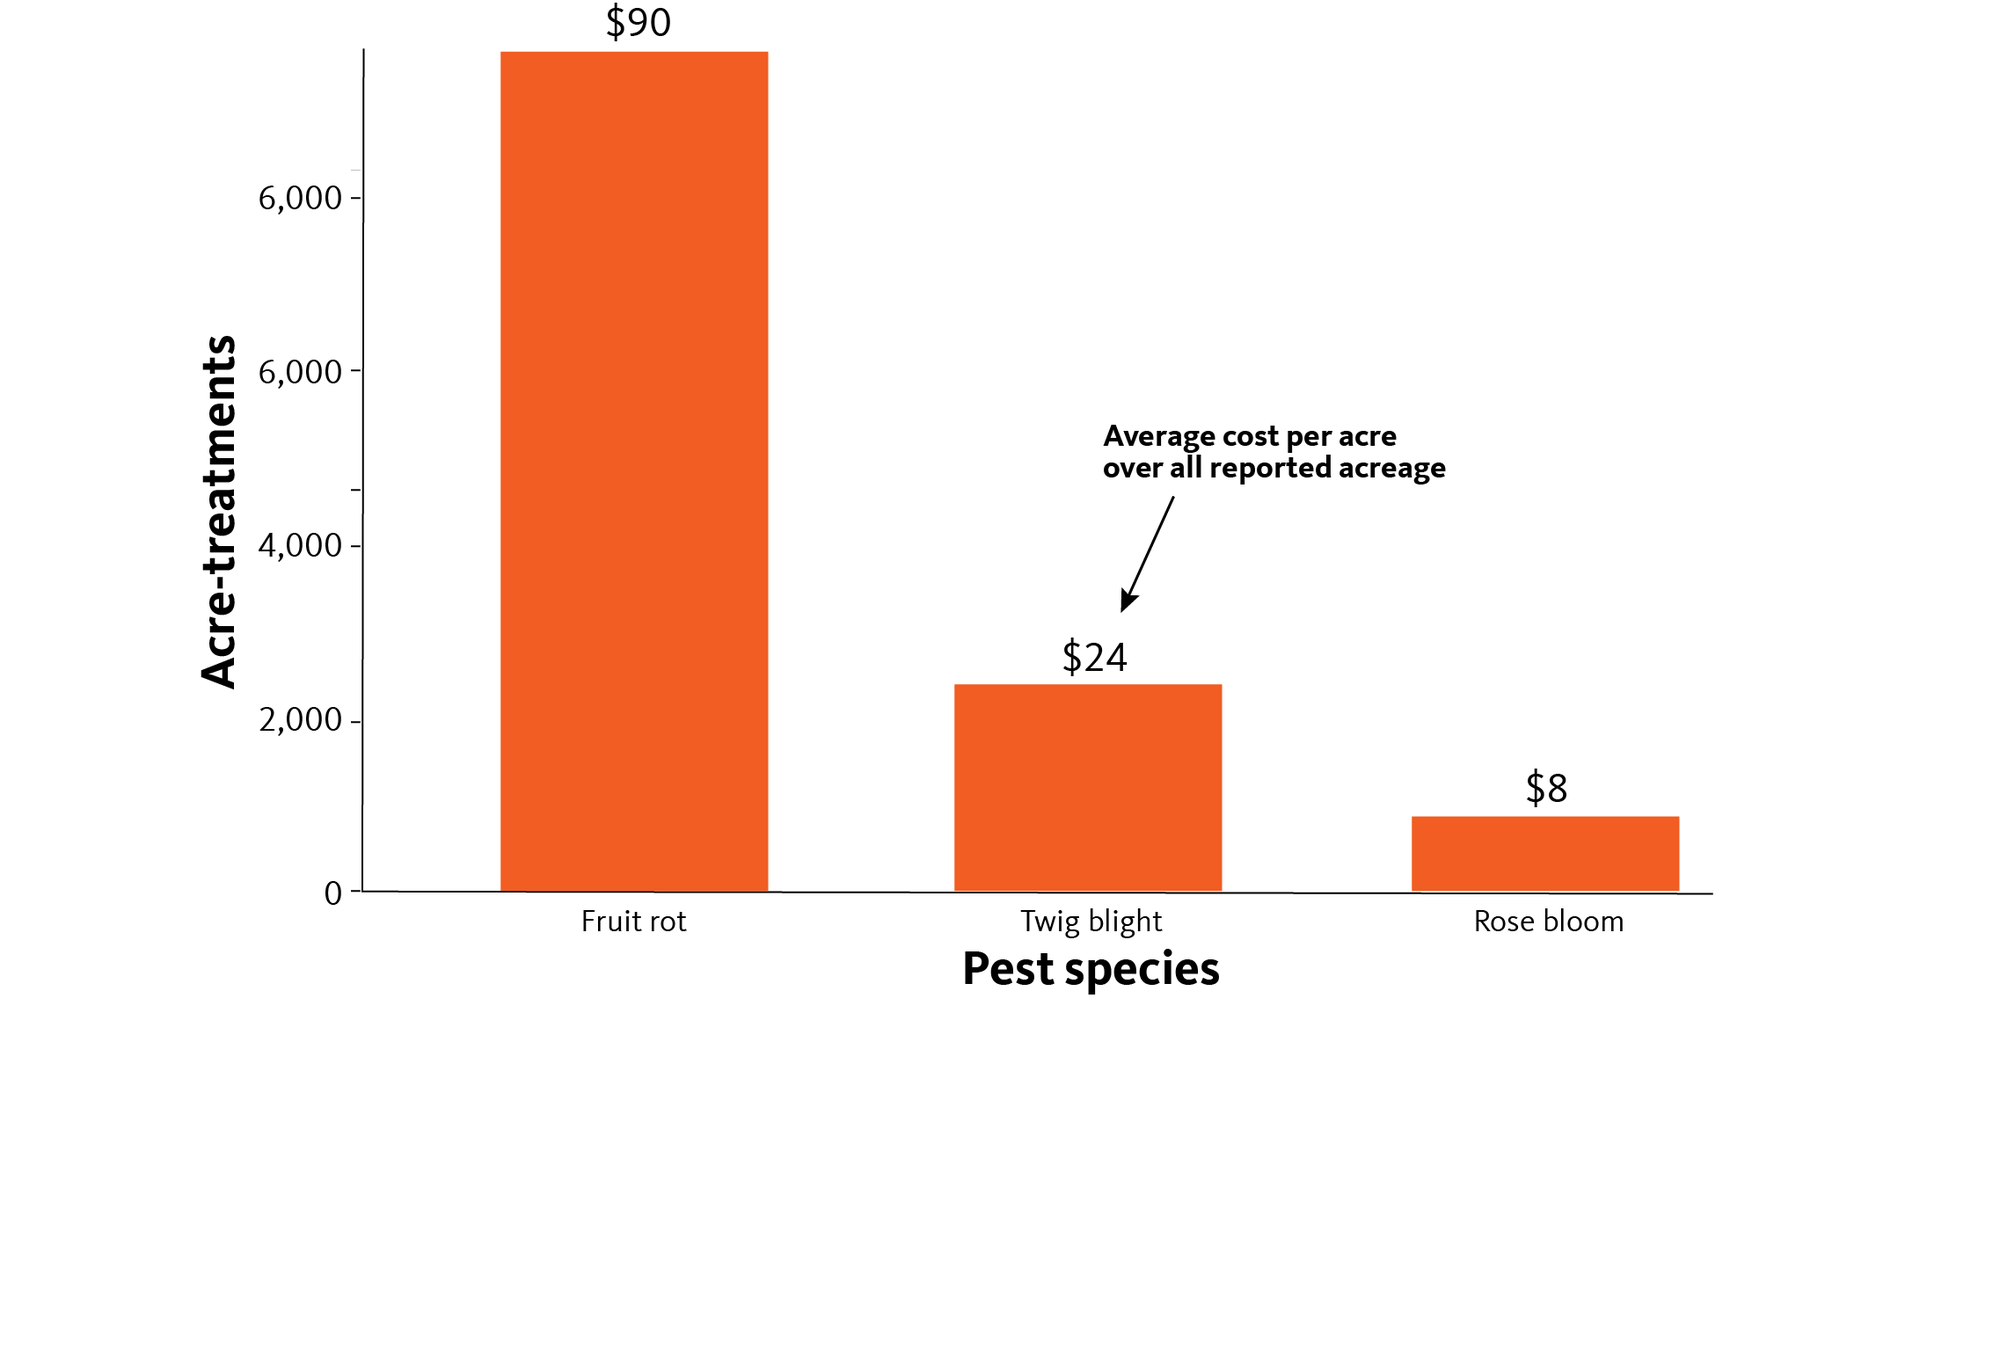
Acre-treatments for diseases
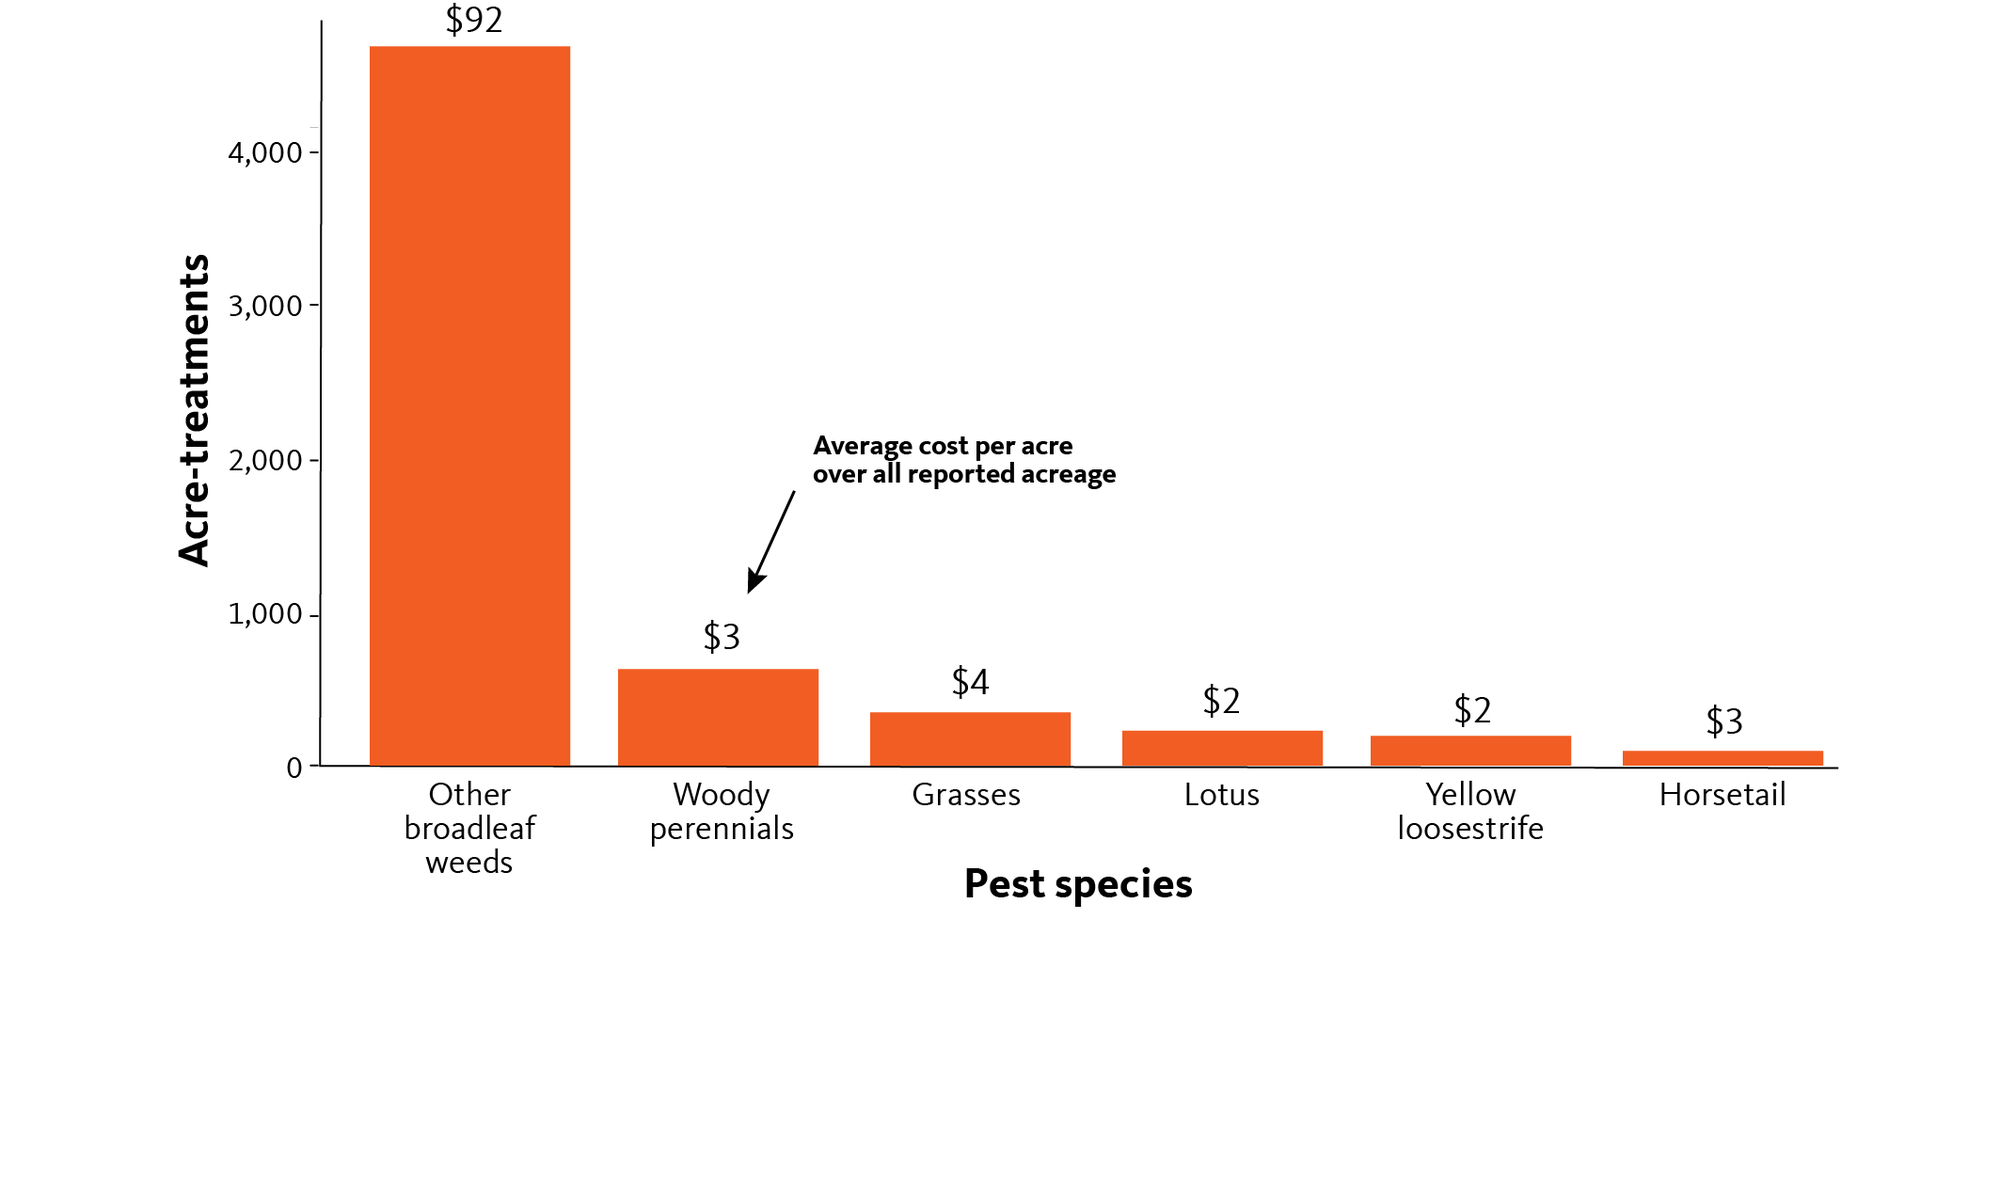
Acre-treatments for weeds
Costs of chemical management by pest species
For each pest species reported as present or managed on the acres that respondents oversaw, we determined the average number of pesticide applications made, along with the estimated average cost for one application (including application costs). The following figures depict the reported costs associated with management and represent the total cost over the growing season by pest. Note that some respondents had an insect population present but chose not to treat. These data were also included in the following analyses, with zero cost, to gain a more accurate measure of the costs associated with the presence of a given pest. The reasons why respondents choose not to treat a pest population are not covered in this study, but are an important topic for future research. Cost estimates include pesticide applications in the form of chemigation and ground applications.
Species whose chemical management costs were over $10 per acre on acreage where the pest was present
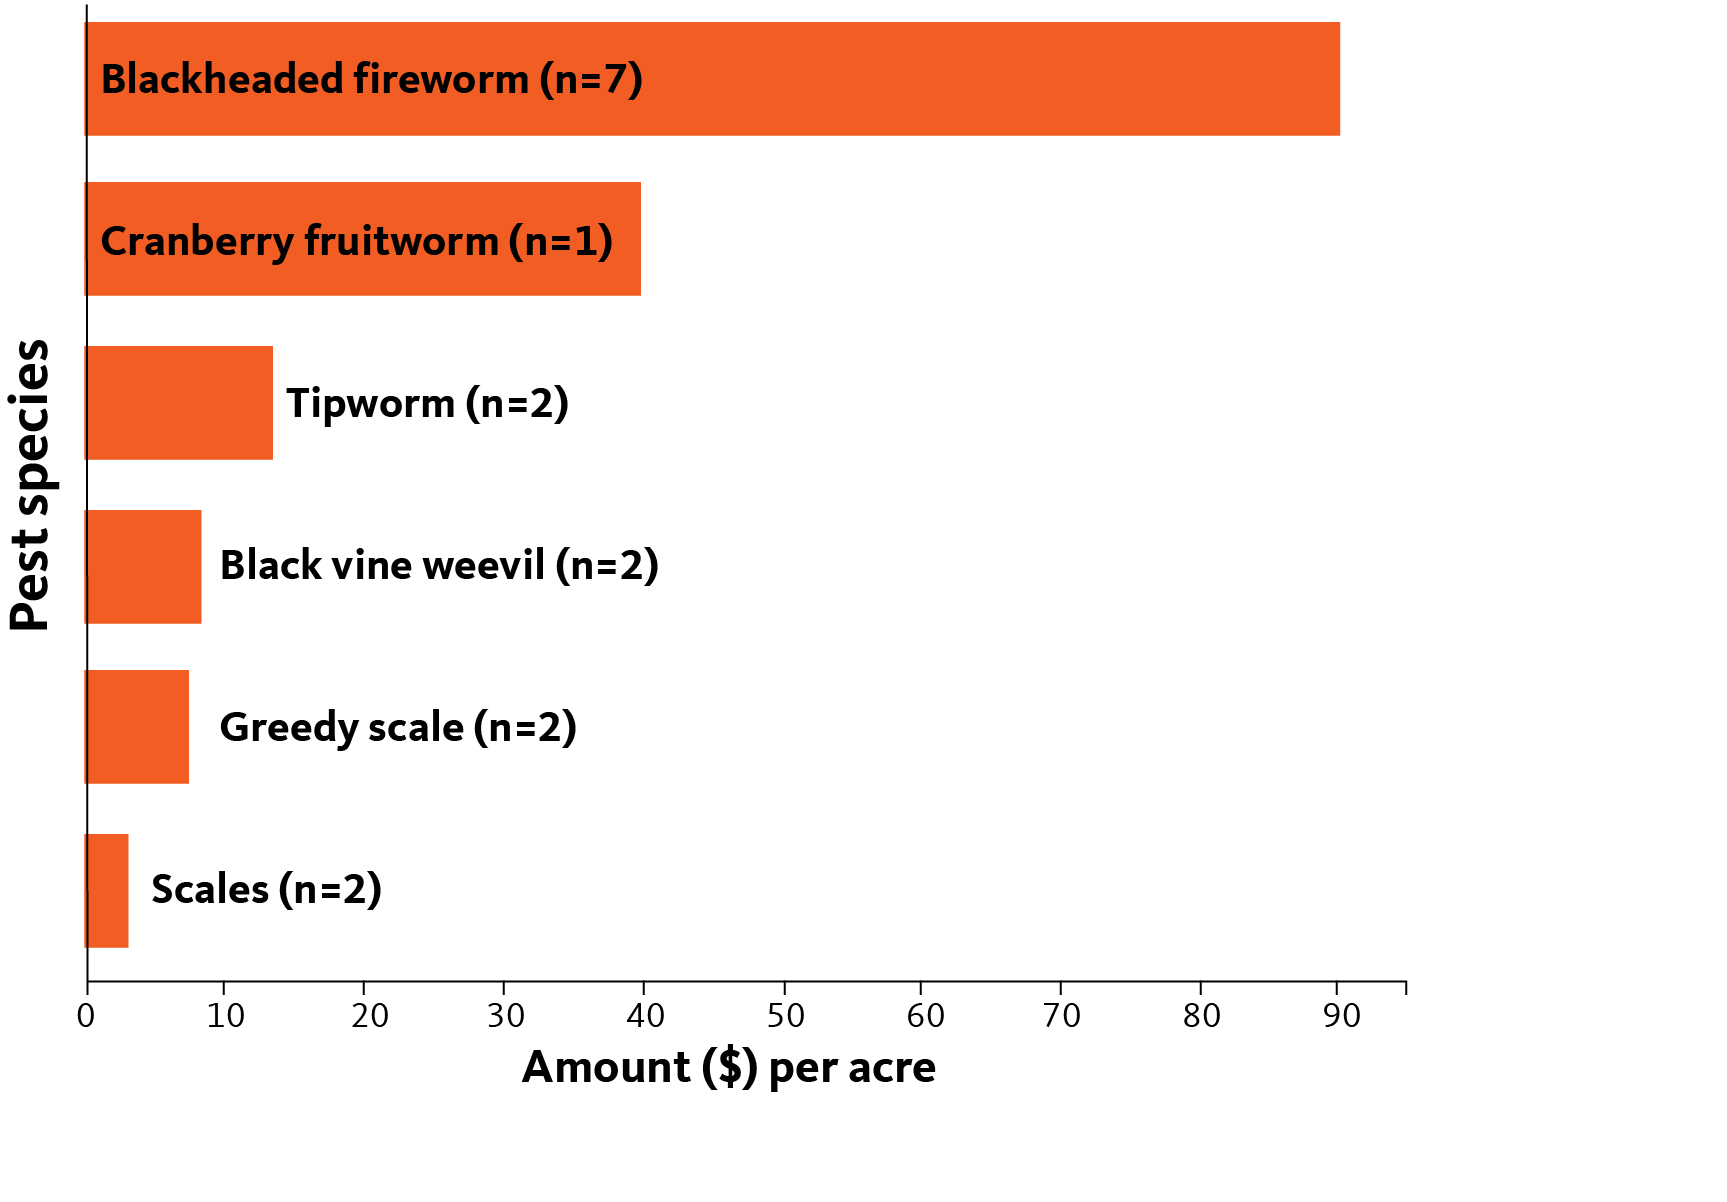
Costs of chemical management for invertebrate pest species
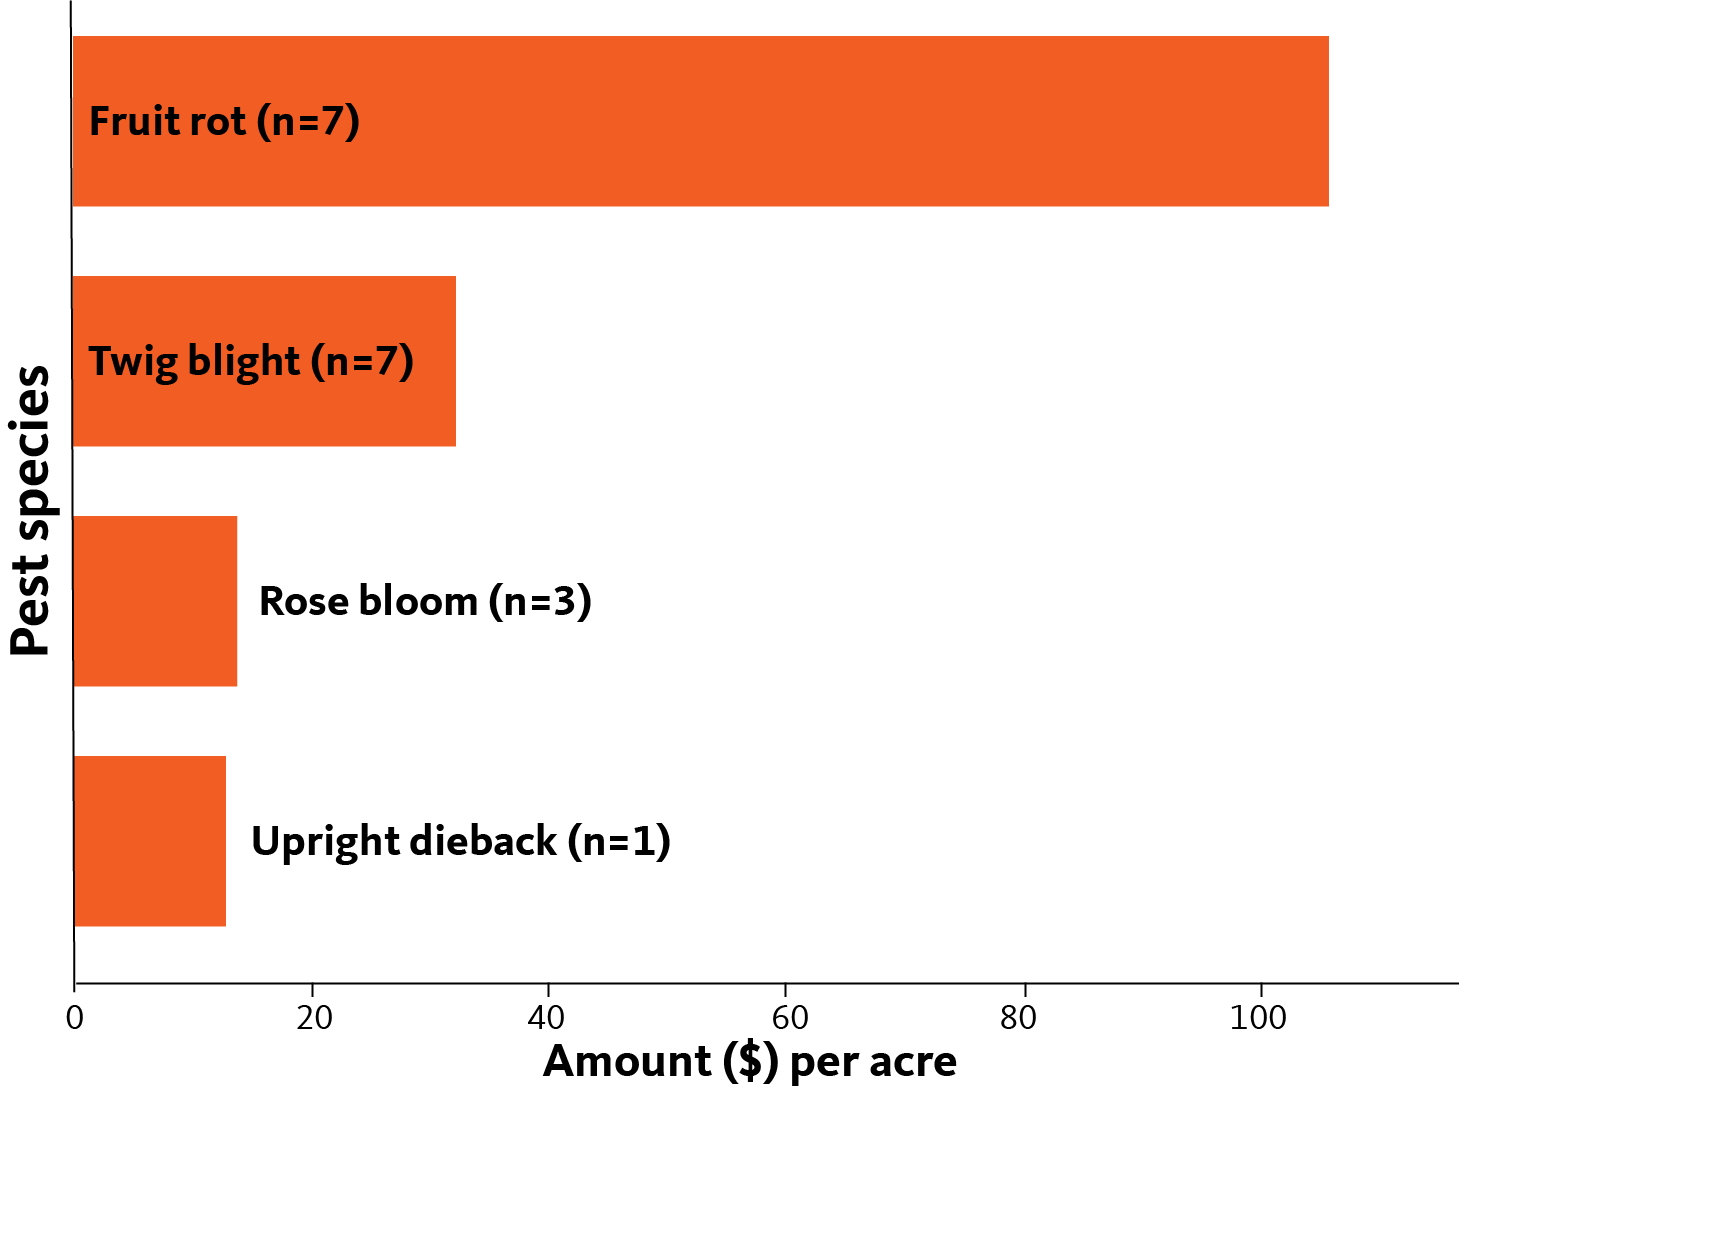
Costs of chemical management for diseases
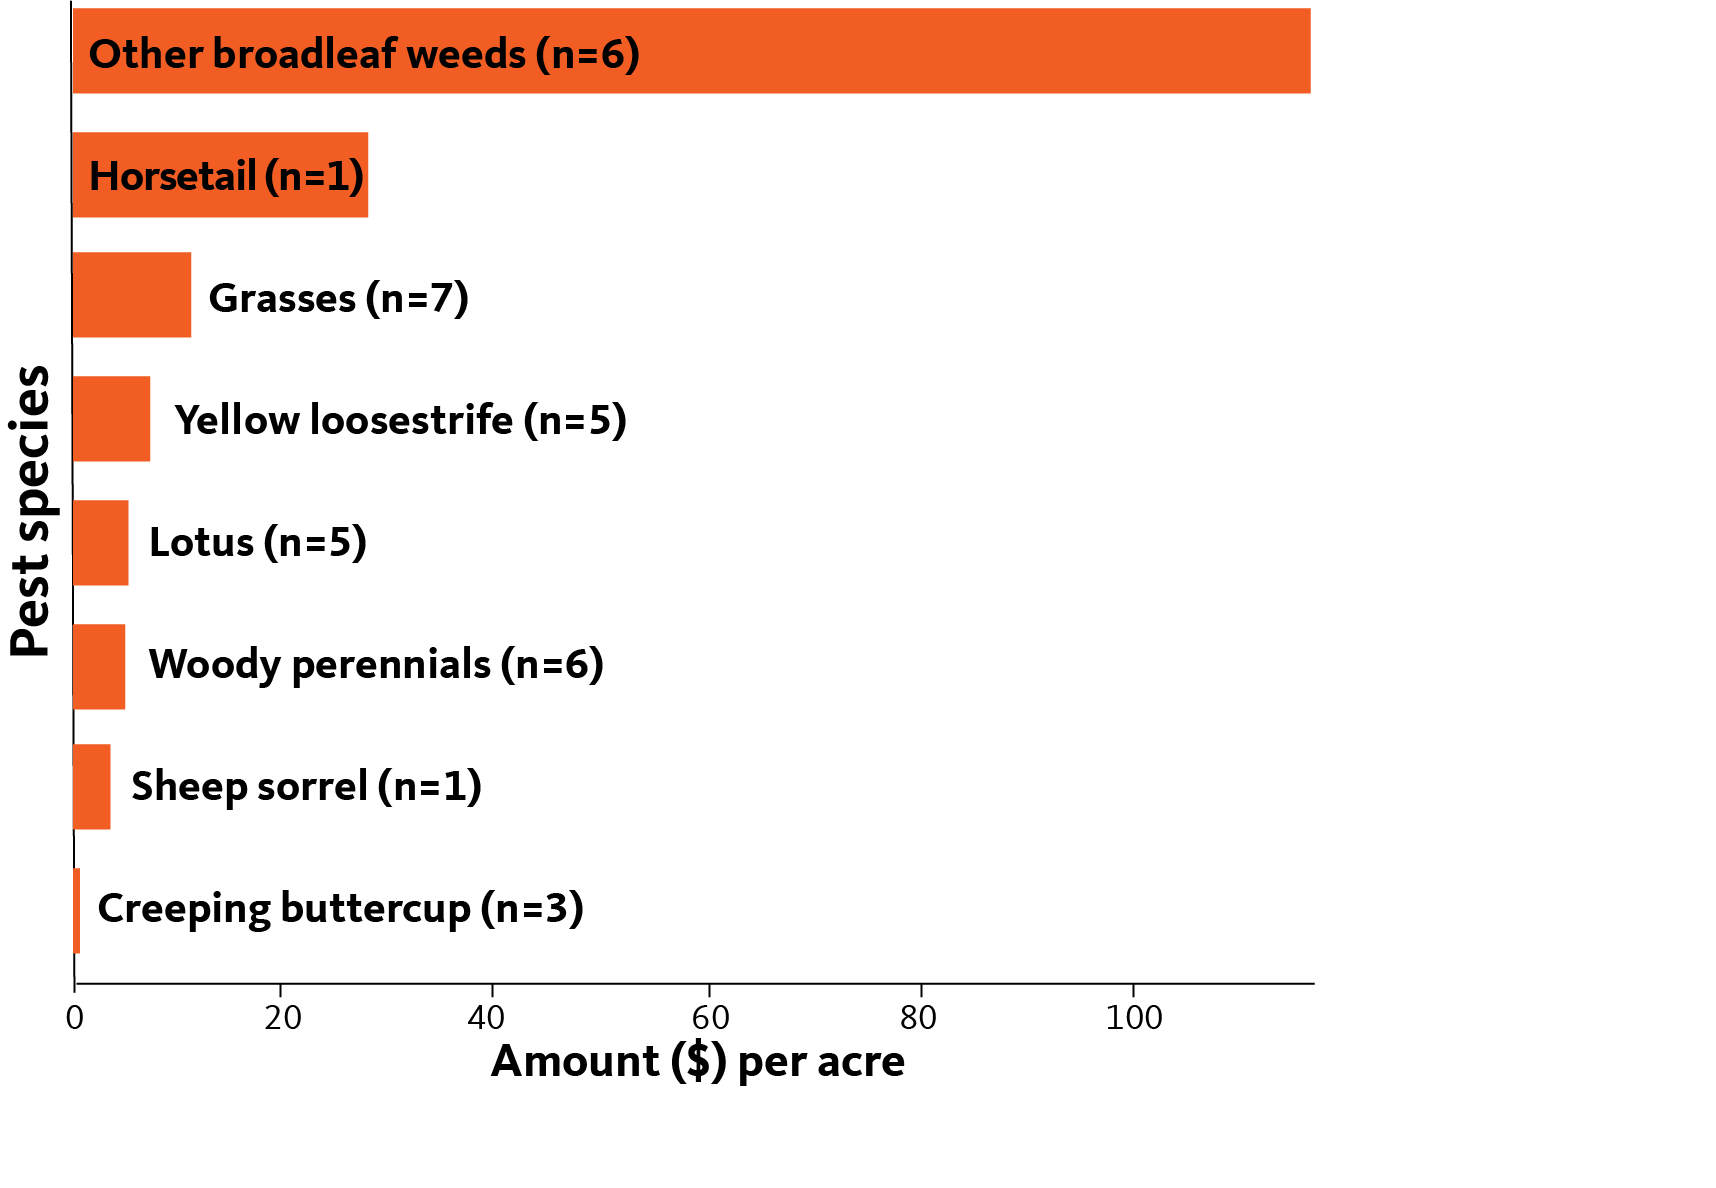
Costs of chemical management for weeds
Costs of other pest management activities
Respondents were also asked to estimate the cost of any additional pest management activities, beyond the use of pesticides. Respondents were asked to report the average cost per acre and the average number of acres to which each practice was applied. The cost per treated acre reflects respondents’ reported cost on acreage where the treatment was applied. The cost per acre across all surveyed acreage metric averages the treated acre costs across all surveyed acreage. For example, monitoring with traps may have occurred on only half the survey’s 2,988 acres, with an average cost of $5 per acre across those monitored acres. When averaged across the whole 2,988 acres, this represents a cost of $2.50 per acre. If a practice was applied across all of a respondent’s acreage, the two numbers (cost per treated acre and cost per acre across all survey acreage) would be the same.
Respondents struggled with estimating costs for activities like sanitation, monitoring and forecasting, which may have resulted in underreporting additional management costs. If we are to calculate the total cost of IPM, including nonchemical tactics and practices, we need to identify and factor in additional pest management costs. Field scouting, forecasting, sanitation and other practices all have associated costs. As the survey methodology advances, we seek to improve our understanding of these additional costs over time.
| Management action | Acres treated (%) | Cost per acre across all survey acreage ($) | Cost per acre on treated acreage ($) | N |
|---|---|---|---|---|
| Scouting | 43 | 14 | 16 | 6 |
| Pheromone traps | 18 | 1 | 5 | 2 |
| Recording insect incidence | 18 | 2 | 4 | 3 |
| Insect forecasting | 10 | 1 | 10 | 1 |
| Sanding | 9 | 43 | 75 | 4 |
| Harvest timing | 4 | 0 | 0 | 1 |
| Flooding | 3 | 11 | 25 | 3 |
| Biological control | 2 | 14 | 100 | 1 |
| Irrigation practices | 2 | 0 | 0 | 1 |
| Equipment sanitation | 1 | 0 | 0 | 1 |
| Management action | Acres treated (%) | Cost per acre across all survey acreage ($) | Cost per acre on treated acreage ($) | N |
|---|---|---|---|---|
| Irrigation practices | 73 | 17 | 24 | 5 |
| Ditch maintenance/drainage | 62 | 39 | 54 | 5 |
| Pruning | 36 | 17 | 30 | 4 |
| Nutrient management | 34 | 14 | 50 | 2 |
| Equipment sanitation | 32 | 2 | 3 | 4 |
| Scouting | 23 | 9 | 12 | 5 |
| Harvest timing | 14 | 0 | 1 | 2 |
| Field sanitation | 10 | 2 | 4 | 3 |
| Sanding | 7 | 29 | 67 | 3 |
| Management action | Acres treated (%) | Cost per acre across all survey acreage ($) | Cost per acre on treated acreage ($) | N |
|---|---|---|---|---|
| Hand weeding | 51 | 21 | 36 | 4 |
| Drainage management | 44 | 8 | 14 | 4 |
| Mowing dikes | 41 | 17 | 24 | 5 |
| Hand wiping | 40 | 23 | 27 | 6 |
| Weed mapping | 10 | 6 | 40 | 1 |
| Irrigation practices | 4 | 0 | 0 | 2 |
| Pre-plant bed prep | 3 | 43 | 75 | 4 |
| Pond/ditch cleanup | 2 | 0 | 1 | 2 |
Pesticide use
In addition to collecting data by pest species, we asked respondents to provide details of each specific pesticide active ingredient they used. The figures in this section summarize the reported use of pesticides in terms of percent acres treated and average number of applications for each active ingredient.
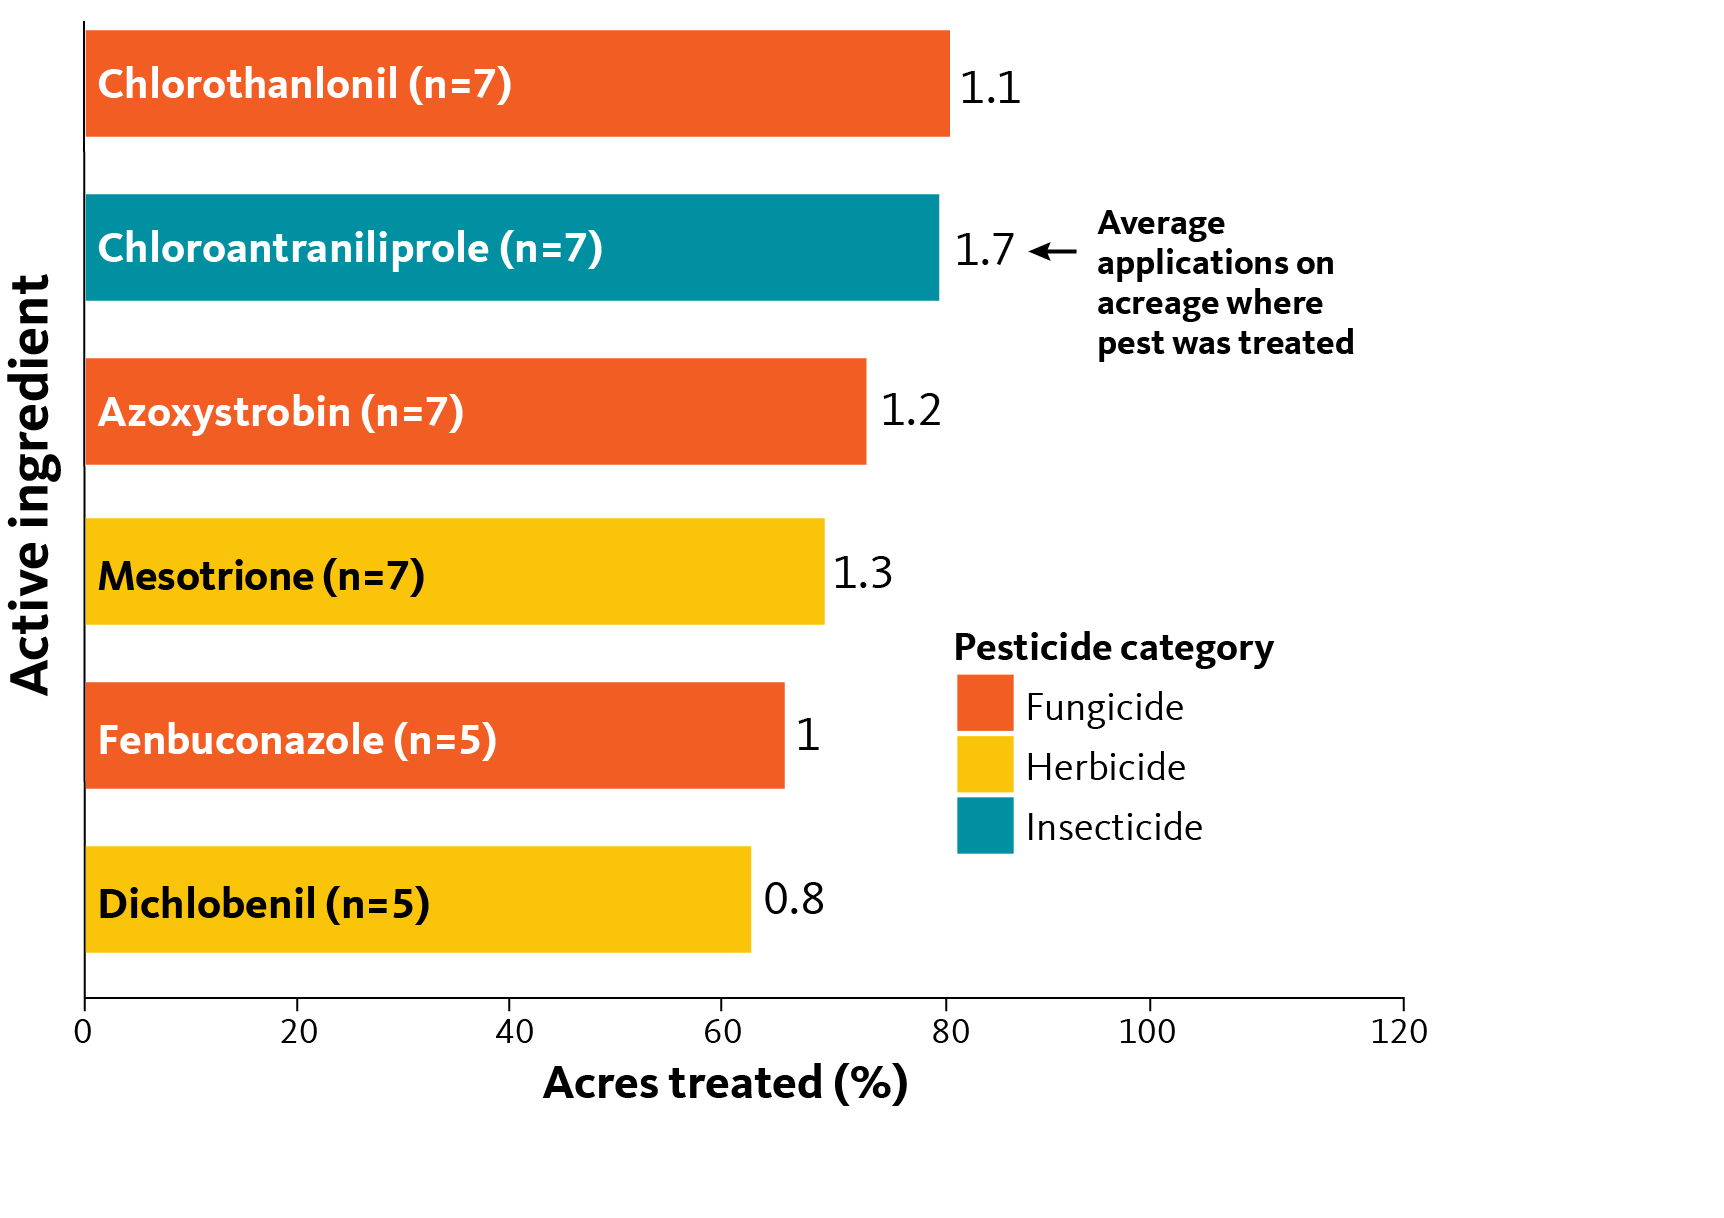
The first figure reports the pesticides used on over 50% of surveyed acreage, along with the average number of times each active ingredient was applied. The figures that follow report this data for insecticides, fungicides and herbicides, respectively. Note: average number of applications can be fractional because some single treatments were apportioned across multiple target pests.
Pesticides applied on over 50% of survey acreage, with average number of applications
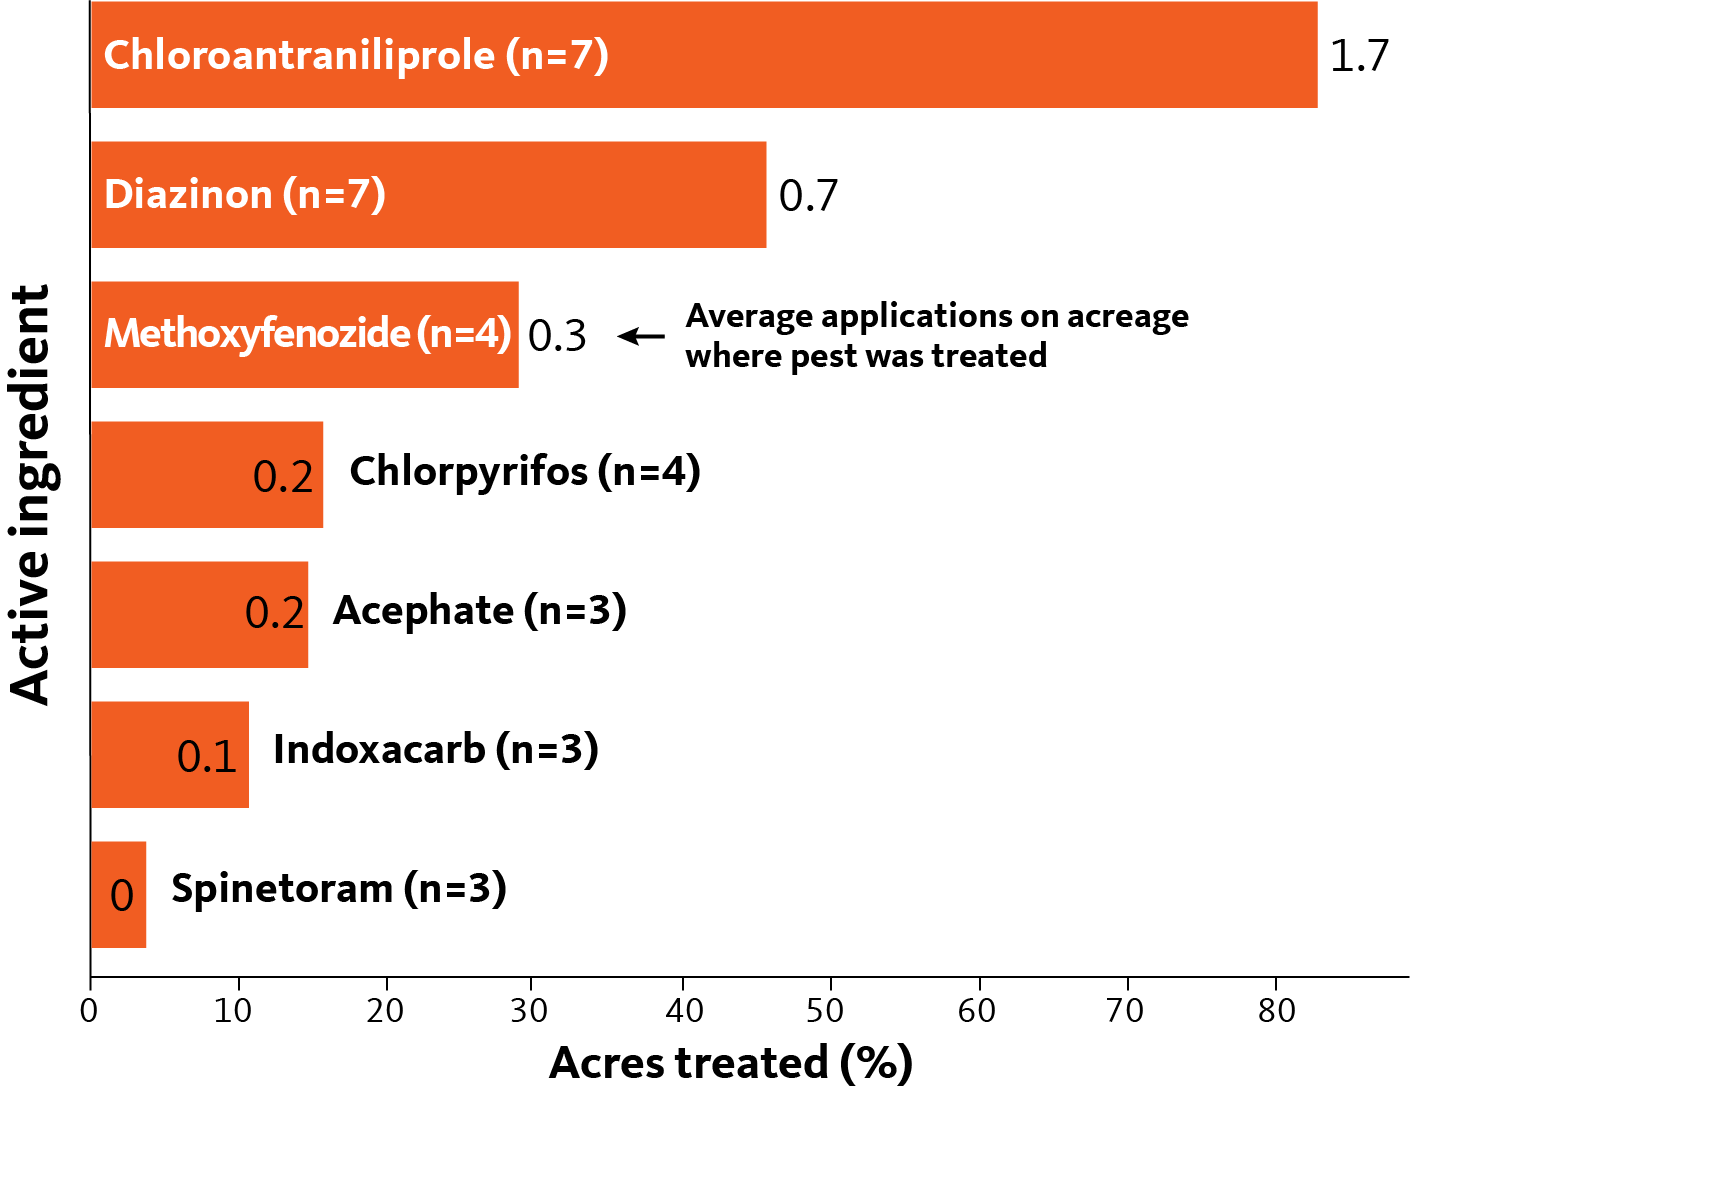
Percent acreage treated with insecticide active ingredient
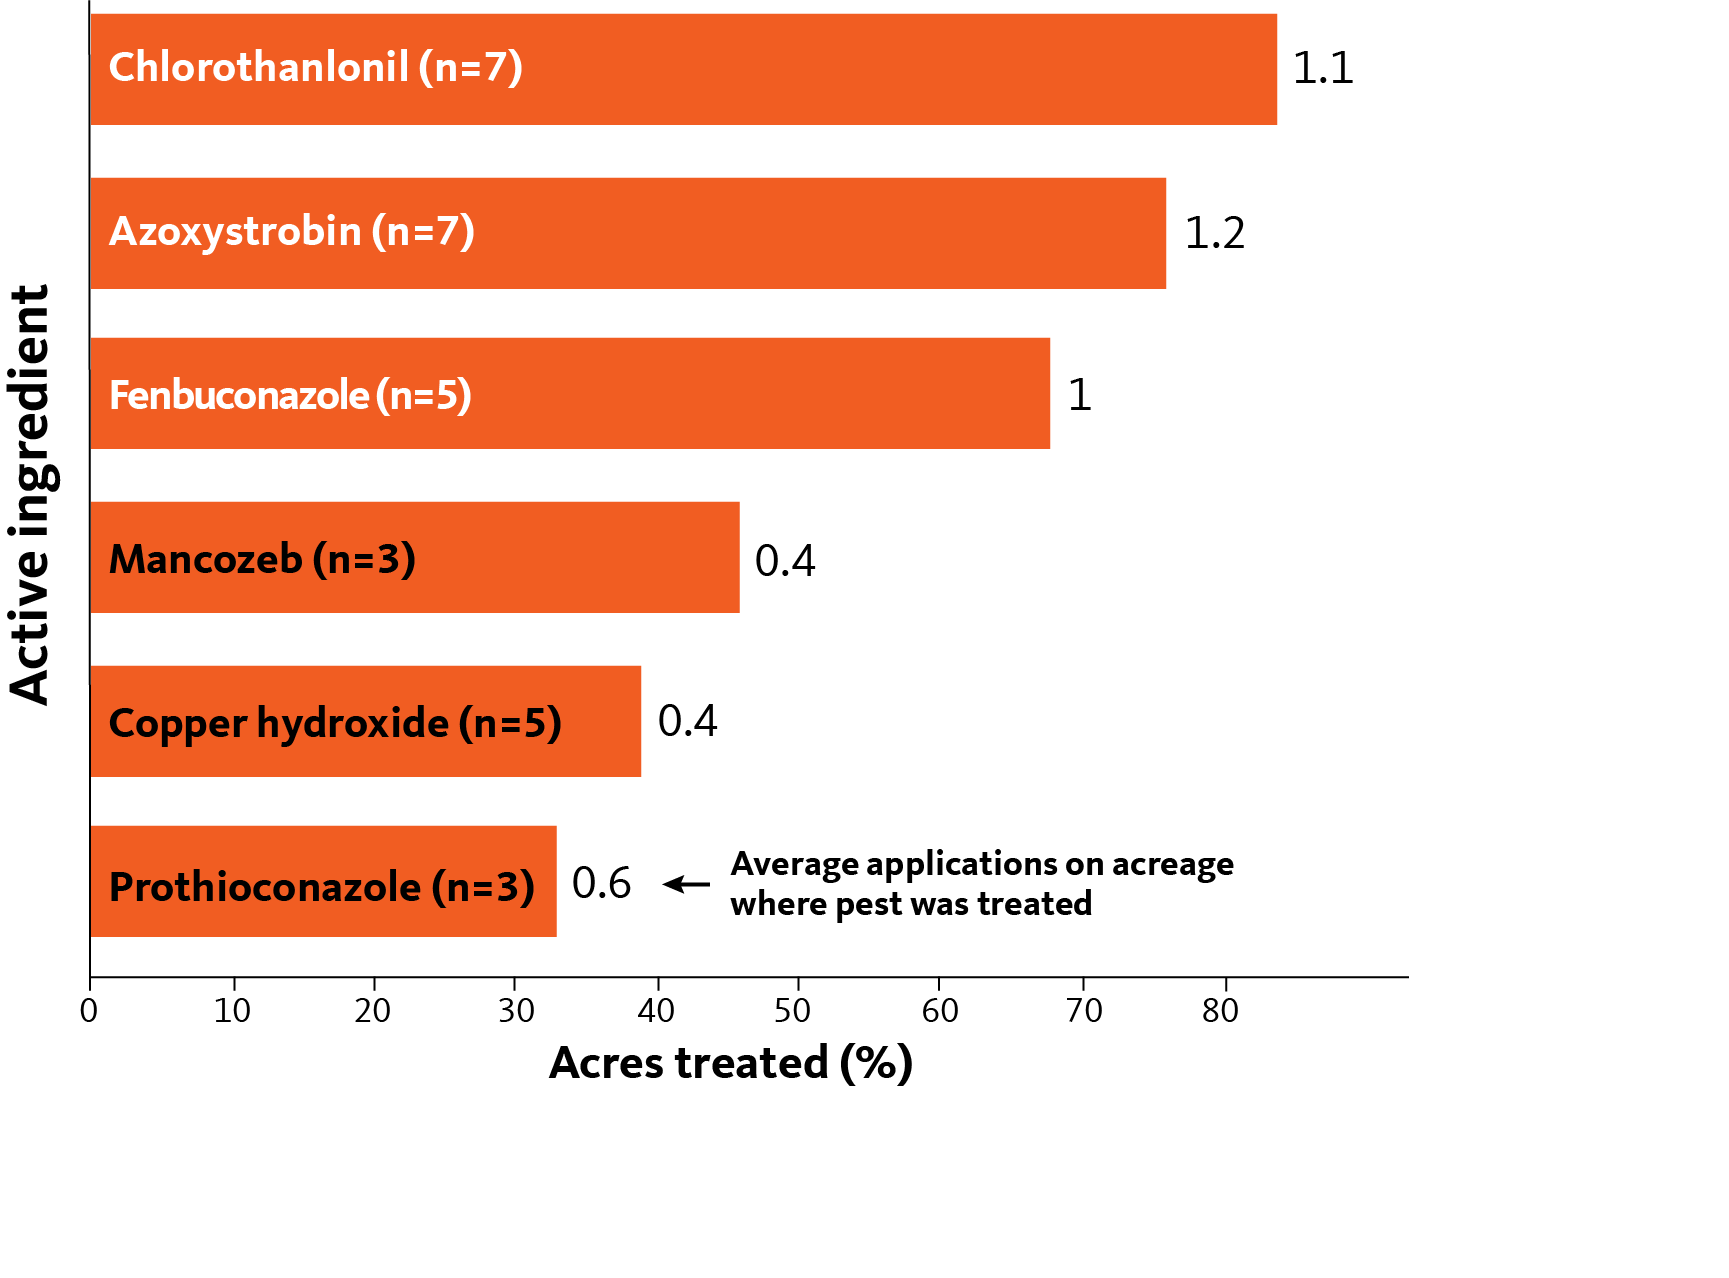
Percent acreage treated with fungicide active ingredient
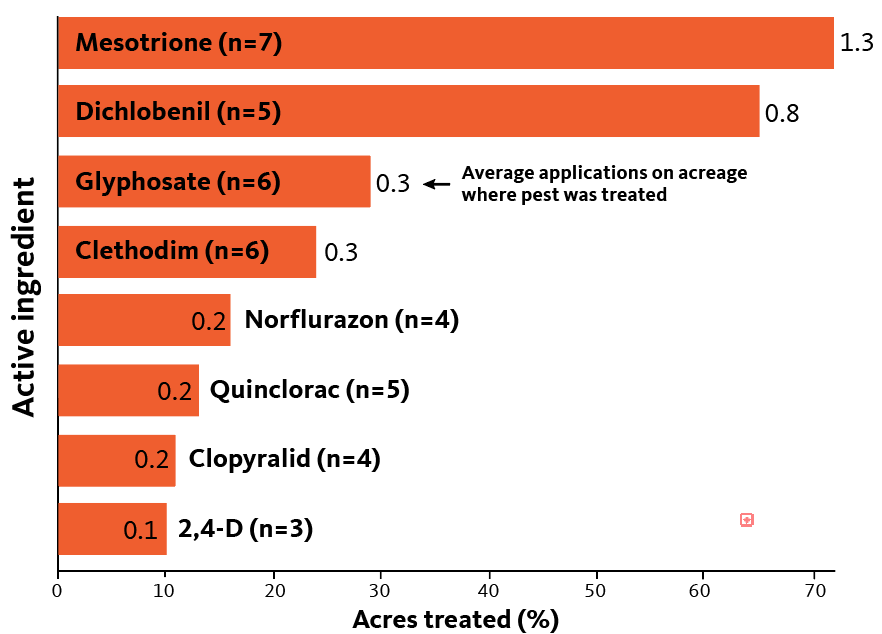
Percent acreage treated with herbicide active ingredient
Pesticide acre-treatments
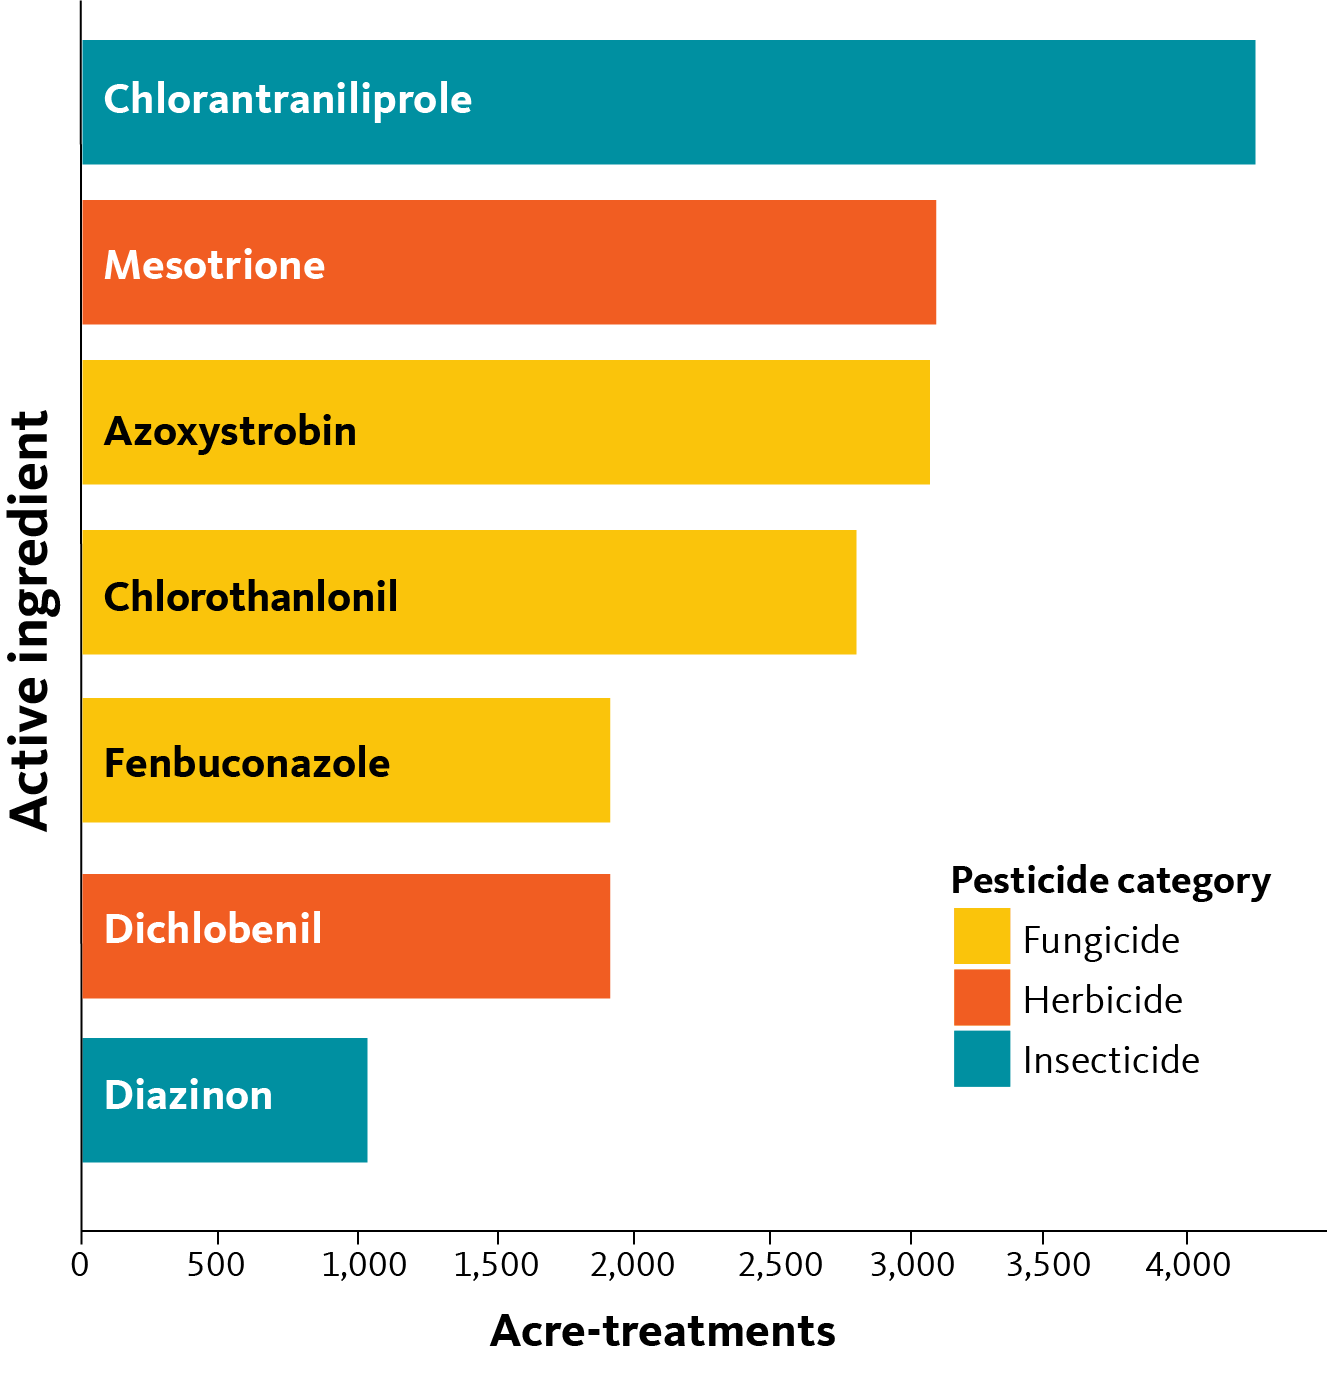
The number of acres treated with a given active ingredient, multiplied by the average number of applications, again reveals “acre-treatment” estimates (see “acre-treatments per pest species,” for a reminder of this metric). This reveals the extent of pesticide use required and provides critical information for researchers and educators, particularly those tracking issues such as pest resistance, natural enemy protection and pesticide efficacy. This also serves as a baseline for tracking the way practices change over time. As a reminder, the acre-treatment metric is based only on our surveyed acreage (2,988 acres), and only those acres reported to have been treated with any given pesticide. (See previous section for percent acres treated and average number of applications, the metrics used for the following calculations).
Pesticide active ingredients with over 1,000 acre-treatments
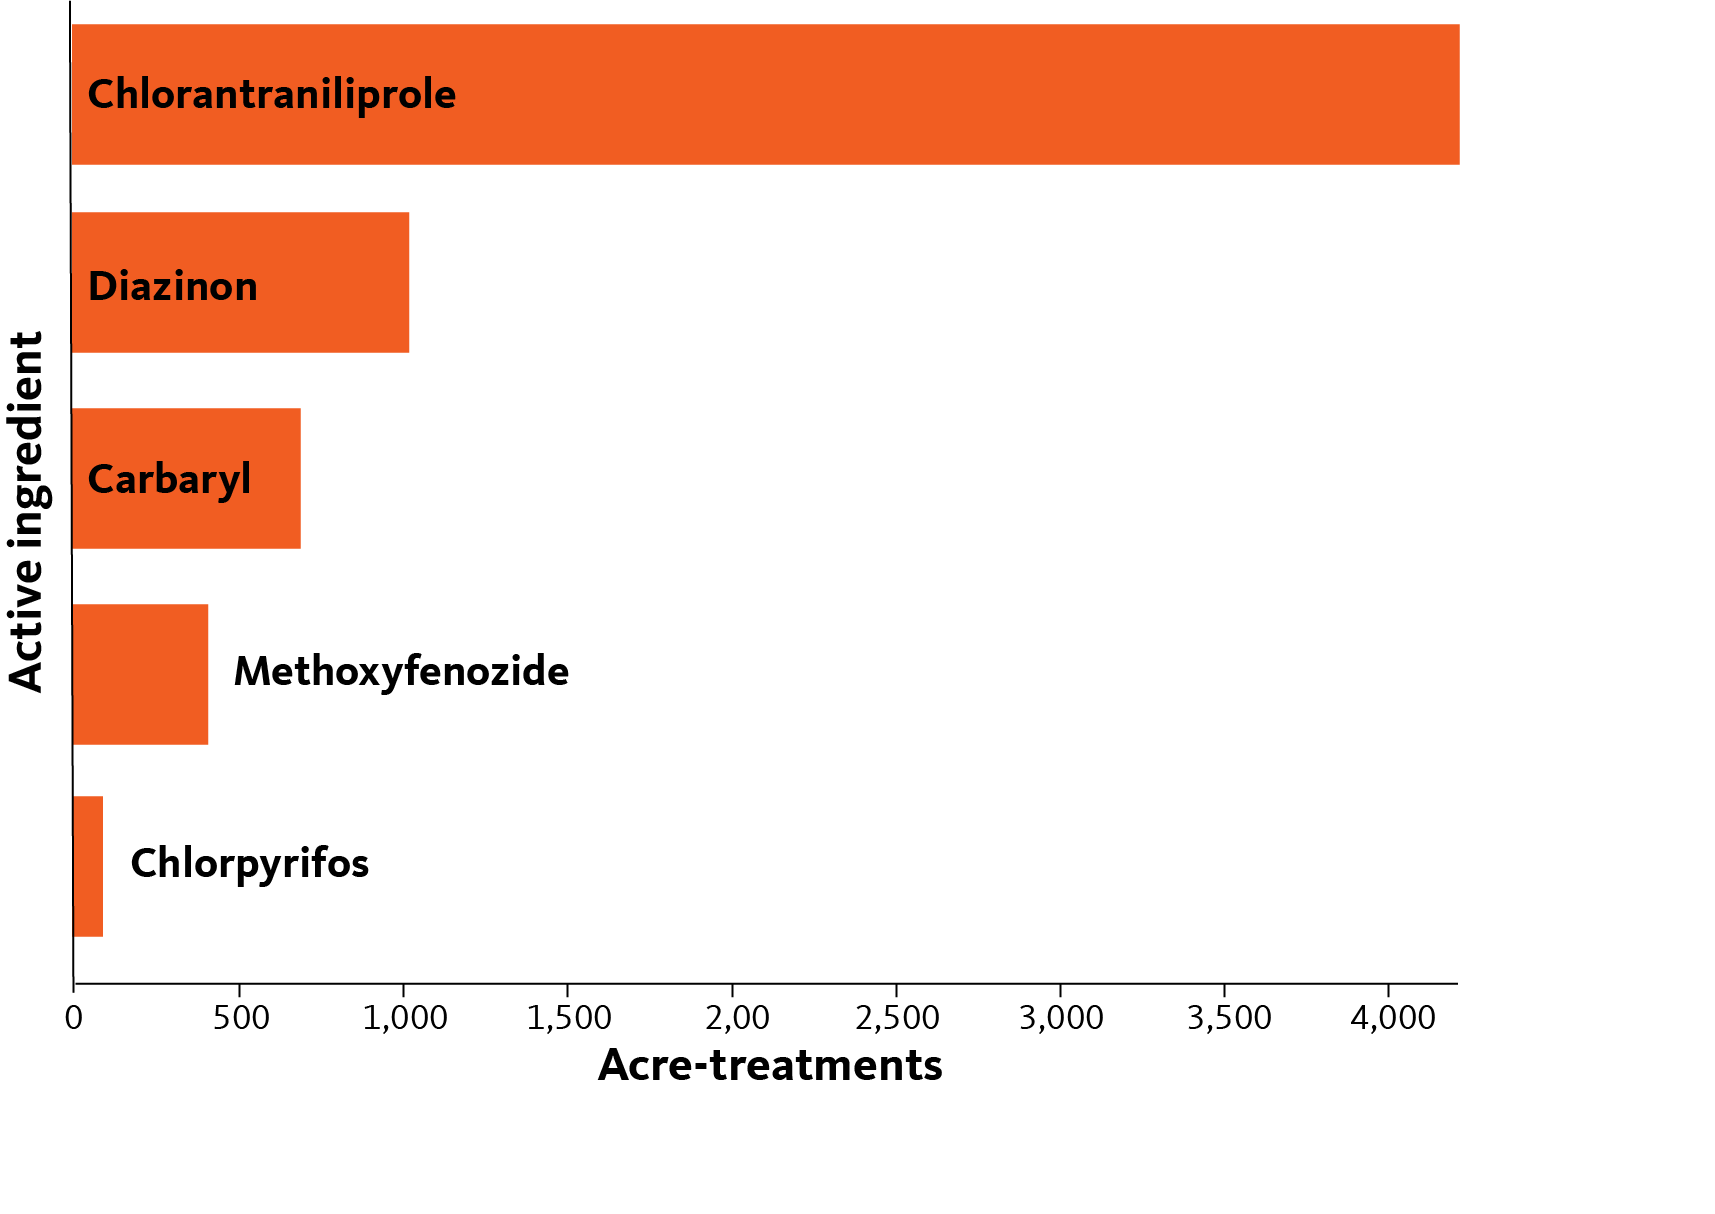
Acre-treatments for commonly used insecticides
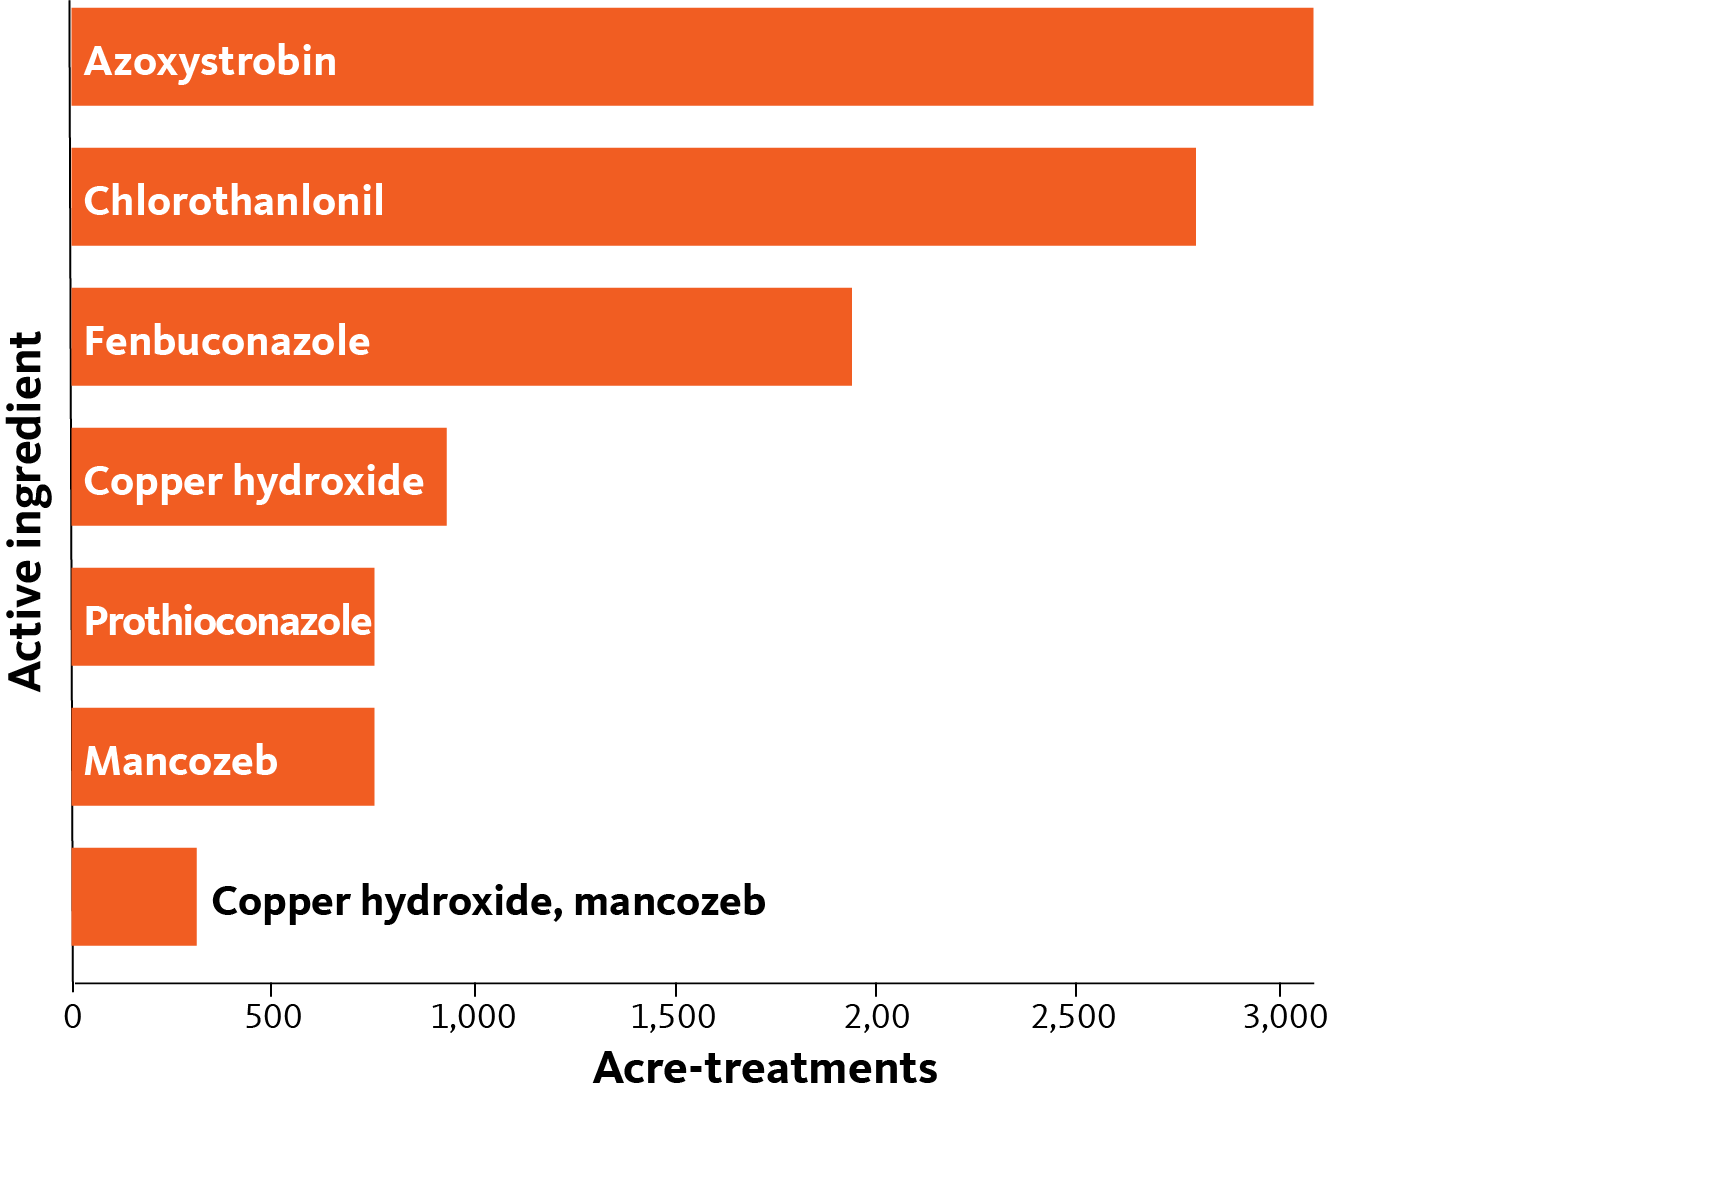
Acre-treatments for commonly used fungicides
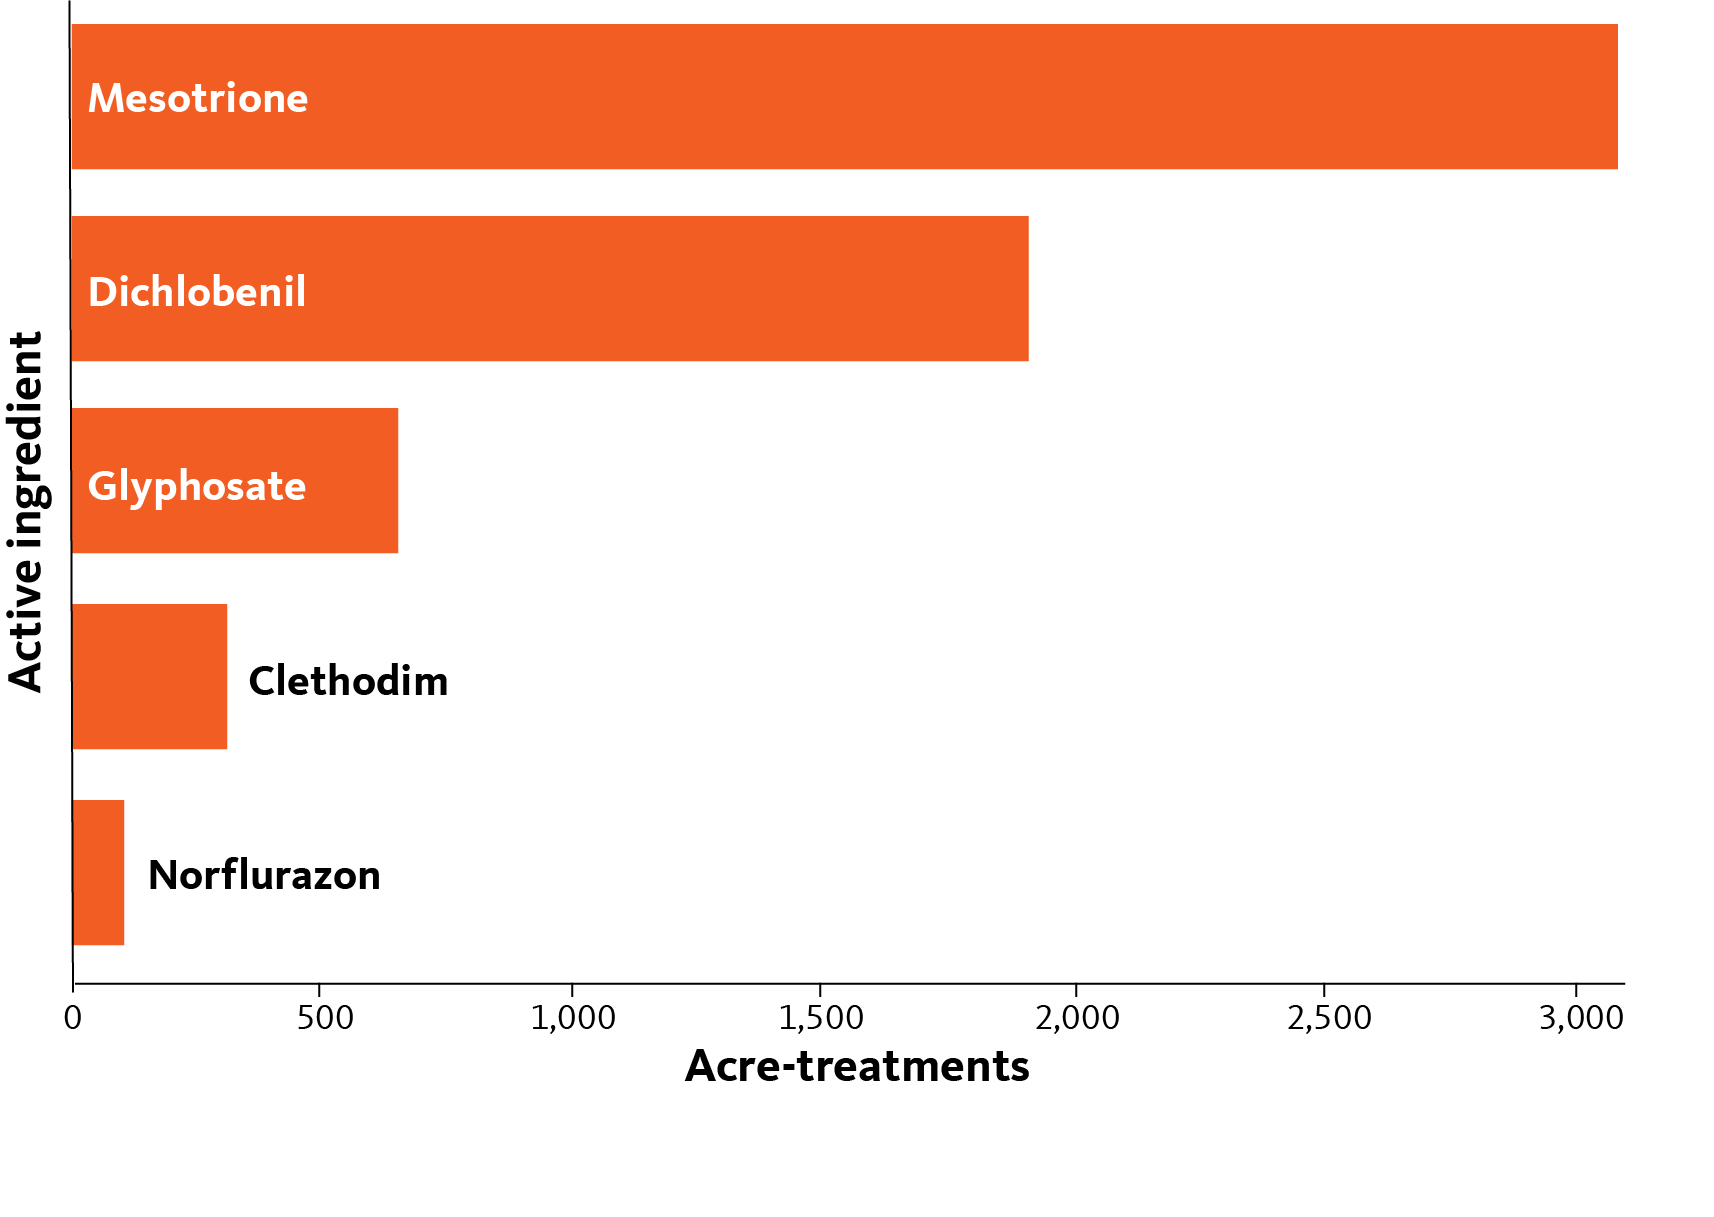
Acre-treatments for commonly used herbicides
Overall economic impacts
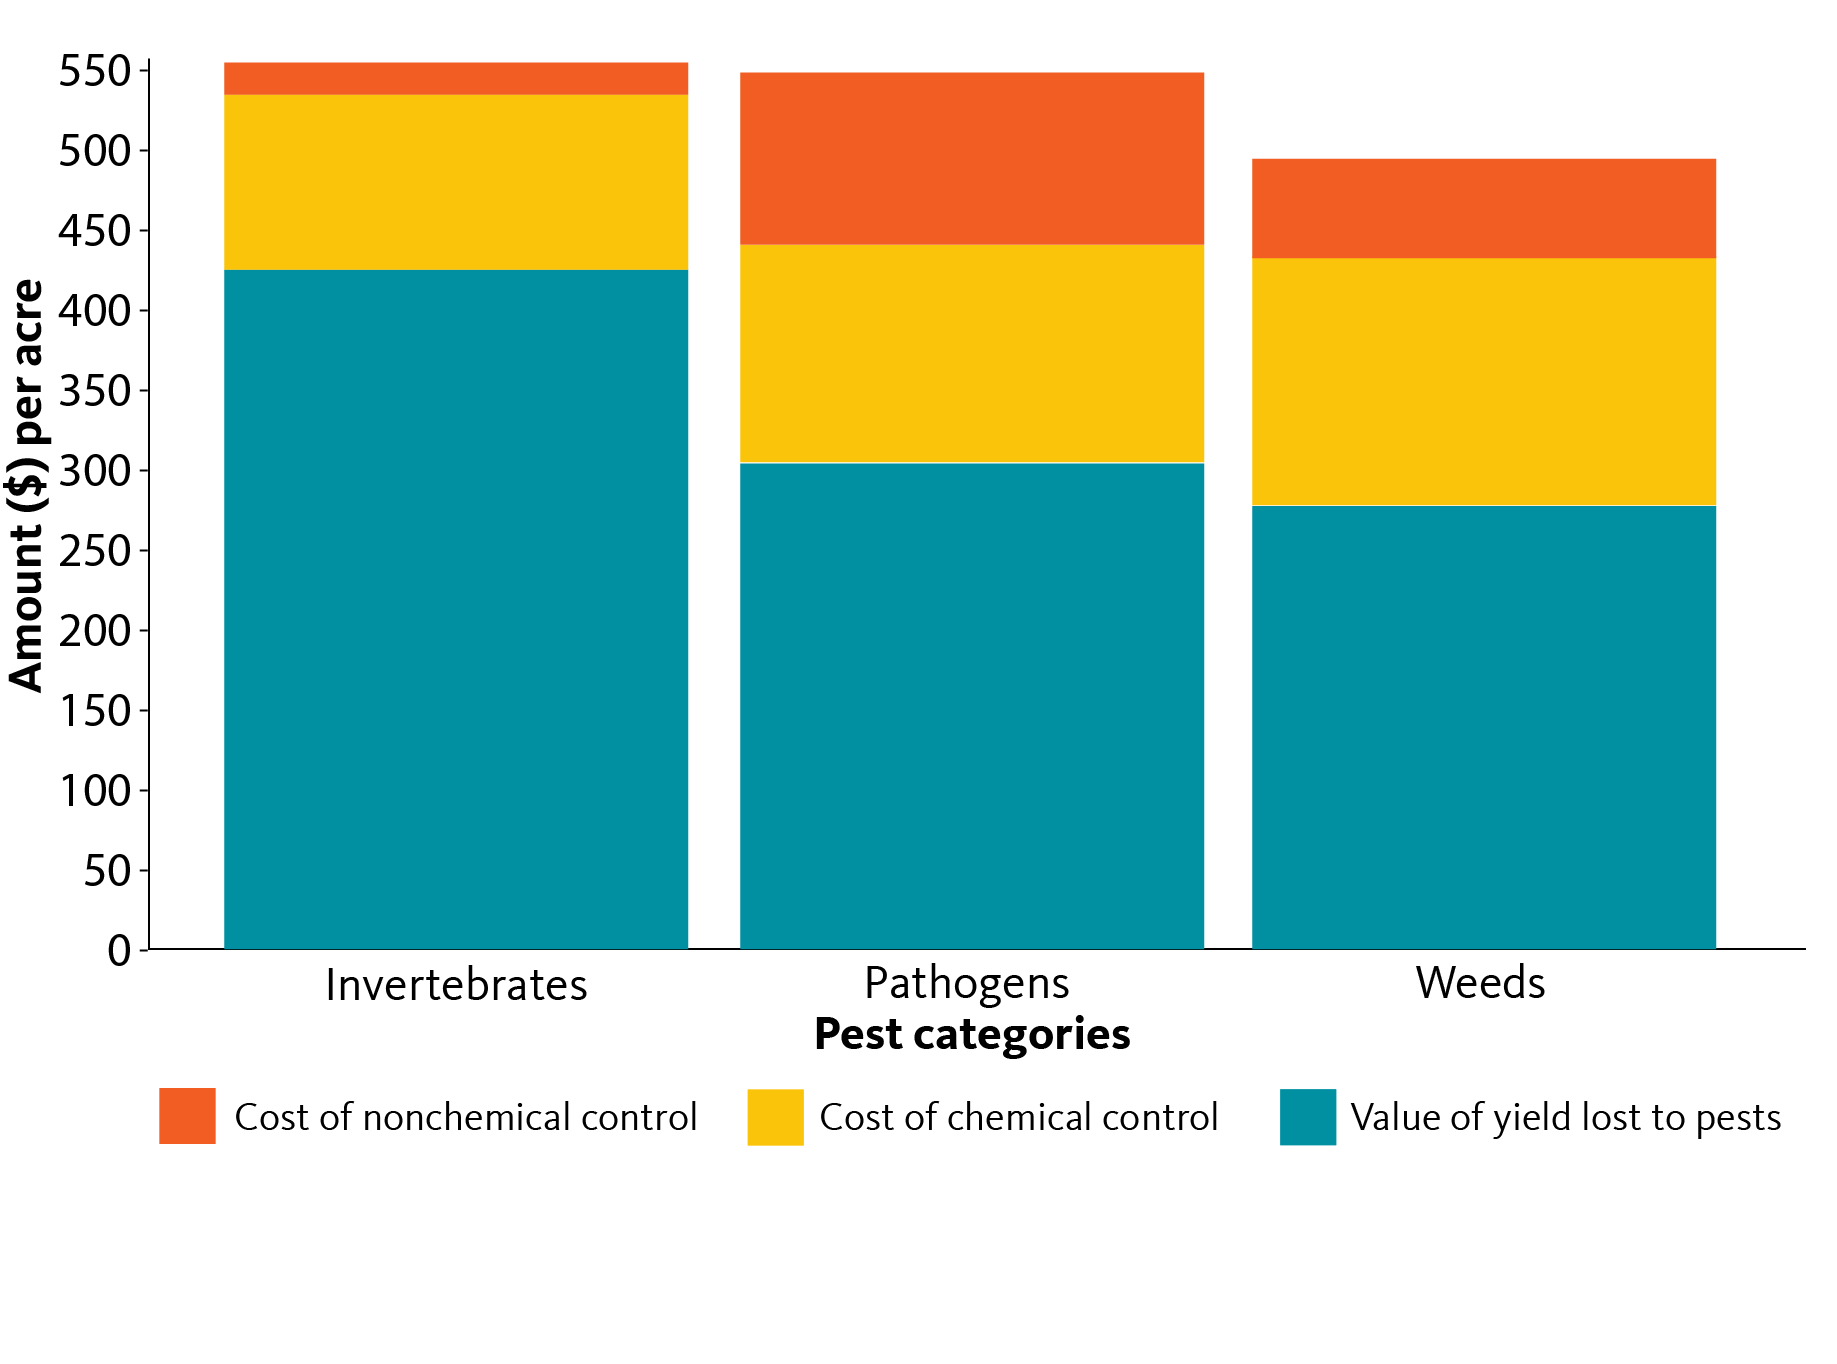
To get an idea of the overall economic impacts of yield loss and pest management across the entire survey area, we calculated a per-acre average of all pest management costs (chemical as well as additional or “nonchemical” costs), as well as the value of the total yield losses reported, which occurred despite the management methods employed. As previously mentioned, the nonchemical costs are an area for improvement in our survey process.
Summary of economic impacts per acre, across all survey acreage
Discussion
Analysis of the 2016 survey data revealed that the average yield of 11,906 lb/acre was 37% lower than the potentially achievable yield of 18,970 lb/acre that could be obtained in ideal weather and pest-free conditions. Although adjusted crop management alone cannot resolve this discrepancy, pest impacts can be reduced through improvements in IPM practices and decision-making rooted in field data and address priority pests.
Estimated average invertebrate losses at 10.8%, weed losses at 8.7% and pathogen losses at 5% all occur despite the array of current intensive pest management practices. Tracking over time will tell us how consistent these losses are and reveal the scope for improvements. Addressing the most widespread and damaging pests can help us achieve these improvements. We note that invertebrates, weeds and diseases contribute an average overall loss of 25%.
Fruit rot emerged as the key pest for cranberry growers, according to our survey. This disease was reported on 100% of all surveyed acreage and was responsible for a 3.7% reduction in yield. It was also treated on 96% of the surveyed acreage and averaged 4.5 pesticide applications over the course of the growing season — 1.5 sprays more than the next highest pest. Surveywide, growers spent an average of $84 per acre to manage fruit rot by chemical means.
The two most damaging invertebrate species for cranberry growers were blackheaded fireworm and cranberry tipworm. Cranberry tipworm caused a surveywide yield reduction of 3.2% and was reported present on 51% of the surveyed acreage. Our respondents estimate that cranberry tipworm causes 6.2% yield loss on a typical infested acre.
Blackheaded fireworm was reported by all respondents, infested 97% of surveyed acreage, and was treated on 100% of surveyed acreage. This insect pest was responsible for a surveywide yield reduction of 2.2%. On a typical acre infested by this pest, our respondents estimate a 3.2% yield loss. Respondents sprayed affected acreage an average of three times throughout the growing season. Blackheaded fireworm was also the most expensive invertebrate pest to treat throughout the growing season, at about $48/acre.
Yellow loosestrife caused the largest surveywide yield loss among weed species, at 3%. It was also the most widespread of all single weed species, infesting around 65% of all survey acreage. In this survey, respondents were given the option to assign their weed treatments to broad categories such as “broadleaf weeds” and “woody perennials,” so the extent of treatments targeting specific weeds such as yellow loosestrife is unclear. This will be addressed in future surveys. However, the most expensive weed category to manage was broadleaf weeds, with respondents spending an estimated $92 per acre in chemical management costs.
Twig blight was reported to be the second-most damaging plant pathogen in cranberry in our survey. Surveywide, twig blight was responsible for an average 1% reduction in yield, was reported present on 37% of the total surveyed acreage, and was treated on over 65% of total surveyed acreage. It was responsible for a 2.2% decrease in yield where present and cost an average of $28/acre surveywide.
Surveys of this form have maximum value to IPM advancement when they fully represent a zone of production. Geographical representation is important when weather patterns, soil types, cropping systems and pest pressures vary across a production region.
Local IPM experts are aware of significant local variation in pest pressure. Still, we have not explored this variation, or the relative contributions to the final results that arise from either environmental or human factors. And, although variation in IPM practices between farmers is captured to a limited degree by the different consultants who participated, this report does not explore farmer-to-farmer variation in pest management activities. Our goal is to maximize geographic representation in successive iterations of this process. This will enable us to learn more about the granularity of patterns in IPM practices in both space and time, including variations in pest pressure and management strategies.
Our goal is to increase geographic coverage and the number of consultant participants so that future reports can explore sources of variation and track trends in pest attacks, losses and responses over time.
Appendix 2. Cranberry pest species included in the survey
Diseases
Cottonball, Monilinia oxycocci
Fruit rots
- Godronia cassandrae (asexual: Fusicoccum putrefaciens)
- Phomopsis vaccinii, viscid rot
- Botrytis sp., yellow rot
- Allantophomopsis cytisporea and A. lycopodina, black rot
- Glomerella cingulata (asexual Colletotrichum acutatum), bitter rot
- Coleophoma empetri, ripe rot
- Botryosphaeria vaccinii, berry speckle
- Physalospora vaccinii, blotch rot
Early leaf spot, Protoventuria myrtilli
Red leaf spot, Exobasidium rostrupii
Root rot (Phytophthera), Phytophthora spp., primarily P. cinnamomi
Rose bloom, Exobasidium vaccinii (formerly Exobasidium oxycocci)
Twig blight, Lophodermium oxycocci (most common species) and L. hypophyllum
Upright dieback, Diaporthe vaccinii
Invertebrates
Weevils
- Black vine weevil, Otiorhynchus sulcatus
- Strawberry root weevil, O. ovatus
Blackheaded fireworm, Rhopobota naevana
Brown soft scale, Coccus hesperidium
Cranberry fruitworm, Acrobasis vaccinii
Cranberry girdler, Chrysoteuchia topiaria
Cranefly/leatherjacket, Tipula spp.
Cutworm, spanworm, numerous species
Greedy scale, Hemiberlesia rapax
Cranberry tipworm, Dasineura oxycoccana
Weeds
Alder, Alnus rubra
Arrowgrass, Triglochin spp.
Blackberry, Rubus bifrons (syn. Rubus armeniacus)
Creeping bentgrass, Agrostis stolonifera
Horsetail, Equisetum arvense
Lotus, Lotus corniculatus
Moss, numerous species
Nutsedge, Cyperus spp.
Purple aster, Aster subspicatus
Sheep sorrel (sour dock), Rumex acetosella
Slough sedge (cutgrass), Carex obnupta
Three square, Schoenoplectus americanus
Tussock, Juncus effusus
Willow, Salix spp.
Yellow loosestrife, Lysimachia terrestris
Appendix 3: Survey question outline
General yield and losses information
Respondent crop yield and pricing general information
- Acres managed
- Actual yield per acre
- Maximum attainable yield per acre
- Price received per pound
General factors impacting crop yield
- Overall percent loss due to weather damage
- Overall percent loss due to chemical injury (due to pesticide application)
- Overall percent loss due to insect species
- Overall percent loss due to pathogens
- Overall percent loss due to weeds
- Overall percent loss due to nematodes
- Overall percent loss due to “other pests” [indicate]
- Overall percent loss due to “other factors” [indicate]
Type of production
- Percent acres managed that are certified organic
- Percent acres managed that are transitional
- Percent acres managed that are conventional
Pesticide application data
Air
- Percent acres treated by air
- Average applications by air
- Average cost ($) per acre for a single aerial application (excluding application cost)
Ground
- Percent acres treated by ground
- Average applications by ground
- Average cost ($) per acre for a single ground application (excluding application cost)
Chemigation
- Percent acres treated by chemigation
- Average applications by chemigation
- Average cost ($) per acre for a single chemigation application (excluding application cost)
Pest losses due to specific insect pests
- Number of acres where pest was present
- Number of acres treated for pest
- Average percent yield loss due to pest on infested acres
- Number of applications used for pest
- Average cost of single application (including application cost)
Pest losses due to specific pathogens
- Number of acres where pest was present
- Number of acres treated for pest
- Average percent yield loss due to pest on infested acres
- Number of applications used for pest
- Average cost of single application (including application cost)
Pest losses due to specific weeds
- Number of acres where pest was present
- Number of acres treated for pest
- Average percent yield loss due to pest on infested acres
- Number of applications used for pest
- Average cost of single application (including application cost)
Insecticide application data
- Number of acres treated per insecticide
- Average number of applications per insecticide
- Cost of product per acre
- Target pest
- Average rate of application (low, medium, maximum)
- Timing of application (early, midseason, late or a combination)
- Application method (ground, air, chemigation)
- Historic use of product
Fungicide application data
- Number of acres treated per fungicide
- Average number of applications per fungicide
- Cost of product per acre
- Target pest
- Average rate of application (low, medium, max)
- Timing of application (early, midseason, late or a combination)
- Application method (ground, air, chemigation)
- Historic use of product
Herbicide application data
- Number of acres treated per herbicide
- Average number of applications per herbicide
- Cost of product per acre
- Target pest
- Average rate of application (low, medium, max)
- Timing of application (early, midseason, late or a combination)
- Application method (ground, air, chemigation)
- Historic use of product
Nonchemical insect control practices
- Number of acres where practice was utilized
- Estimated cost per acre
- Target insect
Nonchemical pathogen control practices
- Number of acres where practice was utilized
- Estimated cost per acre
- Target insect
Nonchemical weed control practices
- Number of acres where practice was utilized
- Estimated cost per acre
- Target insect
About the authors

Use pesticides safely!
- Wear protective clothing and safety devices as recommended on the label. Bathe or shower after each use.
- Read the pesticide label—even if you’ve used the pesticide before. Follow closely the instructions on the label (and any other directions you have).
- Be cautious when you apply pesticides. Know your legal responsibility as a pesticide applicator. You may be liable for injury or damage resulting from pesticide use.